The objective of this case study (Weston Bellman et al., 2015a) was to enhance and improve the prediction of facies and geomechanical properties of a shale reservoir interval. The conditioning, analysis and blending of the converted-wave (PS) data into the more conventional quantitative interpretation (QI) will be described to illustrate the successful integration of geological information and seismic attributes (including a 3D multi-component VSP). The results of this expanded QI workflow are compared to those achieved using the P-wave-component-only workflow to show plausible proof of the benefits of QI in this environment in general, and, specifically, of incorporating PS data.
Introduction
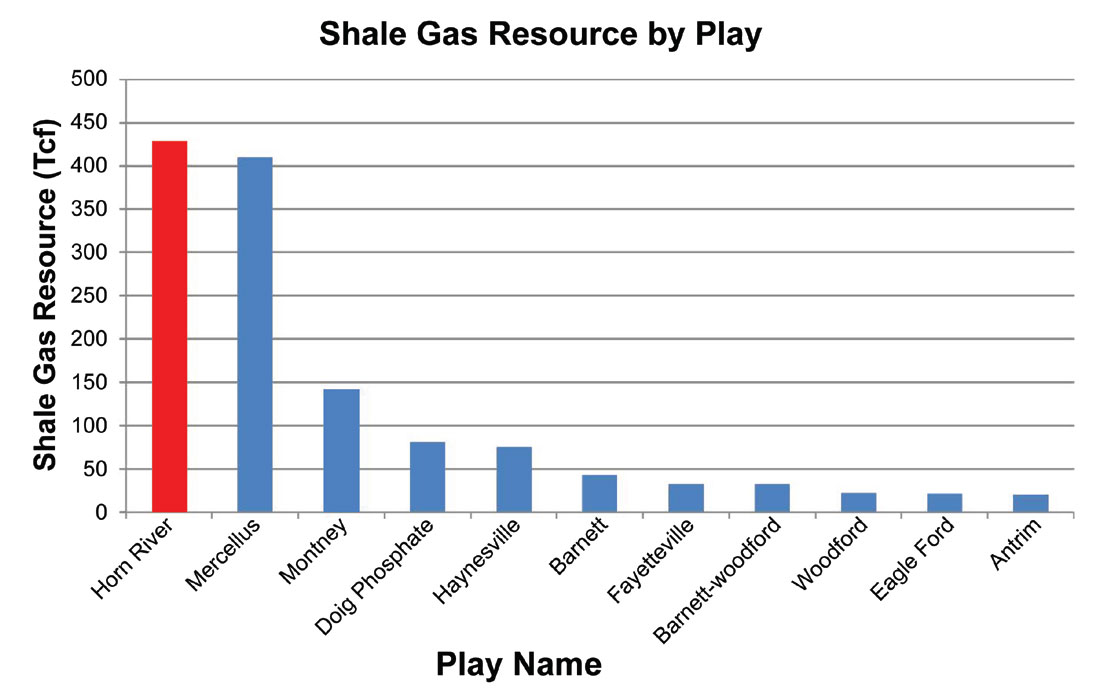
The Horn River shales in northeastern British Columbia contain about 70% of Canada’s total estimated shale gas resource, and the largest accumulation of gas in North America (Figure 1). Nexen Energy ULC holds multiple leases in the area, but this case study focusses on a specific project where a multi-component 3D survey was acquired in 2012.
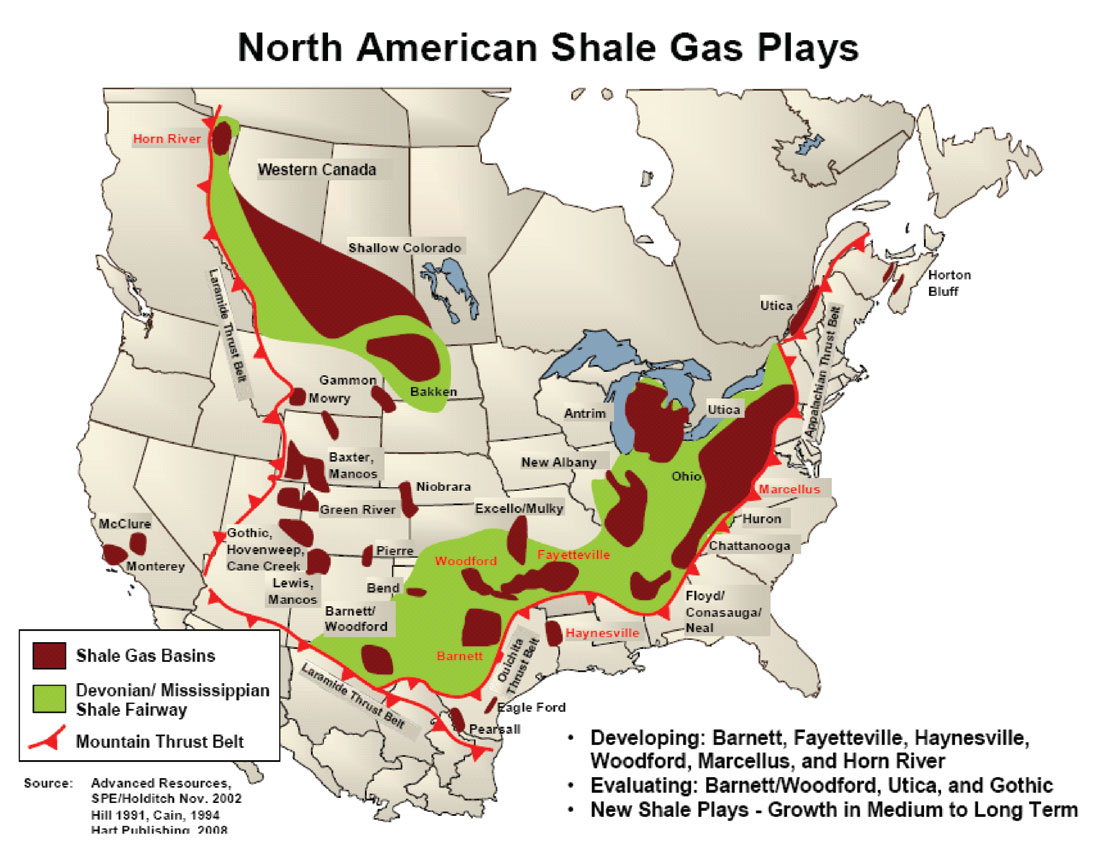
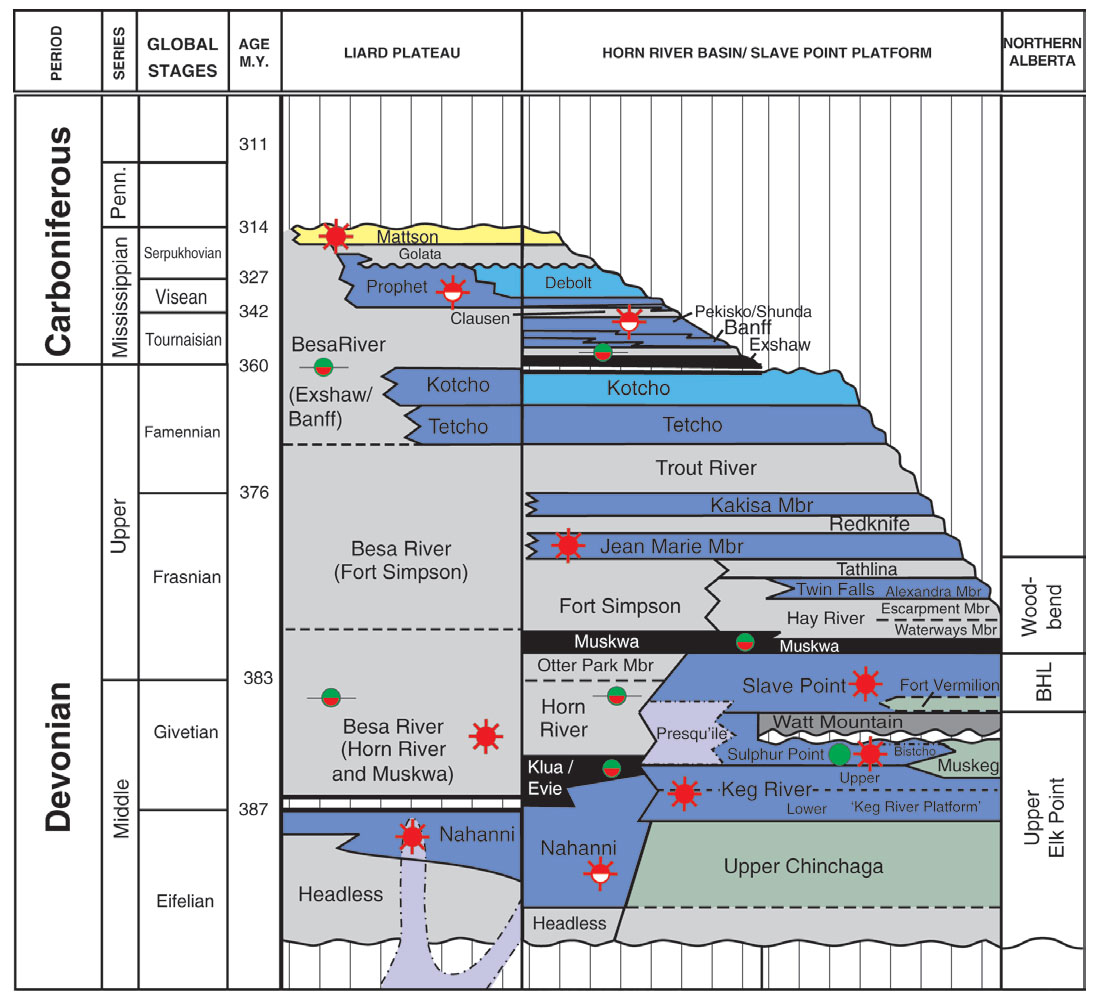
The resource objectives in the Horn River Basin (Figure 2) are the organic shales of the Devonian Muskwa Formation and the Otter Park and Evie members of the Horn River Formation (Figure 3). In the study area, the top of the Muskwa is at a depth of approximately 1850 m and the top of the Lower Keg River platform (base of the reservoir zone) ranges from 1980 m to 2110 m. Commercial quantities of gas can be extracted from these tight shale units using multistage fracturing technology. For this technology to be effective and economic, the wells must be positioned to access high quality reservoir rock, and well-completion techniques must be optimized based, in part, on the rock properties. The purpose of this 3D seismic attribute derivation and analysis study was to predict rock properties in the seismic volume, which can then contribute to effective decision-making regarding drilling and completion. Nexen has been proactive in acquiring the 3D early in the development process, so thorough analysis can focus the drilling program and reduce risk.
PS data are not commonly used by interpreters, mainly due to additional uncertainty in subsurface positioning (both laterally and vertically), complications in processing related to accurate estimation of velocities and statics, anisotropic effects that are much more pronounced than in P-wave data, and most of all, the severe attenuation of high frequencies in the near surface, resulting in considerably lower resolution than in the P-wave data (Stewart, 2009). For these reasons, PS data on their own have been mostly ignored as an interpretive tool, although the workflow employed in this case study has shown promising results elsewhere (Weston Bellman, 2014a). The purpose of this project was to determine if any additional benefit to the quantitative analysis of P-wave data was realized by incorporating the PS information with the PP.
Quantitative analysis of the P-wave data in this study was completed in 2013, resulting in comprehensive predictions of facies and properties such as Young’s modulus, Poisson’s ratio and relative brittleness index (Rickman et al., 2008). The results were summarized in an abstract (Weston Bellman and Leslie-Panek, 2014b) and presented at Geoconvention 2014. Subsequently, the converted-wave component of the 3D seismic was analyzed, in addition to a 3D VSP, which was, in turn, integrated into the predictions from the first phase. This paper will focus on the workflow implemented to achieve that multi-component integration.
Method
QI is the process of relating seismic amplitude measurements directly to rock and fluid properties, and using these derived relationships to convert seismic data to geological predictions (Hunt et al., 2012, Weston Bellman, 2006, Avseth et al., 2005). Simple to say, but the execution is complex, sensitive to subjective parameter choices and dependent upon assumptions (that may be inclined to interpretation biases). For these reasons, we affectionately refer to the process as QQI or qualitative quantitative interpretation. The workflow employed in this project was constrained as much as possible by known quantities, and subjectivity was mitigated by parameter scanning and quantitative measures of assessment (where possible – difficult in practice when there are only a few wells with uncertainty of their own).
The main elements in our multi-component workflow comprise the following general categories:
- Well data QC, elastic property computation and crossplotting for cluster and trend identification
- Seismic data QC, conditioning, and seismic attribute and elastic property derivation
- Seismic calibration to 3D VSP, depth conversion, and registration between PP and PS data volumes
- Combined mathematical multi-attribute analysis, in the depth domain, for specific properties
- Interactive conversion of elastic properties into facies and rock property classes using QI-Pro™
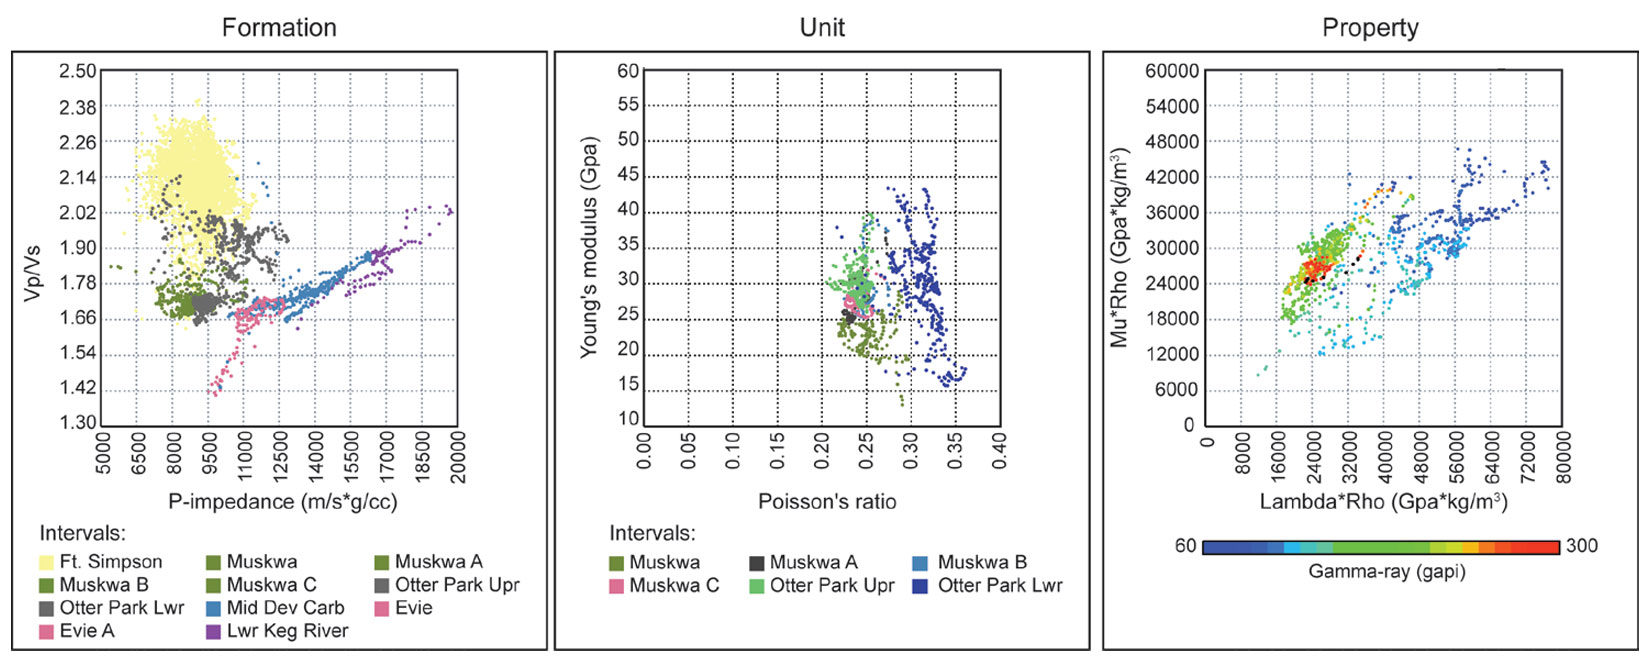
In order to understand geological properties in the context of elastic properties (seismically-measurable quantities), the wells require thorough analysis for both quality and reasonable petrophysical interpretation. We start with a visual inspection of recorded wireline logs and the computation of elastic-property logs. Figure 4 shows a log layout with the intervals identified in three levels of detail: The group (labeled on the right), the formation (labeled on the left and coloured) and the fine scale unit distinctions identified in the tops. All scales are important for analytical input to and validation of the QI workflow. The logs shown on this display include acquired logs such as gamma-ray, density and sonic, plus elastic property logs (computed from sonic and density logs) such as P-impedance, Young’s modulus and Poisson’s ratio. The significance of these particular properties will become apparent later.
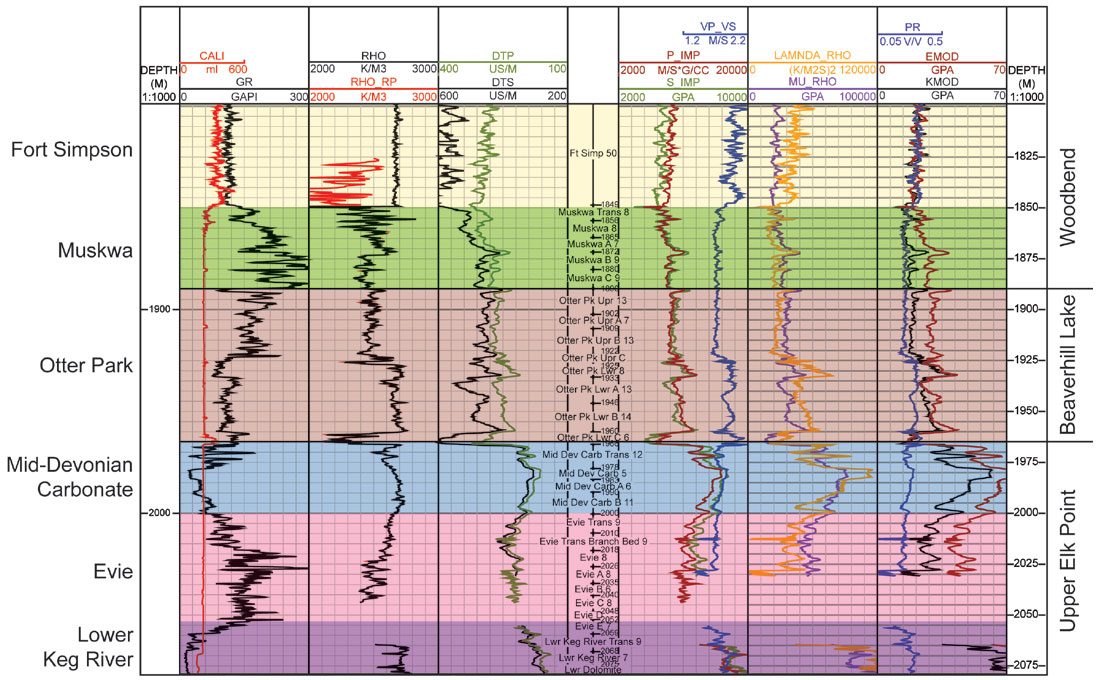
Figure 5 illustrates how the elastic properties computed from log data are compared to geological properties. The crossplots in this figure show data points represented by an XY-pair of elastic properties, and coloured by an observed geological property. The elastic properties defining the crossplots have been specifically chosen for their tendency to distinguish the points relative to the chosen geological attribute. The essence of QI is to use these distinguishing relationships to predict the geological attributes from seismic data using elastic properties that are derived from seismic data (Iverson et al., 2013, Andersen and Gray, 2011, Goodway et al., 1997). The challenge of QI is to obtain these elastic properties from seismic data accurately enough and precisely enough to use the log-derived relationships literally. We will tell you right now, that literal translation never happens. We always have to work with less-than-perfect seismic representations of elastic properties (and log data is not always perfect either), so a workflow that allows a periodic ‘manual override’ combines the best of all worlds (literal, approximate and creative). Nevertheless, the aim of the QI workflow is to make the seismic attributes the best they can be with the best input data, the best assumptions, the best parameter selections and the best tools (as fast as we can, of course; time is, as they say, money).
Seismic data are very different from log data. The seismic workflow required to determine a property such as Poisson’s ratio is not nearly as straightforward as the simple computation from log data. What seismic data lack in precision, however, they make up for with sheer volume of information, especially when multi-component data are included.
With this kind of redundancy, in the absence of absolute values, trends, least-squares solutions and reasonable constraints are necessary. Much of the constraining information comes from the wells in the form of Vp:Vs relationships, low frequency models of P-impedance, S-impedance or density, time-depth relationships and attribute dependencies between the main elastic properties. Appropriate yet cautious use of well data in these steps is critical to the outcome (Weston Bellman, 2015b).
Results
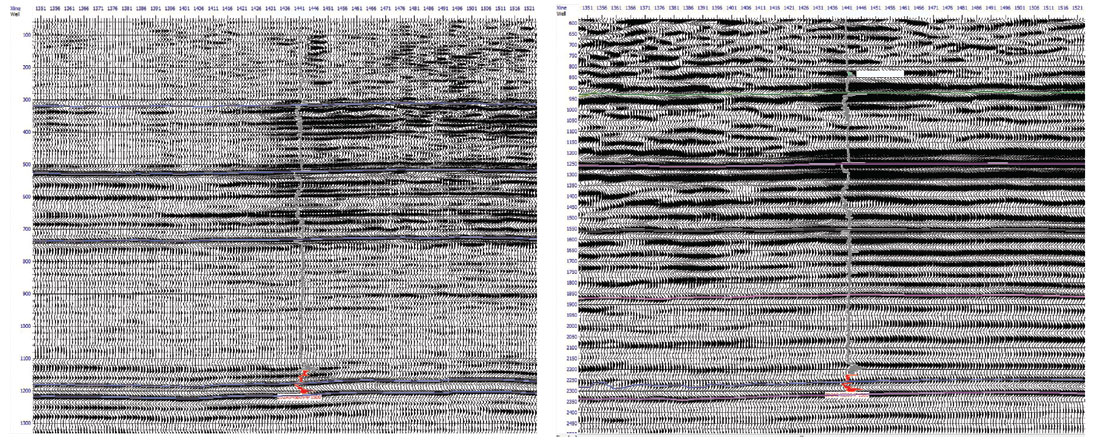
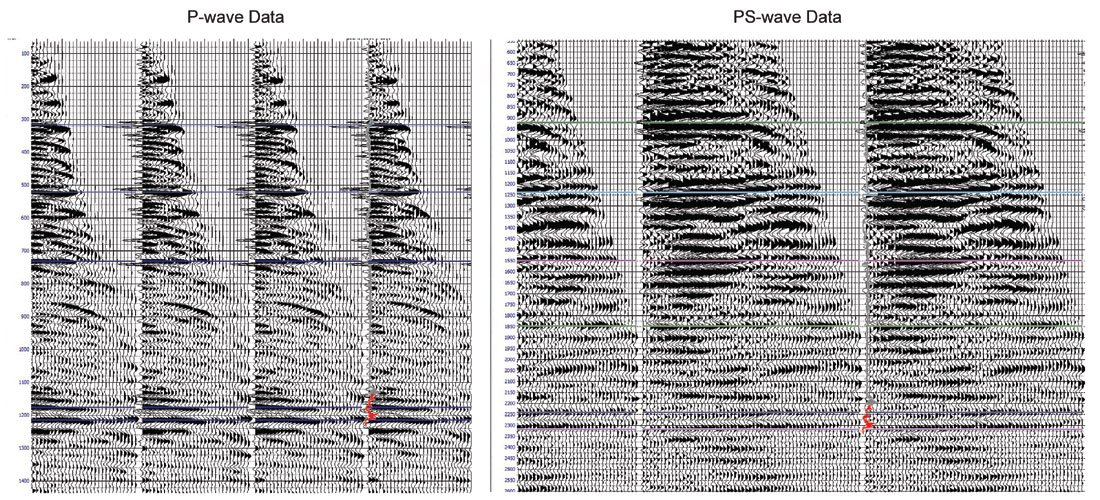
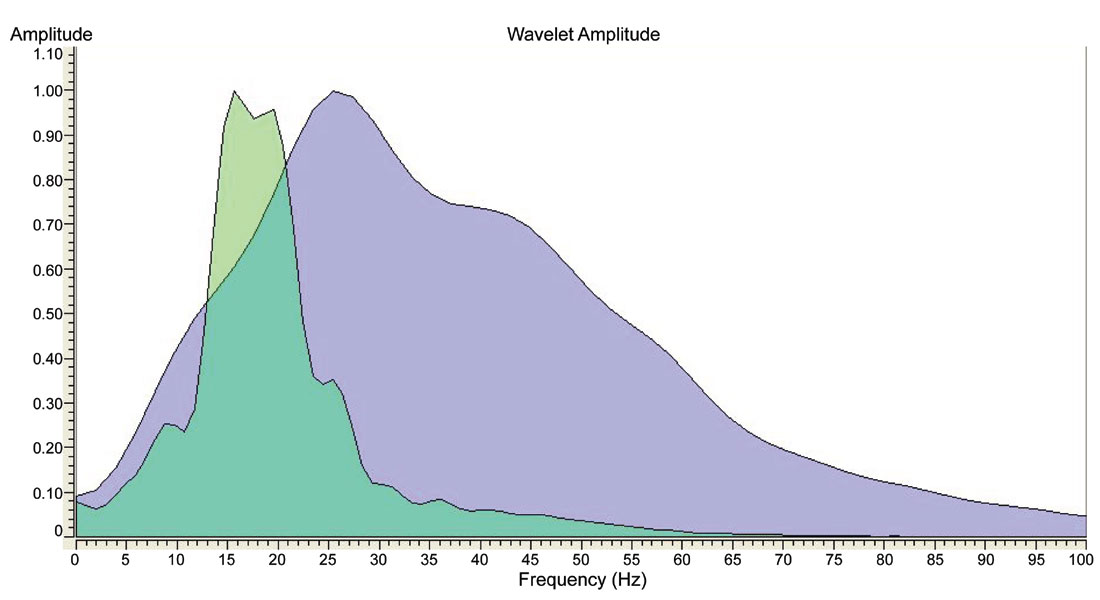
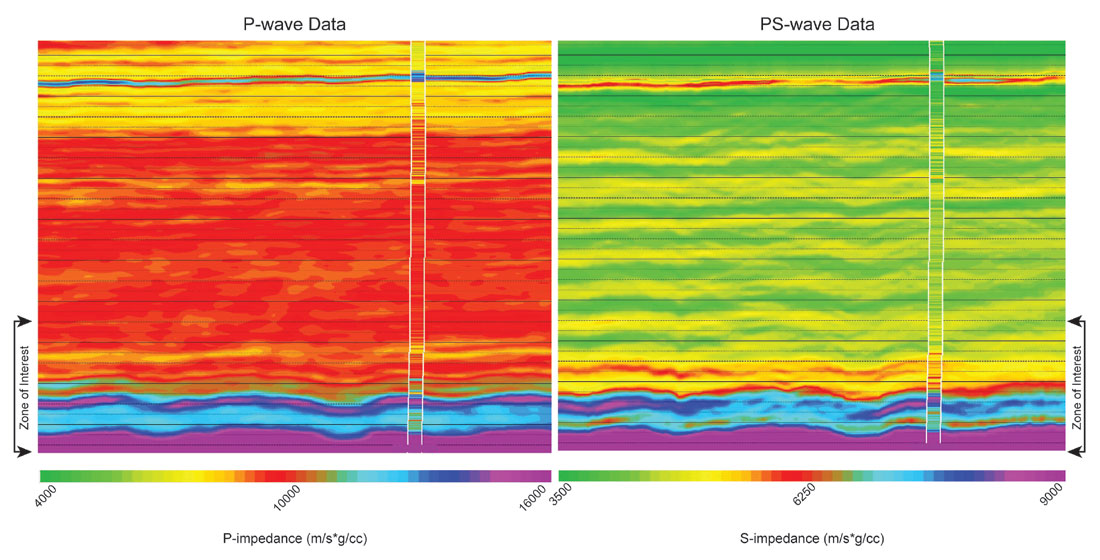
The stacked seismic data available for this study are displayed and compared in Figure 6, illustrating the similarities and differences in character, frequency content and amplitude variation; the pre-stack data are shown in Figure 7. The vertical time scale of the PS data in these figures has been adjusted to approximately match that of the P-wave data. Nevertheless, it is apparent that the PS data are, even at this squeezed scale, lower frequency. The amplitude spectra of each stacked data type (in original time scales) are shown in Figure 8 and highlight the significant difference in original frequency content. An interesting feature to note (Figure 7) is that while there is an obvious multiple problem present in the pre-stack P-wave data (these are complex residual interbed multiples remaining after several passes of multiple-removal), the PS data are ‘clean’ in that regard. This observation alone gives us encouragement that there may be unobscured signal in the PS component. But, will that information be sufficiently valuable in the low resolution context of this data type?
In addition to potential shortcomings related to the low PS resolution, another source of error in assimilating converted-wave data is the uncertainty in choosing joint inversion parameters. This uncertainty can be compounded by inaccurate time-registration between the two data types, which is a prerequisite for joint inversion. The workflow designed for this project mitigates these issues by first deriving pre- and post-stack attributes on the separate volumes in time, then depth registering these attributes using velocity information from the VSP, and finally combining the PP and PS attributes in multi-attribute analyses in the depth domain (Weston Bellman, 2014a).
To accomplish the first step in this joint analysis procedure, AVO attributes, including P-reflectivity (Rp), S-reflectivity (Rs), and density reflectivity (Rd), were computed from the pre-stack, AVO-compliant, PP PSTM gathers using and comparing several methods (Aki and Richards, 1979; Fatti et al., 1994, Shuey, 1985). Pre-stack PS attributes (as approximations to Rs) were computed from full and offset-limited stacks of the PS gathers. The various attribute stacks were then converted from reflectivity volumes to impedance properties (Figure 9) using model-based pre- and post-stack inversion algorithms with appropriate low-frequency models derived from log data. At this point, we have five S-impedance derivations to evaluate: pre-stack inversion of P-wave data (2013 project), post-stack inversion of the PS PSTM stack, and inversions of three ranges of offset-limited stacks of the pre-stack PS PSTM gathers. How do we decide which version comes closest to the truth? We can compare to well data of course, but we only have a few dipole sonic logs from which to derive S-impedance logs. Fortunately, we can also compare to inversions of the 3D multi-component VSP (which will be described in more detail later) to get some direction and confidence in the correct choice.
The PP and PS workflows to this point had been conducted in parallel, but in their separate time domains. Using time-depth relationships derived from the multi-component VSP, and P-wave and S-wave velocity measurements from dipole sonic logs, accurate velocity models were constructed in order to convert all computed attribute volumes from their separate time domains to a common depth domain. When registered in depth in the manner described, the calculated elastic properties can be correlated to each other, and to well logs, with confidence. This is beneficial for both crossplots and mathematical multi-attribute analyses.
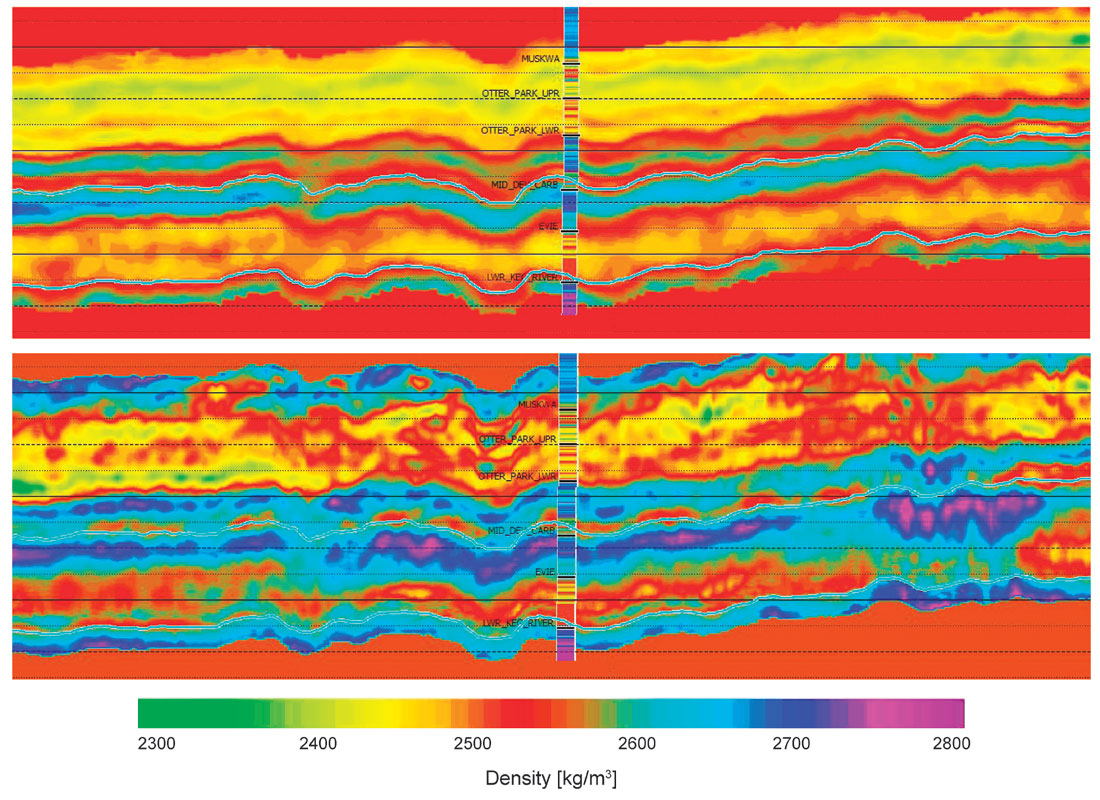
To carry out the combined analysis, all seismic attributes in the depth domain were included in a mathematical multi-attribute procedure to predict density (Russell et al., 1997). Density is difficult to predict directly from seismic data, yet it is a useful geological property on its own, and a fundamental component of other derivative elastic properties such as Young’s modulus. Figure 10 shows the density prediction resulting from the previous (2013) multi-attribute analysis using only P-wave attributes compared to the updated result that includes PS attributes. While the 2013 result was considered very good (compared to the match with density logs at wells), it is quite apparent that by including low resolution PS attributes, we are indeed able to increase the resolution of the prediction. At first glance, it looks like this is a noisier result, but it corroborates the S-impedance findings (particularly when the mid-offset inversion is used), and the comparison with the well logs is consistently better. You will also see evidence in the next paragraph, using the 3D VSP, that the geology is, as usual, more complex than originally thought.
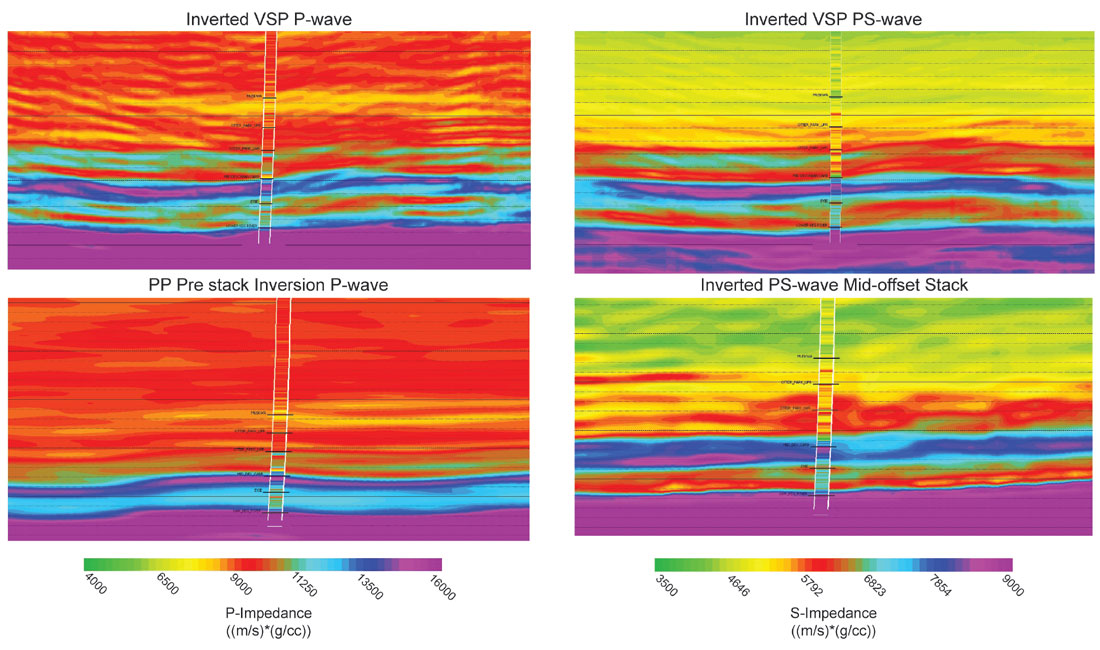
A similar analysis of the multi-component 3D VSP, including inversion, was done at the same time to create high-resolution, arguably more accurate (due to the general belief that VSP data is more reliable than surface seismic data), impedance estimates for comparison to and validation of the surface-seismic equivalents. Figure 11 shows the comparison between the P- and S-impedance attributes for both VSP and surface-seismic data. Interestingly, the S-impedance derived from the VSP has comparable character and resolution to the inversion of the mid-offset PS data. Because of this similarity, the mid-offset S-impedance was chosen for the subsequent computation of elastic properties for the final step of the process: correlation to geological properties using crossplot classification.
Circling back to the relationships derived on the crossplots of well data, we can now substitute the optimum seismically-derived elastic properties on the axes and define categories of multiple seismic attributes that directly represent geological properties (Figure 12). As described earlier, the literal translation of log-derived relationships to the seismic data substitutions is generally not ideal due to inaccuracies and uncertainties inherent in both seismic data and log data (despite our best efforts). Therefore, we use an interactive tool, designed specifically for this purpose, to appropriately adjust and calibrate the geological property categories to realistic seismic representations, validated by known conditions at well locations.
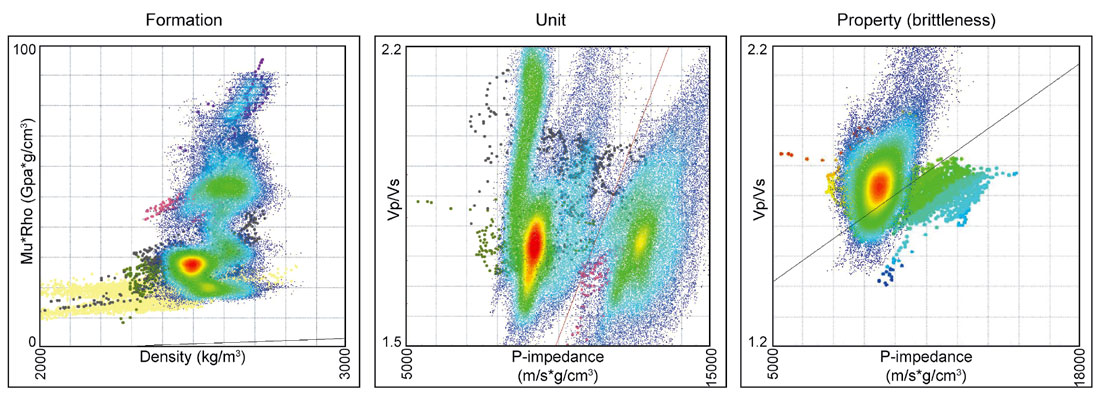
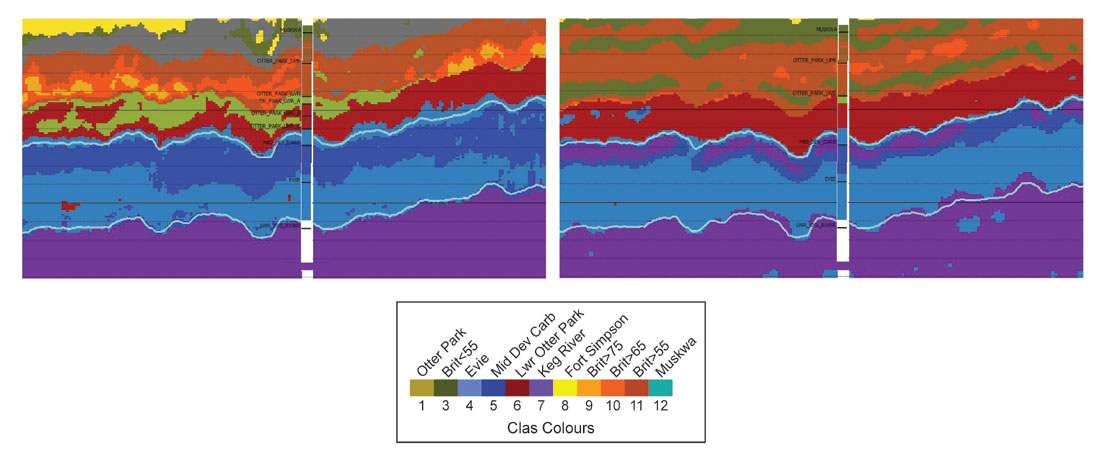
Figure 13 shows the final classified volumes (with and without using the PS data and attributes) after all data have been integrated and all steps in the process completed and optimized. In this particular version of the ‘qualitative quantitative interpretation’, geological intervals have been classified and the Muskwa and Upper Otter Park have been selected for further subdivision by relative brittleness index. The actual geological intervals and computed relative brittleness index are shown at the well location, confirming that the additional detail apparent in the integrated multi-component result is reasonable.
Conclusions
The case study described in this paper has shown that with attention to detail in well analysis and accurate seismic attribute derivation, calibration and classification, PS data can be merged with PP data to provide improved results in a QI workflow; this, in spite of the apparent shortcomings and multitude of uncertainties in converted shear data.
The objective of this project was to assess the benefits of incorporating the PS data into the QI workflow, and, if possible, to improve the prediction of geomechanical properties for shale resource development optimization. The differences in QI results between the two methods and potential improvement with PS data can only be definitively assessed with additional accurate log data (including measured dipole logs) from future drilling. However, additional detail is indeed apparent in the combined facies and property predictions, in some of the layers of interest, which contributes to greater resolution and confidence of rock property predictions as assessed by the multi-component VSP and the small number of well ties.

Acknowledgements
The authors would like to acknowledge Nexen Energy ULC and IGBC for their generous permission to share the results of this case study.


Join the Conversation
Interested in starting, or contributing to a conversation about an article or issue of the RECORDER? Join our CSEG LinkedIn Group.
Share This Article