A magnitude-based, traffic light protocol is the most common mitigation approach to injection-induced seismicity, adopted by both regulators and operators throughout North America (Table 1). Despite challenges associated with a protocol based on an estimate of seismic source strength, magnitude-based protocols still prevail over alternatives such as using measured ground motions. Regardless of the attribute adopted to trigger alert levels, the resultant question becomes what operational change should be made to best mitigate seismic hazard. In this paper, a workflow is discussed which uses a combination of field monitoring data and a geomechanical model to evaluate and rank the effectiveness of different operational scenarios.
Introduction
A fundamental requirement for an effective mitigation program based on seismic monitoring is detection of the background seismic activity, which can provide a warning of problems to come. This is also the central premise of a magnitude-based traffic light system, that larger ‘red light’ events can be avoided through mitigation at lower ‘yellow light’ levels. While such an increasing magnitude scenario is one end-member, the opposite would be a rogue event representing a single large event without precursory, background activity that sometimes occur (greenred light sequence compared to green-yellow-red). Such a rogue event could occur without any preceding activity, or with very small magnitude events that may or may not be detectable. The presence of weak precursory activity is important, in that the background seismic activity then becomes critical for characterizing seismically active faults.
The presence or absence of small magnitude, background activity is often a detectability issue. Of course, detecting weak background activity is not an indication of increased seismic hazard or even more fundamentally, not an indicator that more earthquakes were induced. Seismic hazard will be associated with the larger magnitude events that are detectable with regional arrays. More sensitive local arrays are useful to increase the recording sensitivity and provide high resolution, diagnostic information of the seismic response and potentially fault characteristics. Since seismic magnitudes follow a power-law relationship (the Gutenberg-Richter relationship), any improvements in the smallest detectable magnitude results in more detected background activity, as is seen in microseismic imaging. However, the majority of the energy release, and hence hazard, is associated with larger events that can be detected with regional arrays. From a technical perspective, significantly more information can be gleaned from the background microseismicity around magnitude 1. Improved interpretation and a better assessment of seismic hazard can be made with enhanced sensitivity.
Once an alert is triggered, operations should be changed to mitigate additional seismicity. AER’s subsurface order 2015-007, for example, requires that with a local magnitude 2 yellow light event, the operator “must implement its induced seismicity plan in a manner that eliminates or reduces further seismic events caused by or resulting from hydraulic fracturing operations”. While the recorded seismicity may provide insights into the causal circumstances leading to the alert, a mitigation plan should already be in place. Some operators have adopted even more stringent alert levels to avoid regulatory issues. The essential question becomes, what to change and by how much to reduce the seismic hazard. Reducing volume or rate is a common tactic, especially with hydraulic fracturing, with various evidence suggesting that volume may correlate with maximum seismic magnitude. However, economic considerations should also be taken into account to optimize future production while reducing hazard, since effective stimulation is the fundamental reason for the hydraulic fracturing operations. Here, a workflow is described to use a quantitative geomechanics model to rank relative seismic hazard. The workflow relies on seismic monitoring data to calibrate the model and constrain the geomechanical input data, including fault properties. Once calibrated, the model can be used to test various operational strategies and rank these based upon relative seismic hazard. The workflow can be done either retrospectively to investigate a particular hydraulic fracturing sequence, or more generally to examine alternate well and completion designs for proactive mitigation of future developments.
Montney Hydraulic Fracturing Monitoring Example
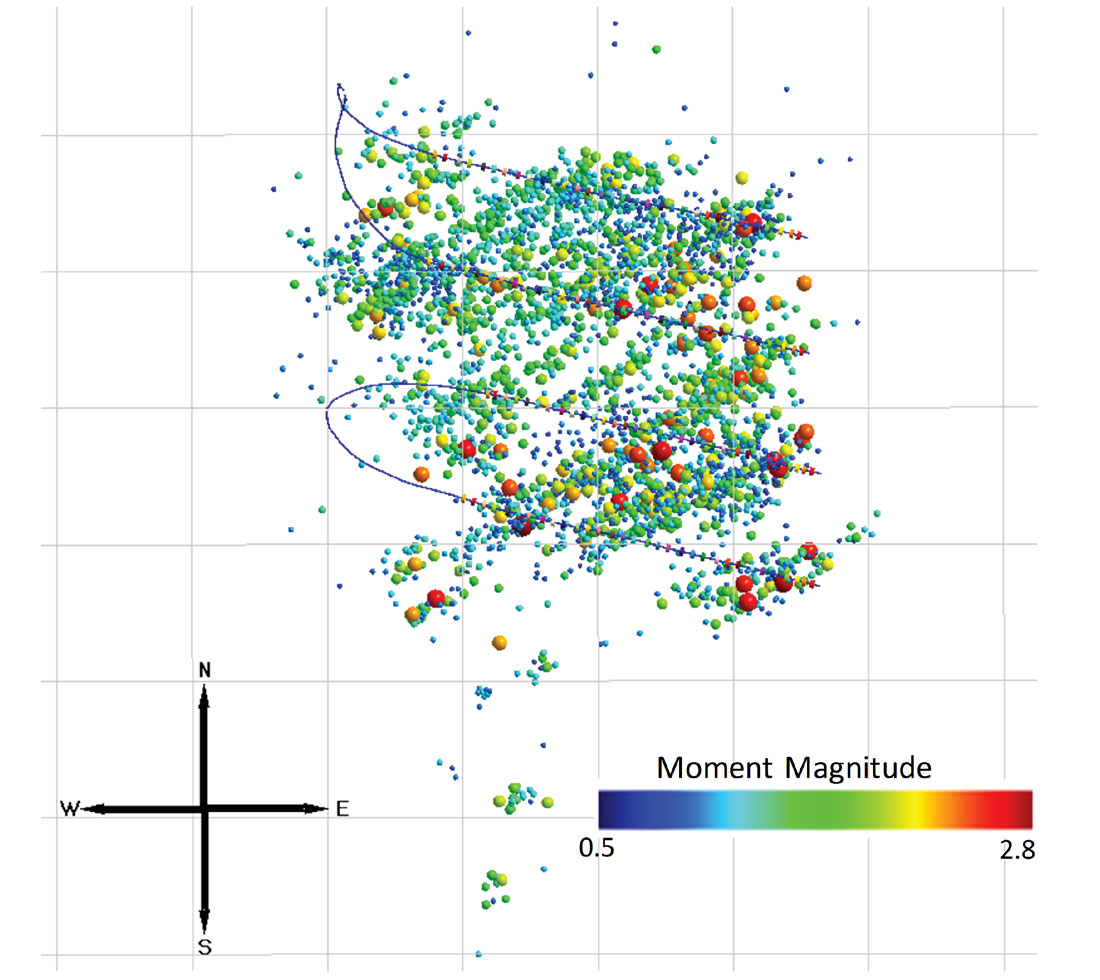
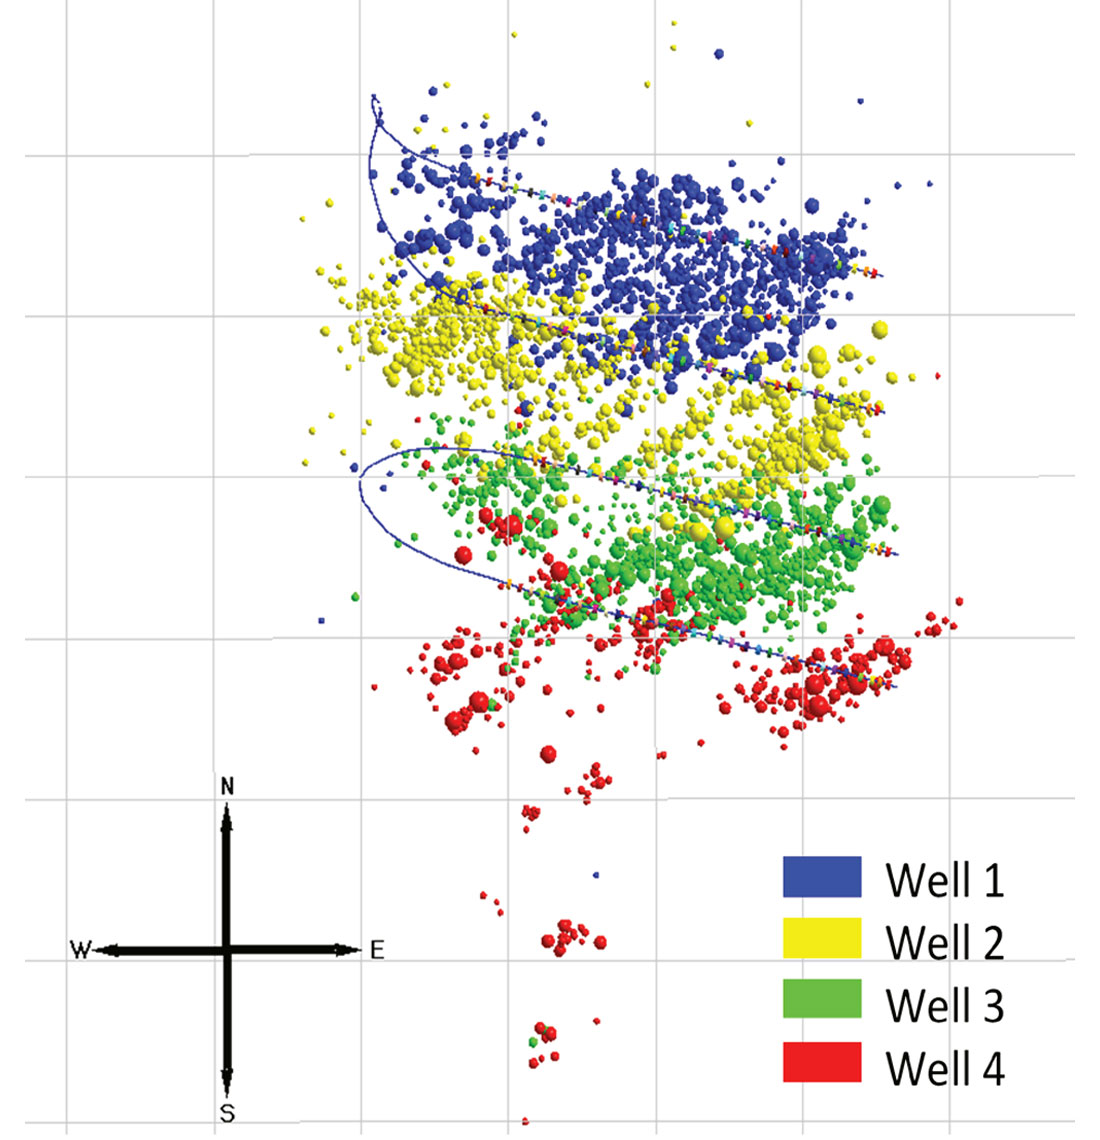
By way of illustration using enhanced sensitivity to understand seismic response, Figure 1 shows hydraulic fracture induced seismicity recorded during completion of four Lower Montney wells. The seismicity corresponds to moment magnitude range between approximately +0.5 and +3, and illuminates several NE-SW trending lineaments that define faults being activated by the wells. In this example, each subsequent completion stage and well extends the seismically active portion of the lineament, with little overlap in seismicity in the previously seismically active zones. Individual fault lineaments may cross multiple wells as depicted in Figure 2. Focusing on a lineament where the largest event recorded during the project (Mw=2.8) occurred, the seismicity starts and stops during the fracturing of a few stages at the intersection of the lineation and each well. In this case, the largest magnitude event occurred during fracturing of the final well.
There are two specific observations in this example that demonstrate important aspects of the seismic response. Firstly, the seismicity stops rapidly once the stages pass the intersection of the individual fault. In many other cases, seismicity continues for some time, even if the causal injection point has moved away from the fault. The lack of remnant seismicity in this case could be an indication that the fluid leaks off rapidly from the fault and thereby the fault stabilizes, or that the excess shear stress has been released. Secondly, the seismicity does not reoccur in a fault patch after the initial slip. Again, this characteristic could be associated with rapid fluid leak-off, such that the fault stabilizes after the initial slip and corresponding seismicity ceases. Alternatively, the fault could slip aseismically after the initial seismic activation. Perhaps in this case, these responses are an indication that seismicity would not be expected after active injection ceases. Regardless of the details of the fault mechanisms, the seismicity has unique aspects that characterize the seismic response at the site and can inform mitigation decisions.
More generally, this specific example illustrates identification of seismically-active faults using the background seismicity, that can then be used to decide upon an appropriate mitigation strategy regardless if a seismic alert is triggered. Note that in this particular case, the seismicity did not trigger a regulated alert although still provides critical information about the seismic response.
Operational Changes
In addition to monitoring, a key element of a traffic light system is an effective mitigation strategy to reduce future seismic hazard. The basic mitigation objective is to avoid faults and reduce subsequent seismicity if an unexpected fault is encountered. An implied secondary objective is, of course, to stimulate an economic well.
Avoidance implies being able to map faults and pre-characterize the associated seismic potential prior to operations. However, fault detection in 3D seismic volumes is often challenging, especially for strike-slip faults. Nevertheless, faults that are identified with orientations that are preferentially aligned to the stress field (maximum shear-stress) can be avoided. For hydraulic fracturing, however, high net pressures can enable faults that intersect the hydraulic fracture network to potentially slip regardless of orientation. For waste disposal injection, pressure changes are smaller and only preferentially oriented faults will tend to slip. In addition to identifying faults in orientations susceptible for slip, the seismogenic potential of individual faults is also important to quantify the expected seismicity associated with fault slip. Currently there do not appear to be any rigorous means to pre-characterize seismic hazard, other than empirical observations as injection occurs or from previous experience in a region.
Once problematic seismogenic faults are identified with local seismic monitoring, the mitigation objective is to avoid or minimize additional fault slip. Generally, this implies avoiding further increases in pressure and/or increasing the activated area of the fault. During hydraulic fracturing this predominantly means avoiding subsequent hydraulic fracture growth into the seismically active fault. Although poroelastic stress changes can also result in fault slip, the more probable mechanism is the high injection pressures within the hydraulic fracture network.
The following lists potential operational changes that can be employed:
Reduce Volume. A common mitigation is to reduce the injection volume which has been hypothesized to correlate to seismic magnitude (e.g. McGarr, 2014). Empirical data is less clear, although cases with large magnitude events do appear to occur during large volume treatments (e.g. BCOGC, 2014, Maxwell, 2013). Conceptually, reducing volume is a good approach since the area of fault activation will tend to correlate to injection volume, and with increased volumes hydraulic fracture dimensions will increase and thereby increase the probability of encountering a problematic fault.
Reduce Rate. Rate reduction is also a common tactic, with and without an associated reduction in total volume, and will also have a favorable tendency to reduce net pressure. However, empirical data is unclear in terms of the impact of rate reduction. In certain cases, decreasing rate could also reduce height growth and possibly increase fracture length, thereby unintentionally increasing the chance of encountering a fault.
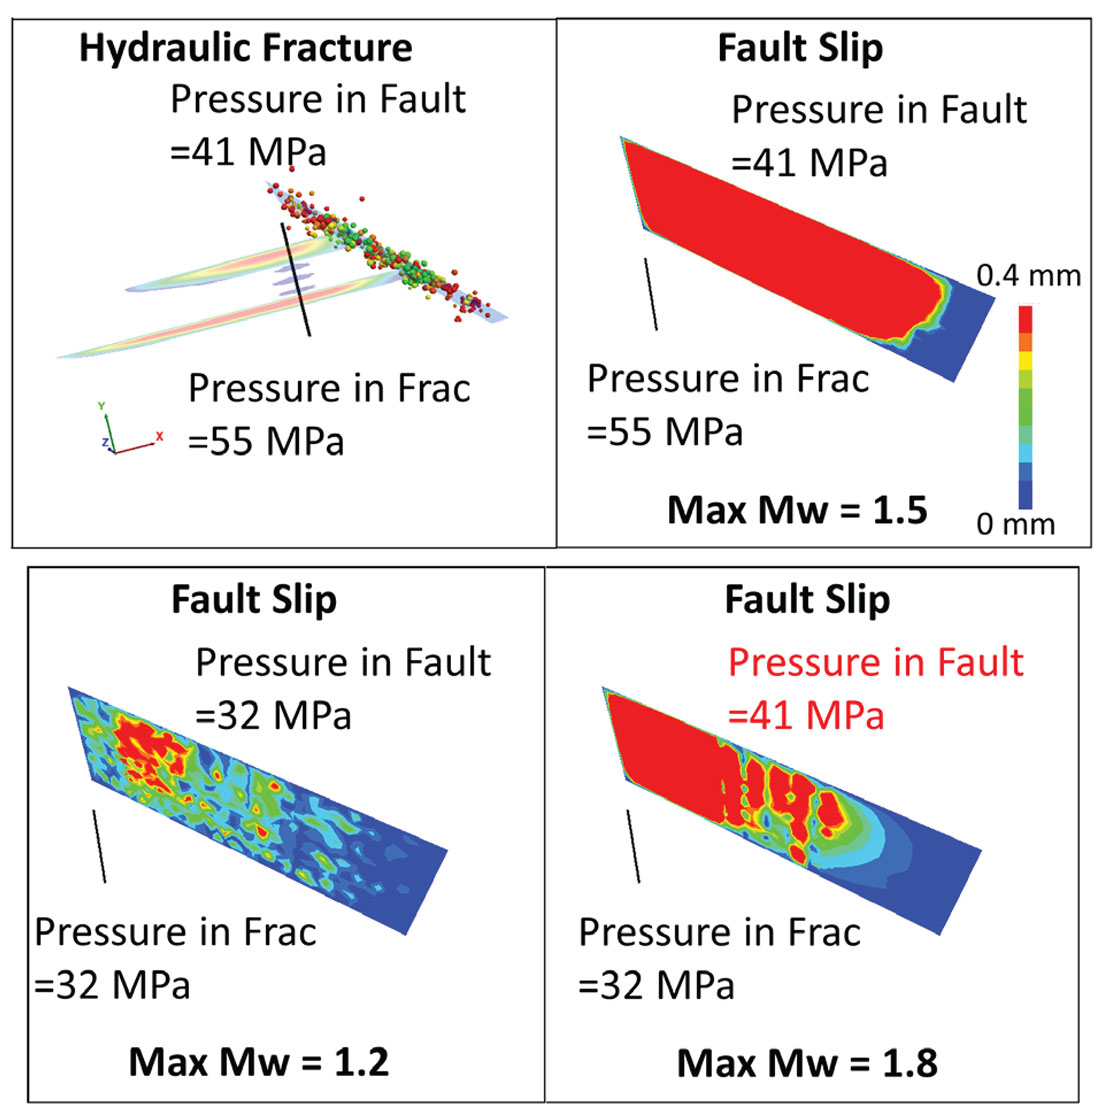
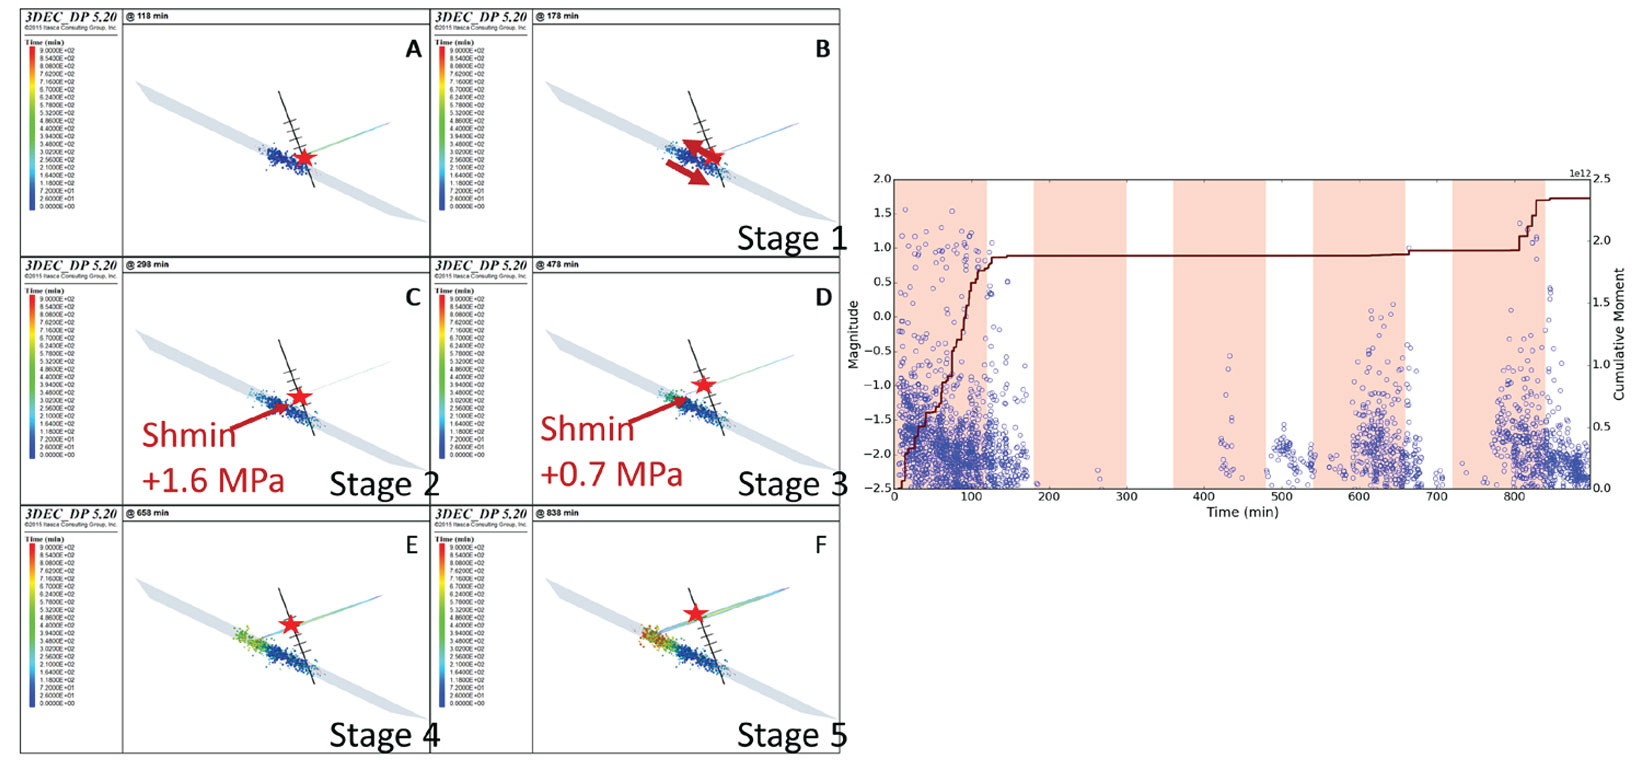
Shutting In/Flowing Back. Shutting in the well, even for a short time, allows pressure to naturally diffuse to stabilize a fault. Flowing back a well, in principle, further reduces pressure and thereby accelerates stabilization of activated faults, although it does require additional preparation and onsite logistics for handling produced fluids. However, some of the largest hydraulic fracturing induced events have occurred during shut-in or flow back. While this association could merely be happenstance, causal mechanisms could be postulated. For example, Figure 3 shows a modeling example (see Maxwell et al., 2018, for description of the model) looking at two shut-in scenarios (Zhang and Maxwell, 2017). In this example, a stimulated fracture network grows into an optimally oriented fault leading to small magnitude induced microseismicity. After the fracture stage, two scenarios of pressure reduction are simulated. In the first, the pressure in the fault and the hydraulic fracture are kept equal. The fault slip and modeled microseismic magnitudes reduce as pressure dissipates and the fault stabilizes as the hydraulic fractures close. In another scenario, a pressure disconnect is assumed between the hydraulic fracture and fault, such that the pressure is reduced in the hydraulic fracture while the fault remains pressurized. In this case, poroelastic stress changes associated with the hydraulic fracture closing causes additional fault slip and larger magnitudes are predicted (Mw~1.8) in the model compared to the hydraulic fracture stage (Mw~1.5). While this pressure disconnect is a conjecture imposed on the model, it could potentially happen as a result of stress changes during fault slip, closing the hydraulic fracture intersection with the fault.
Skipping Stages. Once a problematic fault is encountered, future problematic stages that would also intersect the fault can be determined. Skipping these problematic stages can reduce additional fault slip, although identifying how many stages and determining the critical offset from the fault may not be obvious.
Changing Fracture System. Changing the fluid viscosity or proppant could change the hydraulic fracture geometry, and will be discussed later.
Changing Completion Design. Changing the completion design, within practical logistical constraints, could reduce fault activation. For example, poor perforation cluster efficiency could result in longer fracture dimensions. Preferential growth at fewer than designed fracture initiation points could then result and cause increased fault slip. Controlling perforation breakdown by using diverters, for example, could mitigate additional fault slip.
Changing Well Design. An important unresolved question is whether drilling wells at an angle to the minimum stress direction impacts the seismic potential of a fault.
In summary, several operational changes could be made, each having potential impacts on seismic hazard and also cost-based impacts. However, determining how much a certain parameter should be changed for effective mitigation is uncertain. Furthermore, it may not be clear which option would be most effective. Often the mitigation strategy is based on opinion; however, in the remainder of the article a geomechanical workflow will be described that can be used to quantitively rank the effectiveness to mitigate seismic hazard.
Geomechanical Calibration of Induced Seismicity
Interpretation of induced seismicity can illuminate fault structures and quantify the seismic potential. These seismic interpretations are often qualitative with respect to the geomechanics of the fault activation and fracture network behavior. Particularly during multi-stage interaction with a fault system, the detailed seismicity patterns can show an intricate relationship to the fracturing. Complications can arise, for example, due to fracture interactions and stress shadowing between fracturing stages, perforation clusters and stress changes associated with the fault slip (e.g. Maxwell et al., 2018). A geomechanical analysis can be employed to history match field observations to qualitatively interpret the seismic parameters and account for fracture interactions.
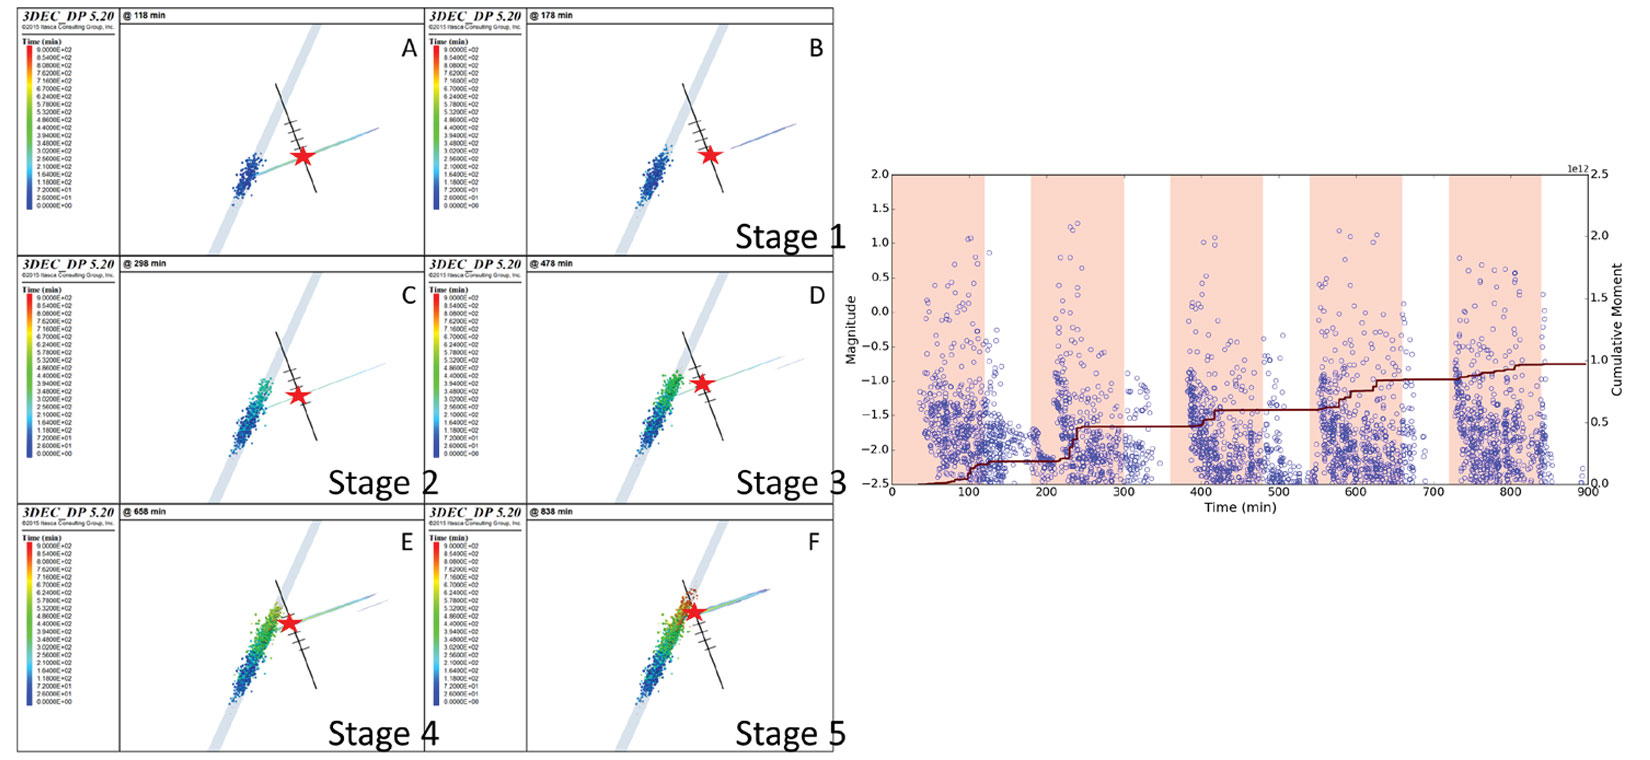
As an example of the impact of relatively simple differences in a fault relative to a hydraulic fracture network and how significant changes in the seismic response can occur, consider Figures 4 and 5. A multistage hydraulic fracture is modeled, where the azimuth of the fault relative to the stage sequence is changed. A significant difference in the estimated seismicity occurs with this basic difference, illustrating that relatively complex phenomena can occur with subtle model changes.
A geomechanical simulation, calibrated by history matching (e.g. Chorney et al., 2016) with seismicity along with whatever additional hydraulic fracture diagnostics are available, is a powerful method to interpret the fracture network details in light of the observed seismicity spatial, temporal and intensity patterns. Including additional calibration constraints from field measurements of microseismic, deformation, pressure hits, and/or temperature, improves the accuracy of the model and minimizes potential non-uniqueness in the model. Interpreting induced seismicity in the framework of such a history matched framework will improve the understanding of the causal factors associated with the fault response. Furthermore, the calibrated model can be used to assess the impact of different operational mitigation strategies.
Ranking Mitigation Options
Using the calibrated geomechanical model, different operational scenarios can be simulated and used to forecast the expected seismicity. Modeled seismicity can be compared and used to quantify the relative hazard of each and ultimately rank the relative hazard expected from various operational scenarios. Potentially, reservoir flow models could also be run to simultaneously estimate the expected production from the resulting fracture network. In this way, trade-offs can be explored between the seismic hazard and expected wellbore performance to provide an optimized strategy.
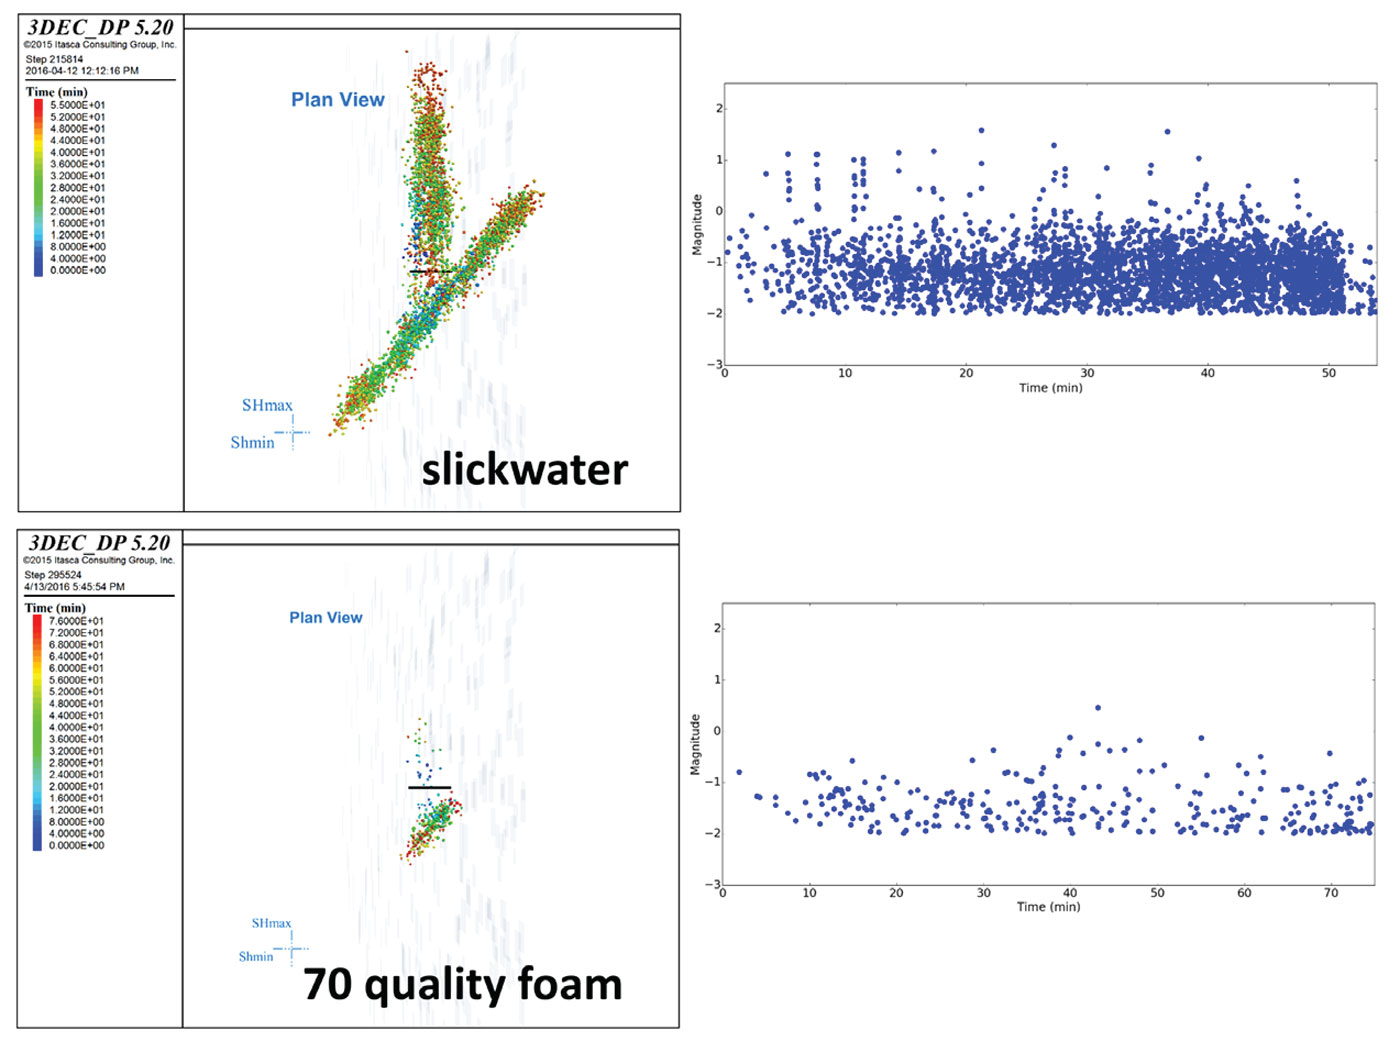
As an example of quantifying the relative seismic hazard, consider the case shown in Figure 6. In this example, a geomechanical model is calibrated with recorded microseismicity during a Horn River Basin microseismic project. Fault activation is then investigated for different hydraulic fracturing fluid systems, comparing fault activation and induced seismicity expected from a slickwater fracture with a more viscous fluid such as a gel or energized system. In this example, changing the fluid viscosity has a significant effect on the hydraulic fracture dimensions and the extent of fault activation. A reduced fault area with the viscous fluid scenario results in lower total seismic moment release and also lowers the magnitude of the biggest modeled seismic event. The relative seismic hazard is estimated to therefore be reduced and this can be considered as an effective mitigation strategy. In a similar way, several mitigations strategies can then be quantitatively compared and ranked by effectiveness.
Conclusions
The most effective way to characterize problematic faults and the associated seismic response is through seismic monitoring with a sensitive local array. Weak precursor seismic activity can be detected in many cases and used to better describe the fault structure and associated seismic hazard for better informed mitigation strategies. Here a workflow is defined for ranking different mitigation options, comparing the relative seismic hazard of each. The output of the workflow is a quantitative mitigation strategy for subsequent operations.


Join the Conversation
Interested in starting, or contributing to a conversation about an article or issue of the RECORDER? Join our CSEG LinkedIn Group.
Share This Article