In the winter of 2012, representatives of Aboriginal Affairs and Northern Development Canada and the National Energy Board visited three Sahtu communities in the Northwest Territories (NWT) of Canada to provide information about hydraulic fracturing. At the time, those communities expressed concerns about the environmental impact this technology would have on the region around Norman Wells. Community members asked specifically whether hydraulic fracturing could cause earthquakes, noting that recent reports from Oklahoma and Ohio associate hydraulic fracturing and injection of fluids into wells with increased numbers of small (M<4) seismic events (Keranen et al., 2013; Kim, 2013). Several studies reported magnitude 2.3–2.9 earthquakes associated directly with hydraulic fracturing. These earthquakes are large enough to be felt but too small to cause structural damage (Ellsworth, 2013). Discussion at those meetings indicated the need to gather baseline data which might help to address some of those concerns.
Seismic monitoring is done to detect earthquakes and other movements within the Earth’s crust. Tectonic movements stress nearby parts of the crust and this stress is relieved through movements on faults or fracturing. If large enough, these movements can be felt as earthquakes. In general, earthquakes will only be felt if they are magnitude 3 or greater. Damage only occurs at magnitudes greater than 6. Most events in this region are too small to be felt by humans, but can be detected by arrays of much more sensitive seismic sensors (seismometers) which collectively monitor the seismic event frequency of occurrence and magnitudes.
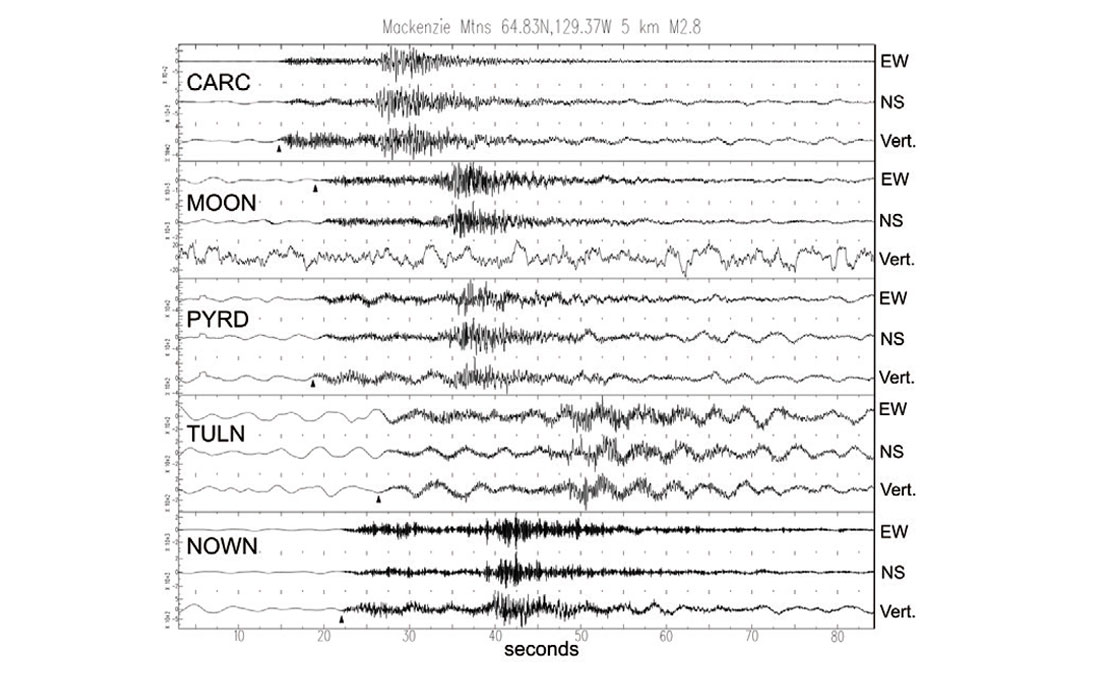
The Mackenzie Mountains to the west of the study area have long been known to be active seismically with numerous magnitude 2–4 earthquakes recorded (Mazzotti & Hyndman, 2002). These earthquakes help to calibrate the Norman Wells network by demonstrating that all stations are recording clear events with comparable amplitudes and correct relative timing (Figure 1). Based on other recent studies (for example, Keranen et al., 2013), the magnitude of any induced seismic events is expected to be orders of magnitude smaller and located within the uppermost few kilometers of the Earth’s crust. In the Norman Wells area, this is known to comprise sedimentary rocks of Paleozoic age (MacLean, 2011; Hadlari et al., 2014).
In 2011 and 2012, five companies purchased exploration rights to 14 different contiguous license blocks in the Central Mackenzie Valley area with collective work commitments of over $600 Million. The interest was due to the tight oil potential of the Devonian Canol Shale. To date, seven wells have been drilled to test this potential (Figure 2).
MGM Energy and Husky Oil have each hydraulically fractured rock using vertical test wells on their leases: MGM with one well and Husky with two. In 2013 Conoco Phillips Canada drilled two vertical wells and in 2014, drilled, tested, and completed two wells with multi-stage horizontal fracturing to test the potential on their EL470 lease. The drilling and completion occurred in February and March, 2014.
Field Installations
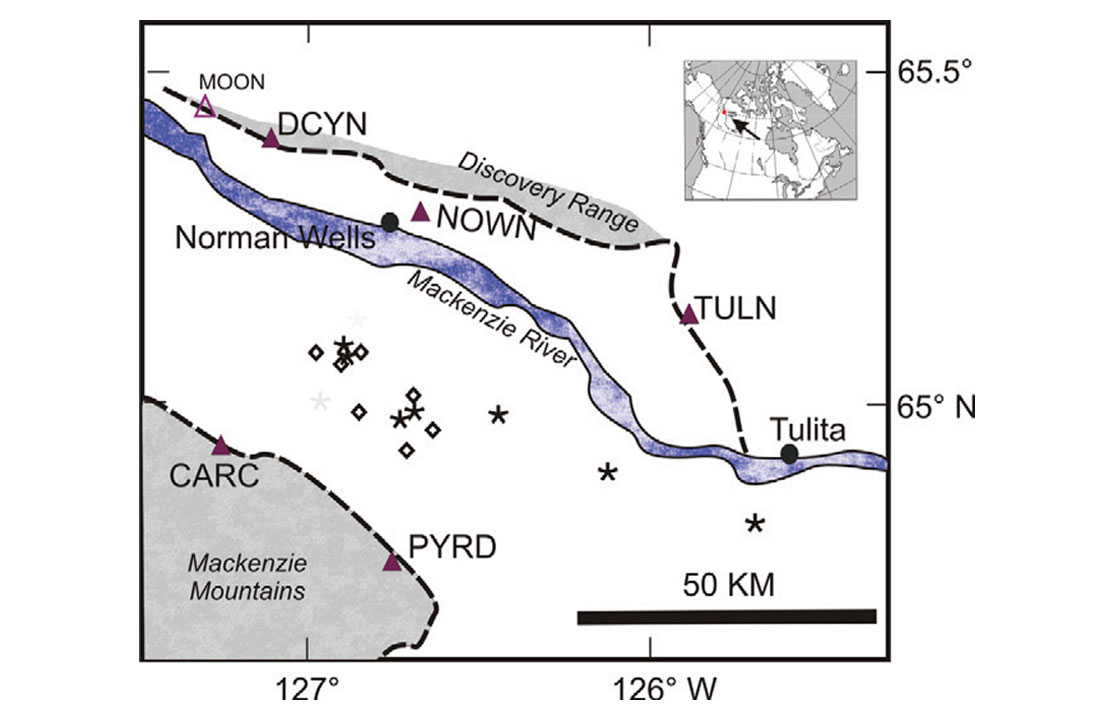
The NWT Geoscience Office received funding to install seismic monitoring stations on both sides of the Central Mackenzie Valley near Norman Wells to supplement one existing seismic station located on exposed bedrock in the quarry belonging to the hamlet of Norman Wells (NOWN on Figure 2). In September 2013, four new seismic stations were sited on bedrock exposed in low foothills. This provided good coupling of the sensor to the basement rocks and line of sight to Norman Wells for future radio transmission of the data. Placing the sensors on loose soils or gravels degrades the recording of higher frequency parts of the travelling waves and makes timing of arrivals and thus distance estimates less precise. The stations are located 24–52 kms from the Norman Wells airport and 24–53 kms from recently active wells (Figure 2). The station distribution provides good triangulation angles for locating the hypocentres of seismic events within the array.
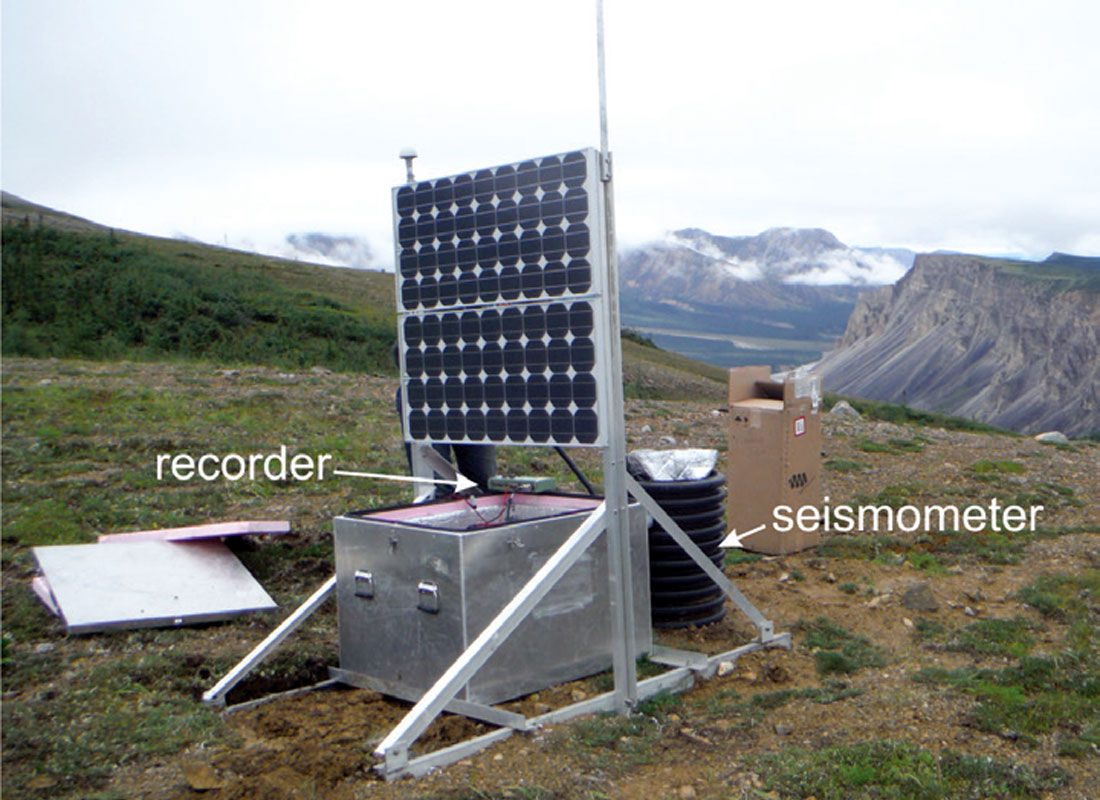
These seismic monitoring stations are small installations with < 2 m2 footprints and consist of a power source, GPS antennae, recorder and seismometer in a protective vault (Figure 3). The sensor and recorder passively monitor seismic waves passing through the bedrock. The Nanometrics Taurus recorder stores the data from three seismic channels as well as state-of-health information onto a memory chip at either 40 or 100 samples per second. Guralp 40T seismometers sense seismic waves with periods of 0.12 to 30 seconds (0.033–50 Hz). Guralp 3ESP sensors have broader bandwidth at 0.12 to 100 seconds (0.010–50 Hz). Nanometrics Trillium120PH seismometers have extended bandwidths of 0.12 to 120 seconds (0.005–50 Hz). These 450 lb installations are transported into the field by helicopter and require periodic maintenance.
The 2013 seismic network consisted of three Guralp 40T seismometers installed at stations CRCN, TULN, PYRN and two Guralp 3ESP sensors at MOON and NOWN although the vertical component at MOON never functioned properly (Table 1). In August 2014 changes were made to the array. Two sensors (PYRN and CRCN) were upgraded with Nanometrics Trillium120PH seismometers. At the same time MOON was relocated closer to Norman Wells to station DCYN, a seismically superior site. The August service run also allowed all stations to be equipped with more robust power supplies and all sites were upgraded to six, 100-amp-hour deep cycle batteries. It is hoped the battery upgrade will minimize station downtime in the winter months, when the solar panel output is insufficient to run the installations.
| Station name | Latitude Deg N |
Longitude Deg W |
Altitude m | Sensor | Days recorded |
|---|---|---|---|---|---|
| Table 1. Norman Wells Array station locations | |||||
| NOWN | 65.294 | 126.715 | 186 | 3ESP | 15Aug12 onwards (telemetered) |
| TULN | 65.1147 | 125.855 | 639 | 40T | 18Sep13-17Jan14; -20Mar |
| PYDN | 64.8212 | 126.907 | 655 | 40T>T120PH | 13Sep-19Oct13 |
| CRCN | 64.997 | 127.436 | 621 | 40T>T120PH | 11Sep13-20Jan14 |
| MOON | 65.4729 | 127.412 | 392 | 3ESP | No vertical |
| DCYN | 65.4195 | 127.178 | 40T | 7Aug14 onwards | |
Further upgrades are planned for November 2014 when FreeWave UFH radios will be installed to radio link the four seismic stations to a base station in Norman Wells. From the Norman Wells base station the signals from these machines will be uploaded via the internet to data repository centers in both Sydney, BC and Ottawa, ON.
Event detection
To date, seismic events during the first two months of recording by the Norman Wells array have been analyzed and located. Using three or four stations of the array, 101 earthquakes were located and assigned magnitudes ranging from 1.7 to 4.6 (Table 2). In comparison, during this same period, the Canadian National Seismic Network (CNSN) located 13 earthquakes within this same region, within a 400 km radius of Norman Wells. The national network was able to detect events within a minimum magnitude threshold of about 2.4, but the new stations are now estimated to reduce that threshold by at least one order of magnitude for local events.
| Date | Time | Lat.N | Long.E | Depth (Km) | Magnitude |
|---|---|---|---|---|---|
| Table 2. Earthquakes located using the Norman Wells array | |||||
| 2013-09-14 | 15:47:46 | 62.234 | -127.885 | 10 | 3.5ML |
| 2013-09-15 | 12:29:55 | 62.834 | -126.936 | 37.8 | 3.6ML |
| 2013-09-17 | 4:19:57 | 63.496 | -122.528 | 10 | 3.3ML |
| 2013-09-18 | 16:58:45 | 60.544 | -122.043 | 10 | 3.4ML |
| 2013-09-17 | 0:34:26 | 62.951 | -125.999 | 5.5 | 3.0ML |
| 2013-09-20 | 1:08:32 | 62.883 | -126.404 | 5.9 | 2.7ML |
| 2013-09-21 | 7:04:54 | 62.998 | -126.887 | 10 | 3.3ML |
| 2013-09-21 | 8:44:20 | 62.688 | -127.127 | 10 | 2.8ML |
| 2013-09-21 | 12:21:58 | 57.823 | -119.852 | 17.6 | 3.0ML |
| 2013-09-21 | 13:19:33 | 57.89 | -119.951 | 8.1 | 3.8ML |
| 2013-09-21 | 15:03:41 | 62.019 | -113.444 | 0.1 | 3.9ML |
| 2013-09-21 | 18:45:36 | 63.078 | -129.08 | 10 | 3.1ML |
| 2013-09-23 | 10:26:23 | 65.437 | -141.452 | 9 | 3.5ML |
| 2013-09-23 | 17:40:23 | 62.049 | -127.947 | 10 | 2.9ML |
| 2013-09-23 | 22:38:27 | 64.119 | -125.983 | 6 | 2.7ML |
| 2013-09-24 | 13:13:45 | 63.594 | -122.021 | 17.1 | 3.2ML |
| 2013-09-24 | 17:32:04 | 61.208 | -124.485 | 16 | 3.1ML |
| 2013-09-25 | 14:01:17 | 65.482 | -134.116 | 10 | 3.5ML |
| 2013-09-25 | 14:04:07 | 62.635 | -127.861 | 10 | 3.2ML |
| 2013-09-25 | 16:54:06 | 57.27 | -117.775 | 15.6 | 3.9ML |
| 2013-09-25 | 20:09:07 | 64.394 | -124.767 | 7.4 | 3.1ML |
| 2013-09-27 | 8:15:20 | 62.477 | -126.187 | 16.1 | 2.6ML |
| 2013-09-28 | 7:46:15 | 63.638 | -122.484 | 7.5 | 3.8ML |
| 2013-09-28 | 11:25:40 | 61.871 | -127.011 | 5.1 | 3.0ML |
| 2013-09-28 | 21:47:05 | 62.567 | -127.89 | 8 | 4.0ML |
| 2013-09-28 | 21:52:14 | 62.461 | -128.105 | 10 | 3.4ML |
| 2013-09-29 | 13:37:58 | 64.927 | -130.719 | 10 | 3.6ML |
| 2013-09-30 | 8:23:57 | 63.495 | -118.461 | 10 | 3.3ML |
| 2013-09-30 | 19:39:02 | 62.638 | -127.848 | 7.8 | 3.5ML |
| 2013-10-01 | 3:44:28 | 63.29 | -126.842 | 17.5 | 3.6ML |
| 2013-10-01 | 9:02:03 | 62.654 | -127.862 | 10 | 3.1ML |
| 2013-10-01 | 13:31:28 | 64.947 | -129.959 | 9.3 | 3.1ML |
| 2013-10-01 | 19:48:20 | 64.453 | -116.731 | 6.2 | 3.5ML |
| 2013-10-02 | 2:43:55 | 62.601 | -127.852 | 10 | 3.1ML |
| 2013-10-02 | 21:18:34 | 63.74 | -119.766 | 17.7 | 3.0ML |
| 2013-10-03 | 6:24:23 | 65.856 | -120.843 | 10 | 3.7ML |
| 2013-10-03 | 17:52:49 | 62.816 | -127.323 | 0.8 | 3.4ML |
| 2013-10-06 | 1:47:16 | 64.143 | -120.008 | 14.5 | 3.8ML |
| 2013-10-06 | 13:44:21 | 64.747 | -129.04 | 14.4 | 3.5ML |
| 2013-10-06 | 14:35:37 | 64.757 | -114.298 | 19.6 | 3.3ML |
| 2013-10-06 | 15:18:36 | 60.373 | -119.392 | 14.1 | 2.7ML |
| 2013-10-06 | 16:49:19 | 62.472 | -125.112 | 3.1 | 3.7ML |
| 2013-10-08 | 10:11:12 | 64.811 | -127.072 | 6.2 | 1.7ML |
| 2013-10-09 | 20:28:32 | 67.085 | -125.808 | 16.1 | 3.4ML |
| 2013-10-11 | 20:27:43 | 61.69 | -126.958 | 18.2 | 3.2ML |
| 2013-10-11 | 23:09:33 | 66.381 | -114.159 | 10 | 3.5ML |
| 2013-10-12 | 2:21:04 | 64.874 | -125.26 | 16.8 | 3.5ML |
| 2013-10-12 | 6:26:55 | 64.83 | -129.37 | 5 | 2.8ML |
| 2013-10-12 | 13:23:20 | 65.63 | -125.859 | 13.2 | 3.5ML |
| 2013-10-13 | 8:26:18 | 65.047 | -138.096 | 10 | 4.6ML |
| 2013-10-15 | 0:24:49 | 62.878 | -125.233 | 16.1 | 3.8ML |
| 2013-10-15 | 8:54:46 | 61.297 | -127.103 | 14.4 | 3.6ML |
| 2013-10-16 | 10:42:44 | 60.243 | -127.243 | 2.2 | 3.5ML |
| 2013-10-18 | 13:30:25 | 63.477 | -122.536 | 16.6 | 3.0ML |
| 2013-10-19 | 18:00:44 | 57.881 | -120.774 | 10 | 3.4ML |
| 2013-10-20 | 8:17:52 | 62.72 | -124.588 | 4.2 | 3.2ML |
| 2013-10-21 | 2:38:29 | 63.548 | -122.731 | 4 | 2.9ML |
| 2013-10-22 | 14:55:02 | 60.65 | -137.758 | 7.1 | 3.7ML |
| 2013-10-22 | 21:27:47 | 60.92 | -126.35 | 13.7 | 3.6ML |
| 2013-10-23 | 8:35:09 | 59.292 | -127.586 | 10 | 2.9ML |
| 2013-10-24 | 1:44:18 | 62.517 | -127.511 | 16 | 3.4ML |
| 2013-10-25 | 17:19:28 | 63.4 | -125.714 | 11 | 3.7ML |
| 2013-10-25 | 21:36:36 | 62.803 | -126.221 | 4.4 | 2.9ML |
| 2013-10-27 | 13:38:40 | 62.87 | -125.295 | 17.8 | 3.6ML |
| 2013-10-27 | 18:22:06 | 62.846 | -126.111 | 10 | 3.2ML |
| 2013-10-27 | 20:01:16 | 64.678 | -132.956 | 6 | 2.9ML |
| 2013-10-28 | 9:49:10 | 68.01 | -136.293 | 8 | 2.7ML |
| 2013-10-28 | 15:00:32 | 63.684 | -120.911 | 12.1 | 3.1ML |
| 2013-10-30 | 19:14:16 | 64.736 | -130.876 | 10 | 2.9ML |
| 2013-10-31 | 3:12:52 | 63.085 | -126.868 | 6.2 | 2.6ML |
| 2013-10-31 | 12:13:46 | 65.118 | -127.882 | 10.9 | 3.0ML |
| 2013-10-31 | 15:10:05 | 62.877 | -125.914 | 6 | 2.8ML |
| 2013-11-01 | 15:27:00 | 65.227 | -124.556 | 6.5 | 2.2ML |
| 2013-11-01 | 16:38:14 | 62.882 | -126.334 | 5.8 | 2.9ML |
| 2013-11-02 | 5:10:14 | 63.093 | -124.032 | 7.6 | 3.3ML |
| 2013-11-02 | 13:15:06 | 61.906 | -124.812 | 10 | 3.4ML |
| 2013-11-02 | 16:04:06 | 58.647 | -124.575 | 6.7 | 2.9ML |
| 2013-11-02 | 19:05:38 | 60.136 | -125.456 | 14.6 | 3.2ML |
| 2013-11-02 | 22:36:44 | 64.663 | -127.932 | 8.5 | 2.8ML |
| 2013-11-03 | 2:55:26 | 65.042 | -127.657 | 2.4 | 3.2ML |
| 2013-11-03 | 4:47:50 | 64.925 | -130.743 | 17.5 | 3.1ML |
| 2013-11-03 | 5:35:03 | 64.954 | -126.833 | 10 | 2.5ML |
| 2013-11-03 | 9:02:22 | 64.551 | -126.779 | 11.8 | 2.2ML |
| 2013-11-03 | 10:20:43 | 60.185 | -125.504 | 4.9 | 2.7ML |
| 2013-11-03 | 11:15:04 | 61.832 | -126.016 | 10 | 3.1ML |
| 2013-11-03 | 14:56:11 | 63.817 | -128.146 | 8.5 | 2.9ML |
| 2013-11-03 | 18:05:44 | 63.803 | -125.931 | 6.3 | 2.8ML |
| 2013-11-05 | 17:29:39 | 62.374 | -129.775 | 14 | 3.4ML |
| 2013-11-05 | 17:58:32 | 61.743 | -124.61 | 9.3 | 2.7ML |
| 2013-11-07 | 5:15:01 | 62.978 | -130.674 | 5 | 2.8ML |
| 2013-11-09 | 22:47:25 | 64.735 | -127.522 | 14.3 | 2.9ML |
| 2013-11-10 | 3:40:14 | 62.211 | -127.818 | 10.3 | 2.7ML |
| 2013-11-10 | 5:26:14 | 63.834 | -122.148 | 10 | 2.6ML |
| 2013-11-11 | 5:06:04 | 62.974 | -124.834 | 4.1 | 2.6ML |
| 2013-11-12 | 7:10:04 | 63.052 | -127.198 | 10 | 3.9ML |
| 2013-11-12 | 11:44:35 | 63.074 | -125.573 | 10 | 2.9ML |
| 2013-11-13 | 4:02:37 | 61.478 | -131.111 | 10 | 3.7ML |
| 2013-11-13 | 4:58:32 | 64.622 | -126.064 | 10 | 1.8ML |
| 2013-11-13 | 6:27:15 | 66.545 | -141.745 | 9 | 3.8ML |
| 2013-11-14 | 2:43:15 | 65.377 | -134.267 | 8.4 | 3.2ML |
| 2013-11-14 | 11:36:34 | 64.997 | -125.2 | 6.1 | 2.4M |
Only one seismic event (November 3, 2013) lies within the Central Mackenzie Valley (Figure 4). Most of the recently detected earthquakes are located beneath the mountain fronts of the Mackenzie and Discovery Ranges at depths from 2 to 16 kms (Table 2). These results are consistent with the many events located since 2000 beneath the Mackenzie Mountains by the national seismic network (Figure 4). Among earthquakes detected independently by the local and national networks, most parameters were nearly identical with the exception of depth. The local Norman Wells network provides location precision of several kilometers for earthquakes within the array, and assigned depths were generally deeper than those previously assigned. The majority of earthquake depths in the CNSN catalog are followed by “g”, meaning that they are set by an analyst due to insufficient depth resolution. Therefore the local array provides a more realistic assessment of depth distribution.
These early results establish that background seismicity in the Norman Wells area can be detected down to at least magnitude 1.7 and that about seven earthquakes a month can be expected to occur naturally within a 400-km radius. The local array detects all events reported by the national network, but also about nine times as many within 400 kms of Norman Wells. The known seismicity of the Mackenzie Mountains provides an excellent calibration for the new array. Drilling and completion activity within the array began about February, 2014 and was completed by the end of March. Analysis of the Norman Wells array data from that period is currently underway and the results will be made available once the analysis is finished.
Although installed specifically to monitor induced seismic activity, the network could aid in the understanding of the tectonic stress regime in the Central Mackenzie Valley. It might also facilitate the identification of tectonically active basement structures beneath this region. Such features would constitute a potential hazard for future hydraulic fracturing fluid injection and the disposal of waste fluids by downhole injection. Establishing this close-spaced seismic network prior to fracturing activities in the area has also enabled the collection of baseline data pre-, syn- and post-development in the area, in the event the Canol tight oil play development proceeds.
| Date | Time | Latitude | Longitude | Depth(KM) | Magnitude |
|---|---|---|---|---|---|
| Table 3. Earthquakes located by the Canadian National Seismic Network | |||||
| 2013-09-25 | 14:01:17 | 65.482 | -134.121 | 1 | 3.5ML |
| 2013-09-28 | 8:15:23 | 63.224 | -131.471 | 30 | 3.3ML |
| 2013-09-28 | 21:47:05 | 62.572 | -127.894 | 1 | 4.0ML |
| 2013-09-28 | 21:52:13 | 62.453 | -128.101 | 1 | 3.4ML |
| 2013-09-30 | 19:39:02 | 62.638 | -127.848 | 1 | 3.5ML |
| 2013-10-01 | 9:02:03 | 62.646 | -127.87 | 1 | 3.1ML |
| 2013-10-02 | 2:43:55 | 62.604 | -127.864 | 1 | 3.1ML |
| 2013-10-09 | 20:28:32 | 66.9 | -125.729 | 1 | 3.2ML |
| 2013-10-12 | 6:26:56 | 64.952 | -129.361 | 5 | 2.9ML |
| 2013-10-27 | 20:01:16 | 64.685 | -132.963 | 1 | 2.9ML |
| 2013-11-02 | 13:15:06 | 61.587 | -124.664 | 15 | 3.1ML |
| 2013-11-08 | 9:51:56 | 64.789 | -133.741 | 1 | 3.2ML |
| 2013-11-14 | 2:43:15 | 65.377 | -134.267 | 1 | 3.1ML |
| 2013-11-25 | 9:34:48 | 62.62 | -127.862 | 1 | 3.7ML |
| 2013-12-07 | 2:48:27 | 64.219 | -130.983 | 1 | 2.9ML |
| 2013-12-27 | 7:58:56 | 65.195 | -134.118 | 0 | 3.6ML |
| 2014-01-21 | 5:46:12 | 62.106 | -123.867 | 10 | 2.9ML |
| 2014-02-01 | 7:20:26 | 65.425 | -134.15 | 30 | 2.8ML |
| 2014-02-07 | 14:56:18 | 65.261 | -133.594 | 1 | 3.2ML |
| 2014-03-03 | 17:51:03 | 63.561 | -132.544 | 1 | 2.7ML |
| 2014-03-04 | 6:18:28 | 63.168 | -132.242 | 1 | 2.6ML |
| 2014-03-06 | 6:40:02 | 64.419 | -134.929 | 1 | 3.6ML |
| 2014-03-08 | 2:16:56 | 65.359 | -134.483 | 1 | 2.8ML |
| 2014-03-17 | 0:20:10 | 65.645 | -134.586 | 1 | 3.1ML |
| 2014-03-18 | 22:53:26 | 64.315 | -134.819 | 1 | 2.8ML |
| 2014-03-28 | 23:11:03 | 66.164 | -135.185 | 20 | 2.6ML |
| 2014-03-29 | 1:25:51 | 63.151 | -125.018 | 1 | 3.1ML |
| 2014-03-30 | 13:07:25 | 64.419 | -135.022 | 1 | 2.5ML |
| 2014-03-30 | 23:59:15 | 65.001 | -134.16 | 1 | 2.9ML |
| 2014-03-31 | 16:30:27 | 62.288 | -124.522 | 1 | 4.3Mw |
| 2014-04-05 | 5:57:45 | 65.296 | -134.5 | 5 | 3.5ML |
| 2014-04-06 | 4:27:42 | 62.248 | -124.461 | 1 | 3.0ML |
| 2014-04-13 | 13:48:57 | 66.11 | -135.145 | 20 | 3.4ML |
| 2014-04-13 | 18:20:10 | 66.637 | -130.337 | 10 | 2.8ML |
| 2014-04-13 | 18:30:24 | 66.665 | -130.382 | 1 | 2.9ML |
| 2014-04-22 | 13:34:38 | 64.972 | -134.159 | 1 | 2.8ML |
| 2014-04-22 | 13:43:42 | 65.315 | -134.693 | 1 | 2.8ML |
| 2014-05-16 | 1:56:29 | 65.251 | -133.166 | 1 | 2.6ML |
| 2014-05-18 | 19:53:28 | 65.285 | -133.238 | 1 | 3.8ML |
| 2014-06-01 | 11:02:02 | 64.544 | -126.806 | 10 | 3.2ML |
| 2014-06-09 | 12:27:54 | 65.275 | -133.567 | 1 | 3.4ML |
| 2014-06-11 | 0:42:49 | 62.075 | -124.08 | 1 | 2.9ML |
| 2014-06-11 | 6:19:44 | 65.947 | -119.642 | 30 | 2.8ML |
| 2014-06-12 | 8:04:44 | 66.079 | -135.223 | 20 | 2.6ML |
| 2014-06-26 | 20:23:39 | 65.298 | -133.555 | 1 | 3.2ML |
| 2014-07-09 | 19:42:45 | 62.184 | -124.057 | 10 | 3.1ML |
| 2014-07-13 | 16:48:07 | 66.368 | -134.987 | 15 | 2.4ML |
| 2014-07-16 | 0:20:07 | 62.621 | -127.964 | 1 | 4.3Mw |
| 2014-07-16 | 0:28:54 | 62.597 | -127.959 | 7 | 4.5Mw |
| 2014-07-16 | 5:18:34 | 62.592 | -127.983 | 1 | 3.1ML |
| 2014-07-16 | 19:26:59 | 65.12 | -134.401 | 1 | 2.8ML |
| 2014-07-17 | 6:13:25 | 62.57 | -127.969 | 1 | 2.8ML |
| 2014-07-20 | 14:42:22 | 62.649 | -128.449 | 20 | 2.9ML |
| 2014-07-21 | 6:43:50 | 62.654 | -128.128 | 1 | 2.8ML |
| 2014-07-22 | 19:19:25 | 61.922 | -123.558 | 5 | 3.8Mw |
| 2014-07-26 | 3:37:32 | 65.56 | -134.17 | 10 | 2.7ML |
| 2014-08-06 | 20:40:37 | 62.595 | -127.909 | 1 | 3.0ML |
| 2014-08-11 | 9:48:58 | 65.555 | -134.157 | 1 | 3.0ML |
| 2014-08-22 | 8:50:13 | 64.966 | -134.083 | 1 | 4.0ML |

Acknowledgements
Equipment purchases were funded by the Program of Energy Research and Development operated by Natural Resources Canada. This is contribution number 20140204 to the Natural Resources Canada Environmental Geoscience program. The manuscript benefitted from comments by K. Fiess, S. Crawford, and D. White.


Join the Conversation
Interested in starting, or contributing to a conversation about an article or issue of the RECORDER? Join our CSEG LinkedIn Group.
Share This Article