Introduction
Nine months ago, you finalized design for a new multicomponent seismic survey on your company’s key land asset. Seismic modeling of expected P and mode-converted PS seismic response for your reservoir zone convinced you of the potential value for this survey. While minor fluid and lithology changes translate into minor P seismic amplitude differences between good and poor producer locations, you have optimism that PS seismic data may provide a robust and reliable well placement tool.
Seismic acquisition proceeded pretty much to plan. Design called for a nominal 100-fold coverage to ensure good signal-to-noise quality of the recorded full-wave data. Your contractor used a node-based acquisition system that simplified logistics and provided flexibility to adjust to some surface permitting restrictions.
Seismic processing on the P data volume was completed last month, giving you a head start on interpreting the main geologic horizons. Today the corresponding PS seismic volume has arrived and you are ready to begin your first multi-component seismic interpretation project. What is your interpretation strategy? Are you going to attempt to interpret the same geologic markers as you have for the P seismic data? How are you going to ensure geologic equivalence between your interpretations? Will synthetics help? Should you condition one or both of your seismic data volumes? How are you ultimately going to extract interpretation value from your acquisition and processing investment?
Data QC and Crude Correlation
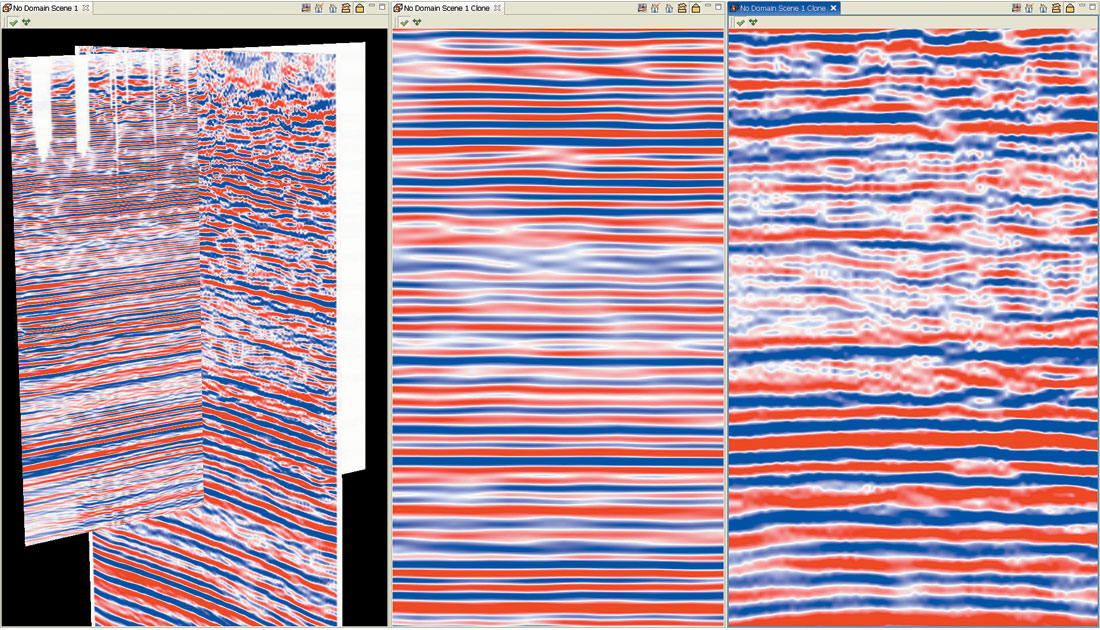
Perhaps armed with more questions than answers you start to explore your P and PS seismic data and look for clues of how to correlate two different measurements of your reservoir and surrounding geologic sequences. Figure 1 illustrates a typical relationship from southern Alberta, with PS seismic traveltimes being about double those of the P seismic data. Complementing the 3D view on the left is a crude correlation of the P data (center) and PS data (right), which highlights some of the challenges of matching multi-component seismic data. At this point of a project you will likely perform a similar “PowerPoint™ stretch-and-squeeze” to show yourself, and perhaps your manager, the quality of your data and potential for a good vertical match. At this initial stage you may be filled with variable optimism for the ultimate success of this project, depending upon both your data quality and geologic setting.
Unconventional Interpretation
As you reflect upon your ultimate interpretation objectives, you may consider a number of preconditioning strategies for your seismic data. If you intend to follow a traditional horizon interpretation approach, you will want to enhance the continuity in both your P and PS seismic datasets. However, if your goal is to accurately “register” the PS data to the P data time scale, you will begin to take a more unconventional interpretation approach.
Registration success is very dependent upon the quality of the multi-component seismic acquisition and processing, as well as unique geologic character that helps guide correlation. All this considered, what can we do at the interpretation stage to improve the registration process? Data preparation for traditional horizon and fault interpretation can involve applying processes for enhancing seismic continuity and discontinuity respectively, often to support automated picking algorithms. In contrast, our objective for registration preparation is to enhance the unique, geology-driven features that will guide our registration process.
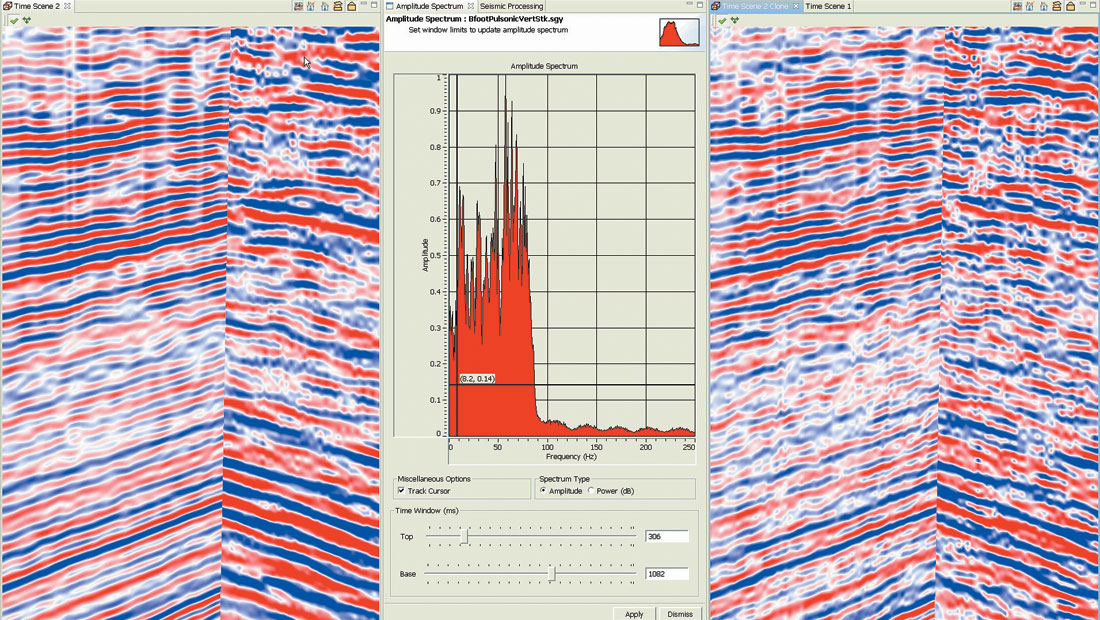
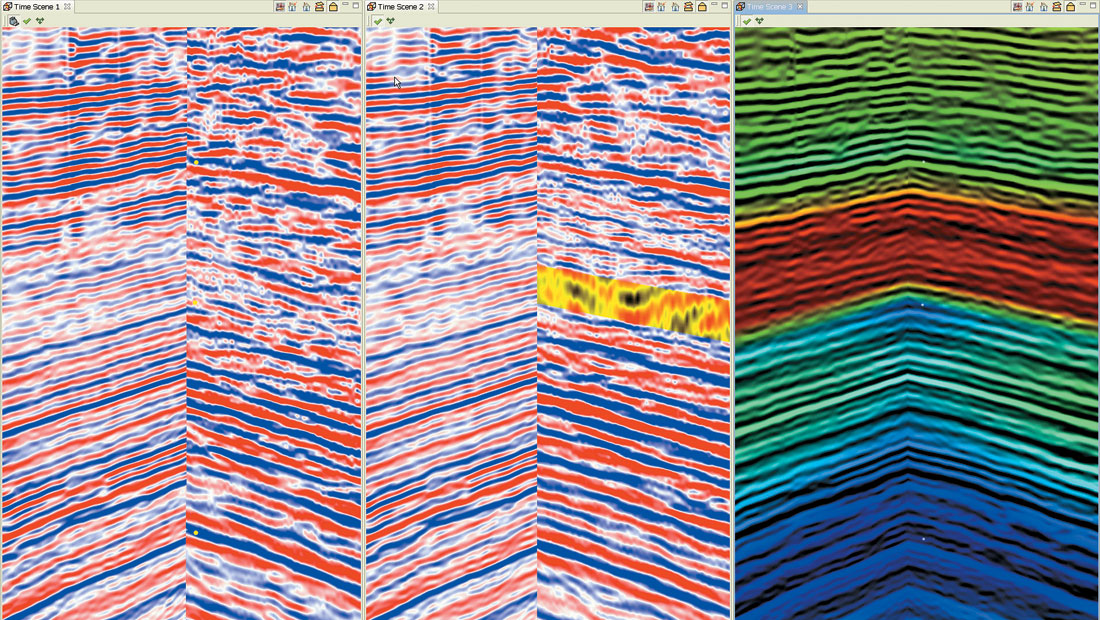
For example, boosting frequency content in both P and PS data can help amplify event character, even as reflection continuity is reduced. Figure 2 illustrates the use of spectral enhancement applied to original, intersecting P and PS data (left) to produce higher- resolution data (right) to aid the registration process for this Southern Alberta example. Seismic attributes can be very useful for registration in various scenarios including: amplitude envelope to highlight high and low energy zones; inversion to create a more distinctive log-like character and similarity to highlight structural and/or stratigraphic character.
The Challenge of Data Registration
Why is seismic registration a challenge? While the P and PS energy travel through the same subsurface, the character of the final processed results can be very different. This is not a complete surprise since our modeling indicated significant differences would occur within our reservoir zone. However, throughout the entire geologic sequence, P and PS seismic responses are going to differ to some degree with respect to reflection amplitude, phase and frequency. Hence, the very nature of our multicomponent seismic character seems to work against our objective to match temporal events.
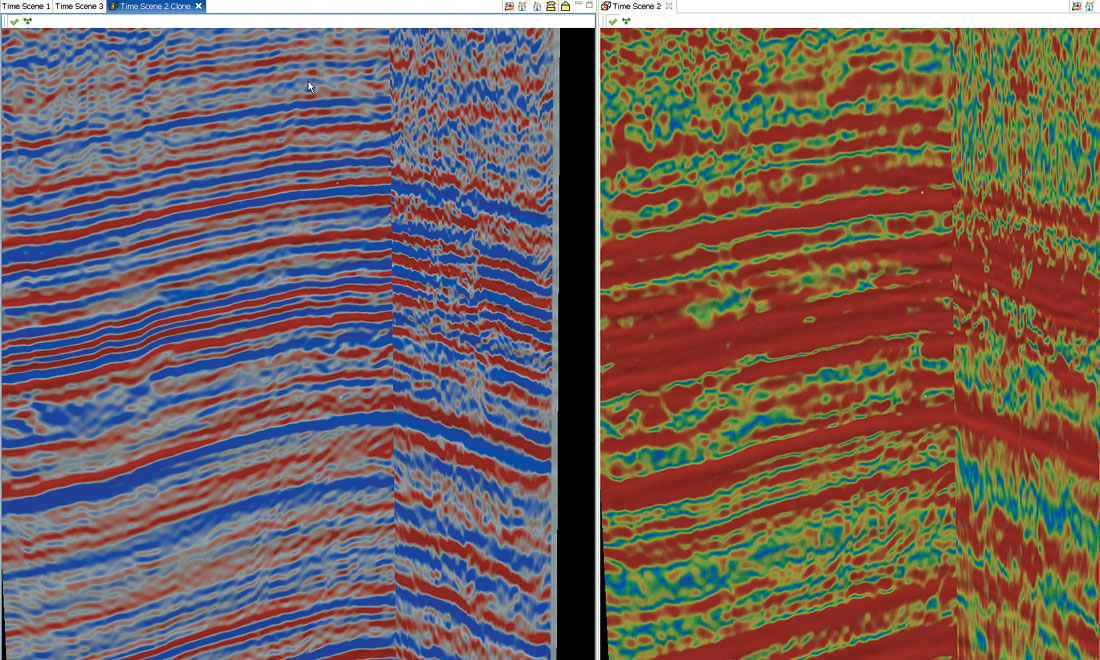
In reality what we find is that in a gross perspective our P and PS sections will respond in a similar way to strong reflectors like coals or carbonates as well as to thick sequences of sands or shales. If we can process or otherwise condition our seismic data to focus upon key seismic events and high and low-energy zones, we have a basis for registration. In Figure 3 we show the registration of P and PS data from Southern Alberta on the basis of high-energy fluvial zones of interbed coals and sands, in contrast to low energy shale sequences. The left panel in this figure shows registration of intersecting P and PS seismic slices, compared with registration using the amplitude envelope of the same slices in the right panel. Amplitude envelope is a useful seismic attribute for removing phase effects, reducing frequency effects and highlighting high and low energy zones.
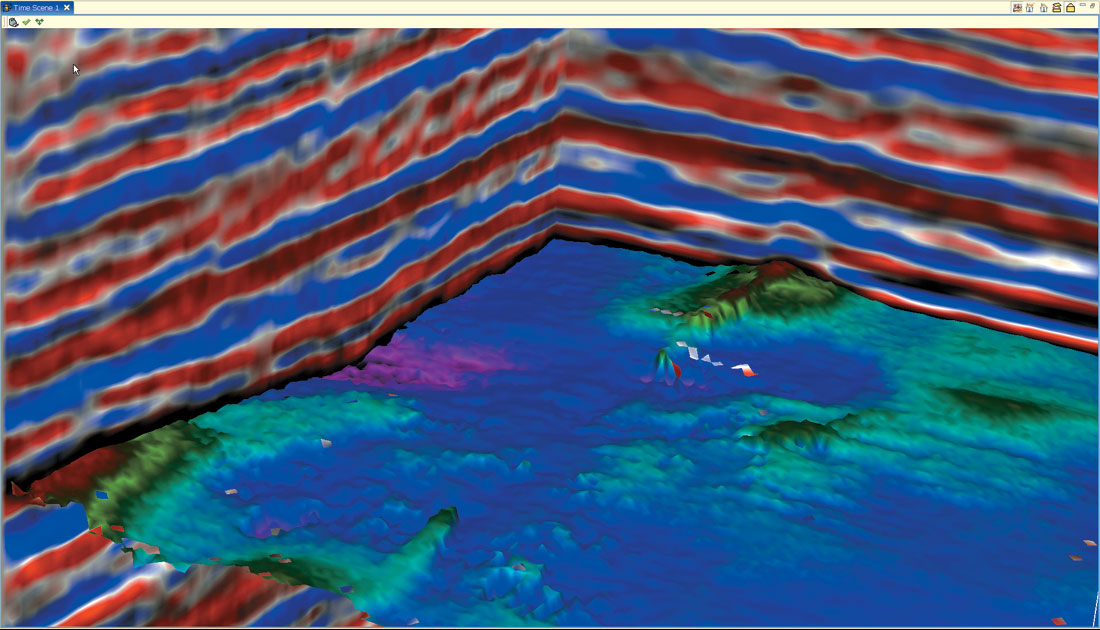
Matching reflection energy “packets” provides a base methodology for multicomponent registration, but often with a high degree of uncertainty. In homogenous geologic sequences or, equivalently, for highly scaled seismic data, it can be difficult to uniquely match seismic events. In these cases we need to identify alternative characteristics that can aid the registration process. Seismic stratigraphic features such as channels and unconformities can be very diagnostic of time equivalence. Figure 4 illustrates the use of sand channel stratigraphic relief to match PS seismic data (blue-red overlay) to P seismic data (grayscale background), in an example from East-Central Alberta.
An even more powerful technique for removing registration ambiguity is the use of non-vertical faults for correlation. Assuming both the P and PS seismic data have been well imaged in processing, the alignment of faults and event terminations can greatly simplify registration. Figure 5 shows the application of structure matching for a foothills survey in West-Central Alberta.
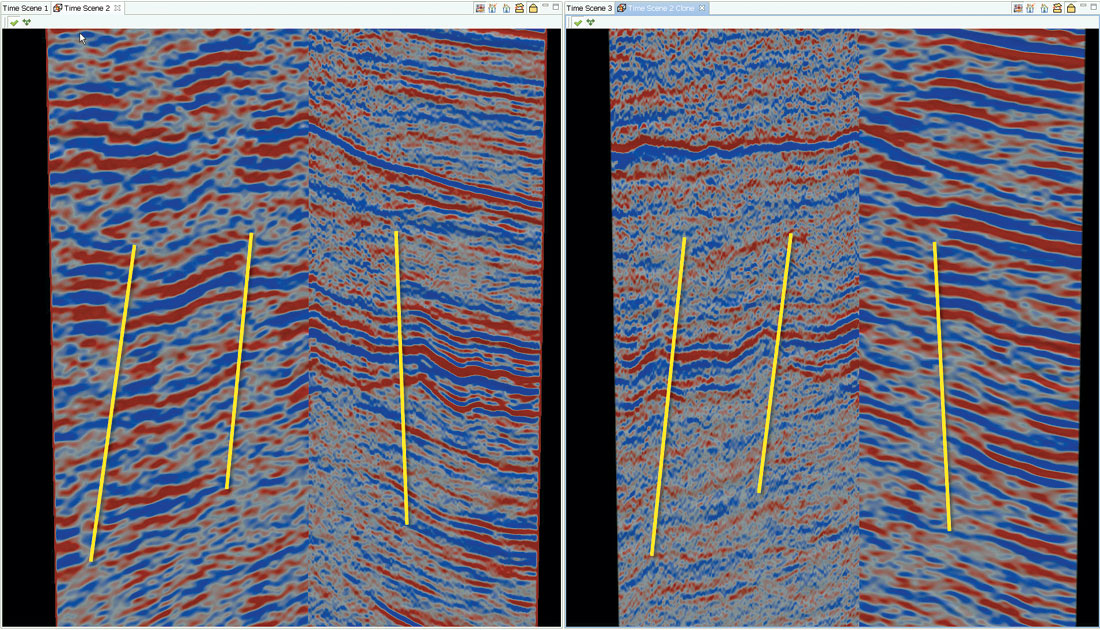
Registration workflow strategies must be adaptable to a wide range of data quality and geologic settings. Structural faulting, stratigraphic features and broad lithologic packages can all be useful registration tools across entire surveys. Diagnostic registration tools can help to guide a regional registration process, as demonstrated in Figure 6 for a project from Southern Alberta. Interactive registration picks made in the left panel are dynamically applied in the center panel, with yellow “hazard” warnings indicating anomalously large “stretching factors”. The corresponding 3D registration function, related to the P and S velocity ratio, is visualized in the right panel.
With seismic datasets having good event continuity, interpreted horizons on the P and PS data can be used as starting points or as a quality control tool. However, for calibrating registration ties at well locations, nothing beats the P and PS synthetics that we may have created during survey design. In addition to helping with event correlation, P and PS synthetics are very useful for matching phase and frequency character with multi-component seismic data.
Extracting Value from Multi-Component Seismic Data
After 9+ months, your investment in multi-component seismic design, acquisition, processing and registration is ready to deliver value. In preparation, you have likely converted your PS seismic volume to a regularly sample P-time-referenced volume. You may also have converted certain PS seismic attributes in a similar fashion, or you may have deferred attribute generation to be applied to the converted PS seismic data. In any event, at this stage you have at least two seismic volumes, and likely a number of data attribute volumes corresponding to the original P and PS seismic data.
One option you have is to load all the seismic and attribute volumes into your standard 3D interpretation workstation.
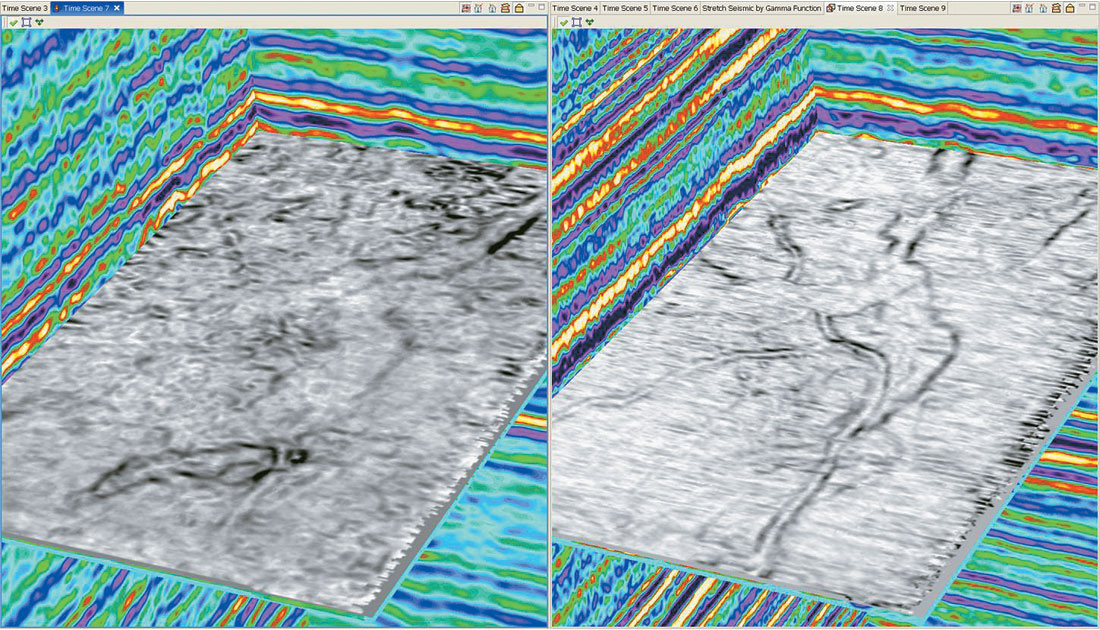
Using either panel (2D) or volume (3D) visualization, you can flip your display through different datasets and perform traditional surface interpretation and attribute extraction. Alternatively, you can choose a more innovative approach using “synchronized interpretation” to concurrently view and interpret P and PS seismic, and all their derivative attribute volumes. Figure 7 illustrates the use of synchronized interpretation for a project from East-Central Alberta to concurrently analyze channel morphology from the perspective of PS data (left) and PP data (right). Shaly, cross-cutting streams are highlighted by the PS seismic, primarily along a NE axis trend, while PP seismic highlights the sandier and more prospective, N-S trending main channels.
Time-to-depth conversion, seismic and well cross-plotting , stochastic inversion, geostatistical geologic modeling and other techniques can be used to extract further information from your multi-component seismic investment. As the use of multicomponent seismic moves closer to the mainstream, we will see the emergence of even more workflow methodologies and supporting technology innovations. Those that master this technology wave will ride to a greater understanding of reservoir lithology and fluid content, leading to better well placement and optimized reservoir management strategies.

Acknowledgements
I would like to express my extreme gratitude to Apache Corporation and the CREWES project for permission to publish the Alberta datasets in this paper. This work was made possible by the contribution of a number of individuals including: Ron Larson, Mike Bahorich and Dave Monk all from Apache, Rob Stewart and the CREWES project, Alex Calvert and the rest of the I/O-GXT organization, Susie Peebler of Touchstone Energy and the technology team of Dean Witte, Chris Grant, Jeff Emanuel and David Heath at Transform Software and Services.


Join the Conversation
Interested in starting, or contributing to a conversation about an article or issue of the RECORDER? Join our CSEG LinkedIn Group.
Share This Article