An ORION 3D DC/IP survey was conducted over the Denison Mines Phoenix Uranium Deposit at the Wheeler River Project in Northern Saskatchewan. The survey results provided 3D models that successfully delineated the known deposit at a depth of 400 m and provided an enhanced understanding of the three-dimensional geometry of the area NE of the deposit. In addition, significant differences in the characteristics of the rock units below and above the unconformity were accurately imaged.
Introduction and History
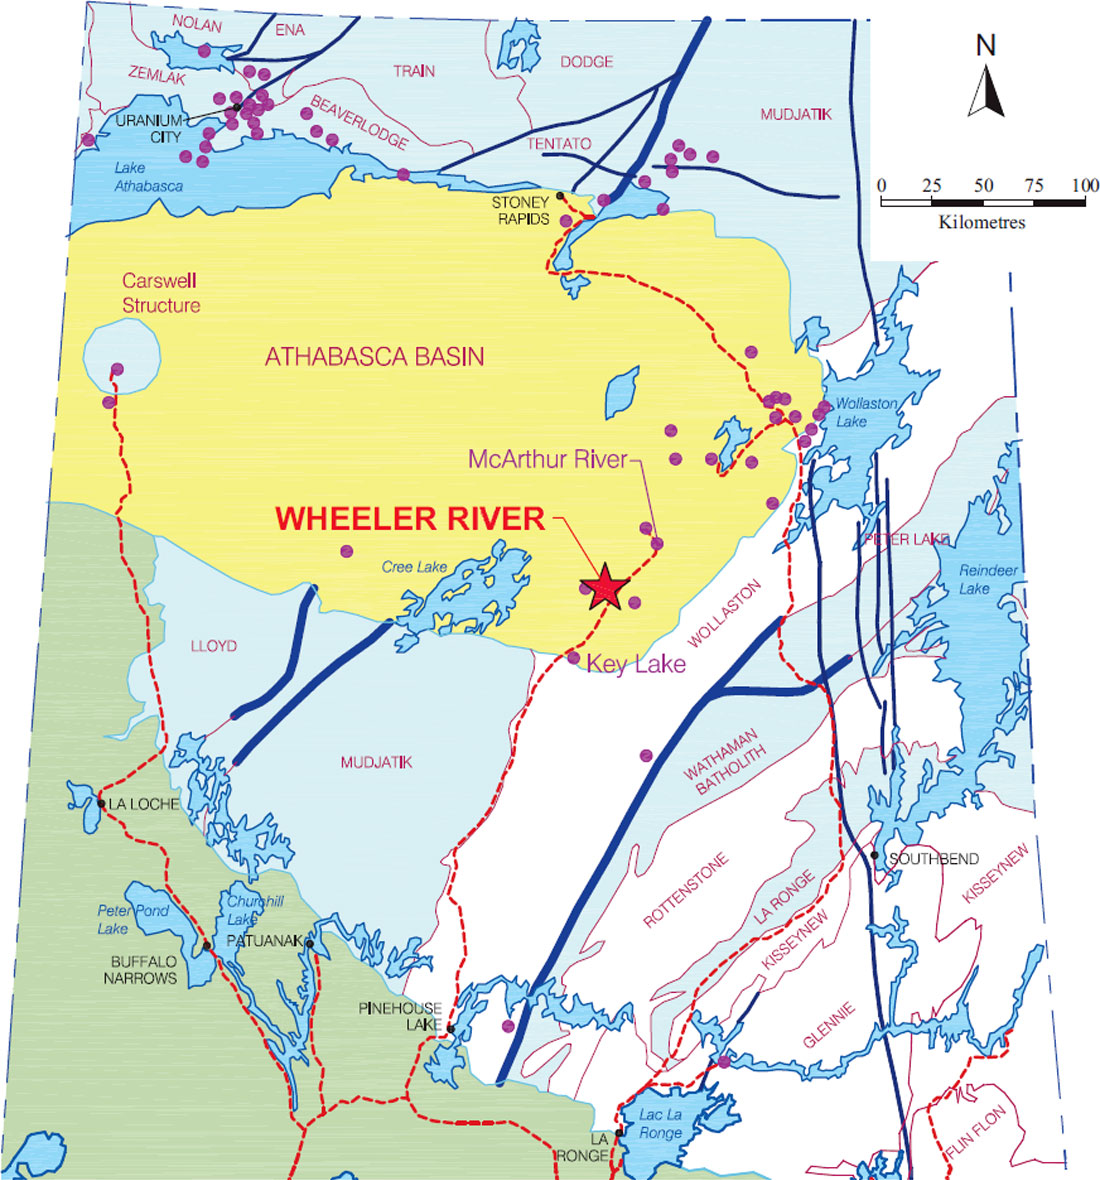
The Wheeler River Property, comprising the Phoenix and Gryphon uranium deposits, is located in the southeastern Athabasca Basin, approximately 600 km north of Saskatoon, in northern Saskatchewan (Figure 1).
Phoenix and ORION 3D
The Wheeler River Property lies in the southeastern part of the Athabasca Basin where undeformed, late Paleoproterozoic to Mesoproterozoic sandstones, conglomerates, and mudstones of the Athabasca Group unconformably overlie early Paleoproterozoic and Archean crystalline basement rocks. The Phoenix deposit was discovered in 2008 and contains a significant uranium mineral resource.
The Phoenix Deposit
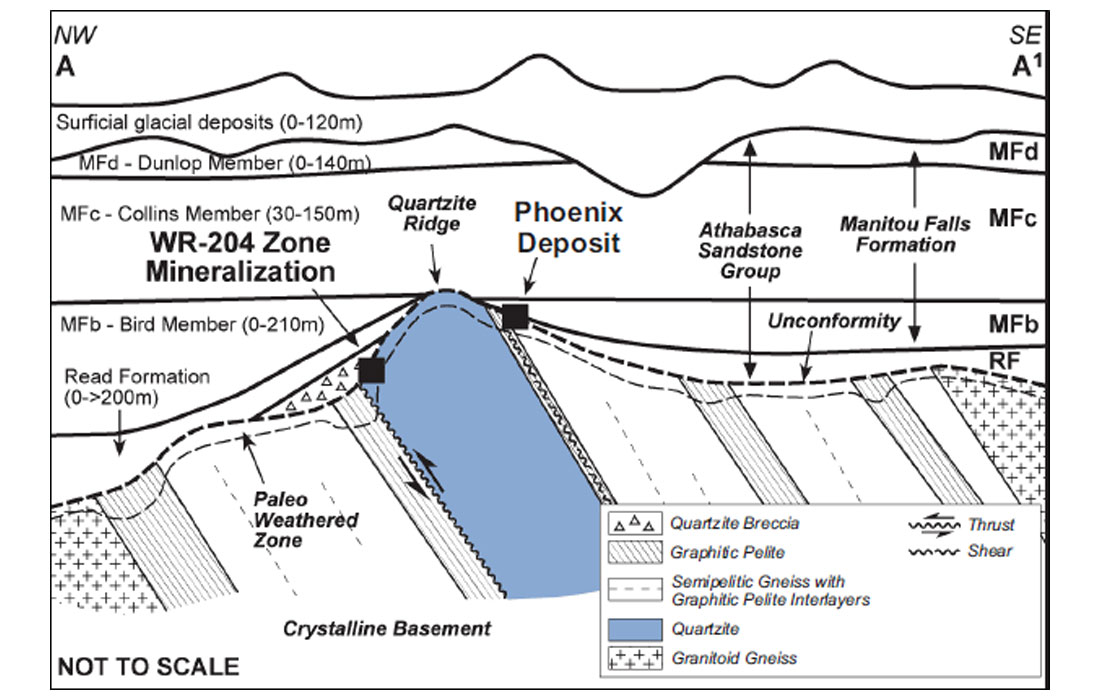
The local geology of the Property is consistent with the regional geology of the Athabasca Basin. The Phoenix deposit occurs at the unconformity between the Athabasca Basin and basement rocks, approximately 400 m below surface (Figure 2). The sandstones are altered 200 m above the unconformity. Alteration is focussed along structures propagating upward from the shear and does not exceed 100 m width across strike.
The ORION 3D Survey
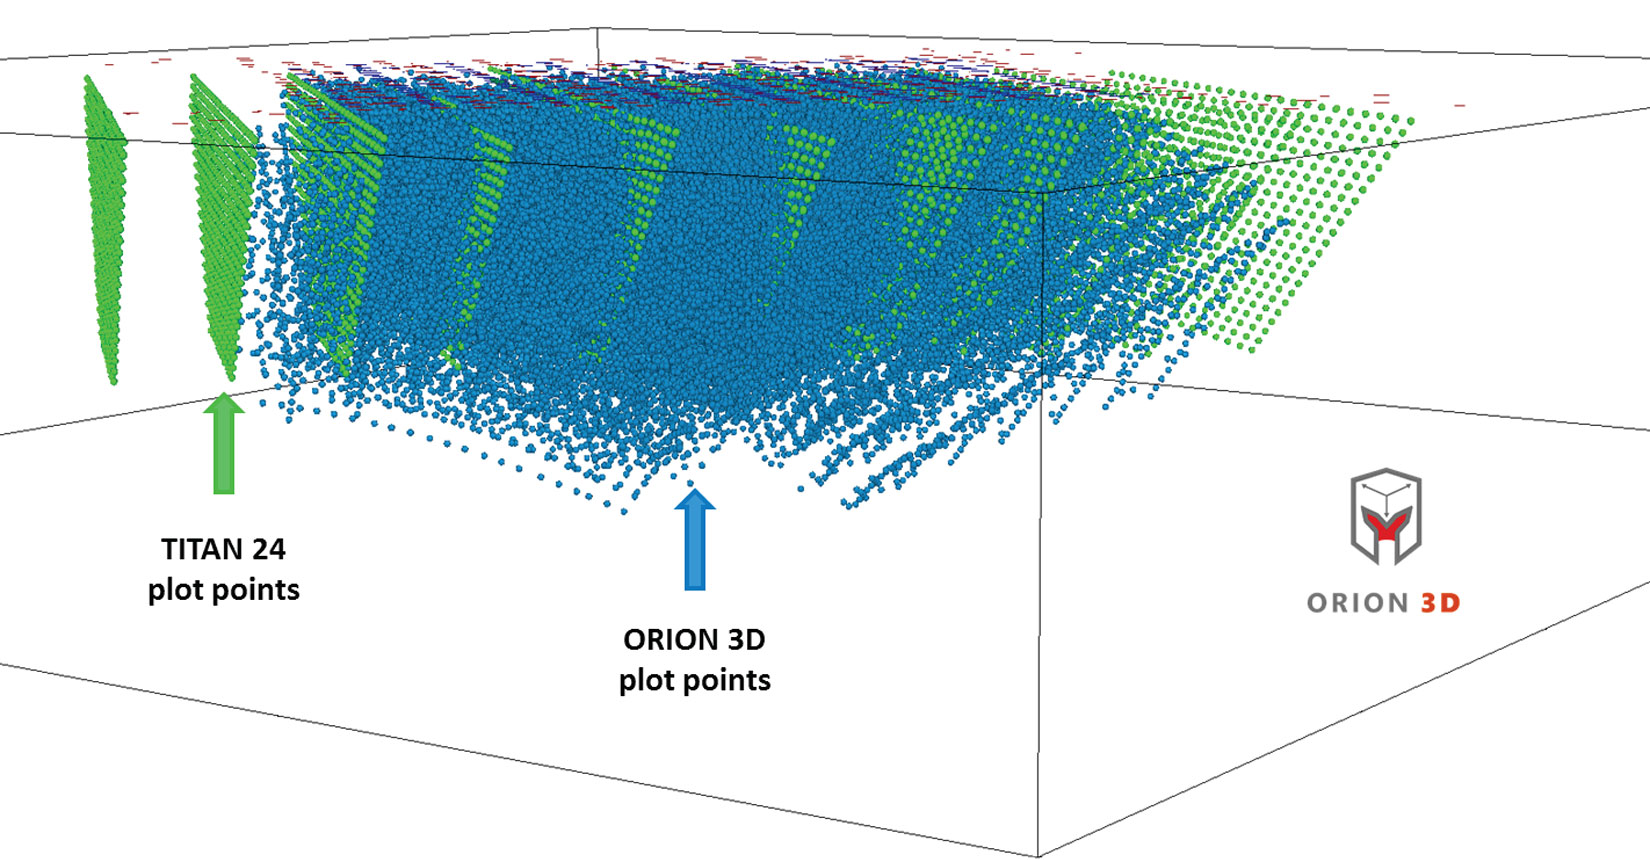
The ORION 3D method is an evolution into 3D acquisition based on the successful characteristics of the TITAN 24 system. This distributed multi-parameter data acquisition system penetrates deeper than conventional geophysics using a combination of DC Resistivity, IP, and MT. Typical depths of exploration are 700 – 1,500 m. The surveys are effective for exploration at long offsets, and in noisy or mine site environments due to a combination of performance features such as 100% duty cycle transmits, high data density from combined Pole- Dipole and Dipole-Pole, monitoring of the current using an acquisition channel, time-series data acquisition and digital signal processing resulting in approximately 2000 samples per half-cycle (4 seconds), 24-bit sigma-delta filtering, a high input impedance (80 Mohm) and a sophisticated calibration model (for AMT).
ORION 3D is an omnidirectional DCIP and MT system that collects resistivity and IP data simultaneously across an array of receiver dipoles. The ORION 3D paradigm prefers an equal distribution of in-line and cross-line dipoles. This survey design allows data to be collected without geometry (or strike) bias and is the fundamental innovation of the ORION 3D method. Conceptually, the 3D inversion method progressed as follows: First, 2D survey lines were provided to the 3D inversion engine. It was quickly realized that 3D inversion of these data provided little additional information versus 2D inversion. The reason is that there is little cross-line information content. Next, 2.5D surveys were conceived where transmits might be offset from the receiver array, or 3 or 5 parallel receiver arrays might be deployed while the transmits occur on the center line. This provides crossline information and enhances understanding of the deep part of the model, but shallow information may be compromised because the small n-spacings are null-coupled. This is particularly true if the transmits are never run on the receiver lines (i.e. the transmits are only run between the receiver lines). One method to overcome the cross-line null coupling of small n-spacings and preserve the shallow information is to run cross-line dipoles. These may be run on a few tie lines, or, in an ultimate sense, be deployed in equal numbers in both in-line and cross-line directions. ORION 3D was conceived in this ultimate sense. Figure 4 shows one of the six-channel autonomous loggers that are distributed during an ORION 3D survey. The six channels are configured with dipoles, three in each of the two orthogonal directions.
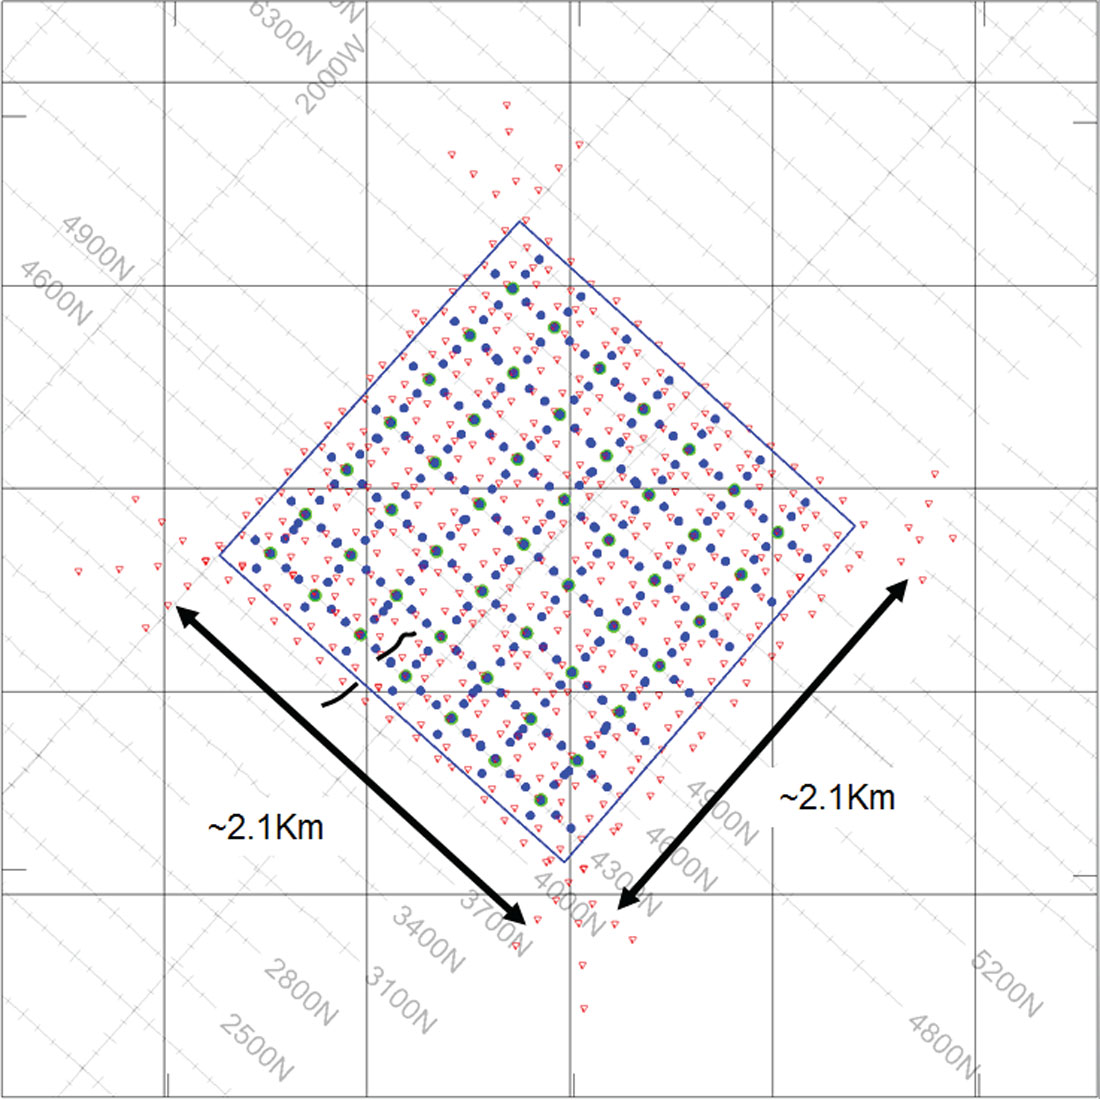
Data at Phoenix were collected using a layout (Figure 5) consisting of 294 @ 100 m sized receiver dipoles (Figure 4) and 297 current injections, resulting in over 140,000 data points to investigate a 2.1 km by 2.1 km area. Data were processed with Quantec’s proprietary software, and inverted using UBC 3D (Li and Oldenburg, 2000), Loke (Loke 2001) and ERTLab (Fischanger and LaBrecque, 2006) inversion codes. The resulting DC resistivity models provided information well below the unconformity at 400 m depth.
Survey Results
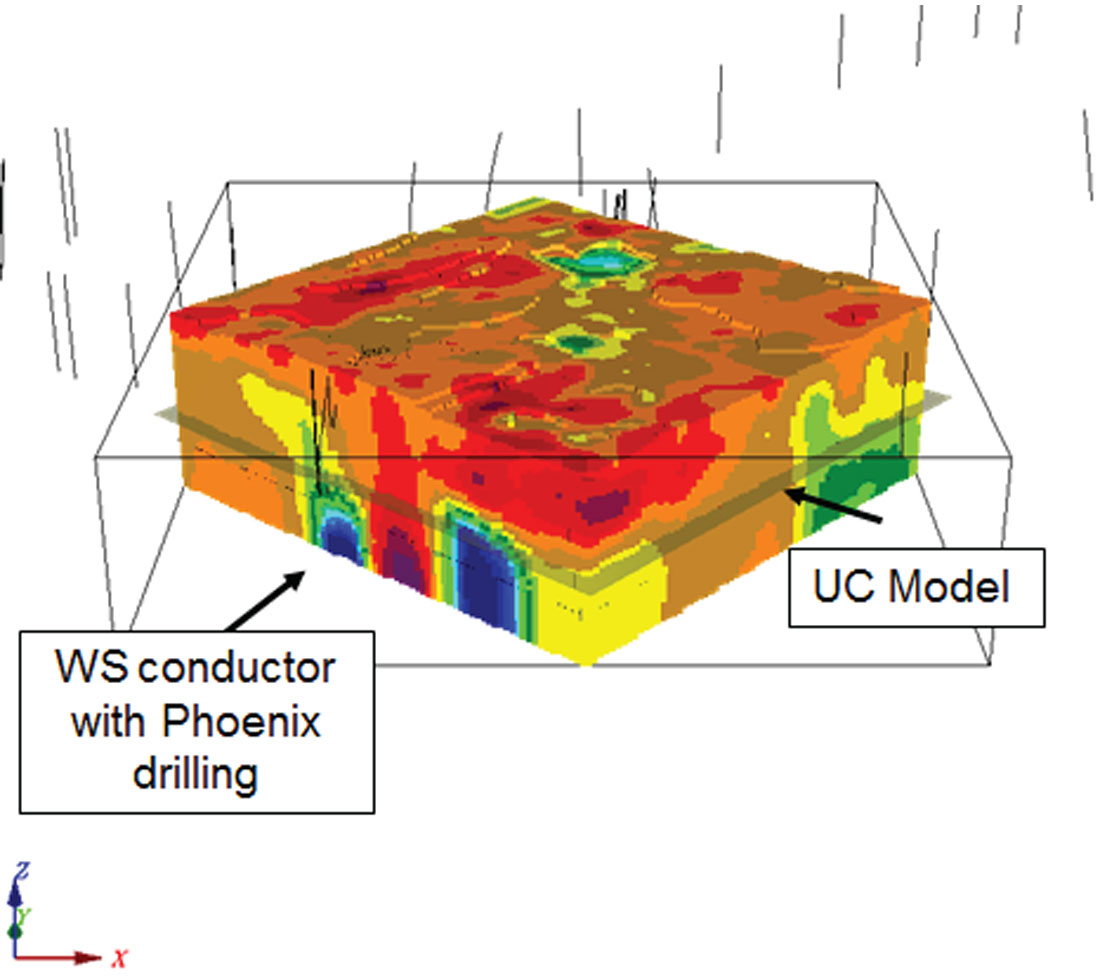
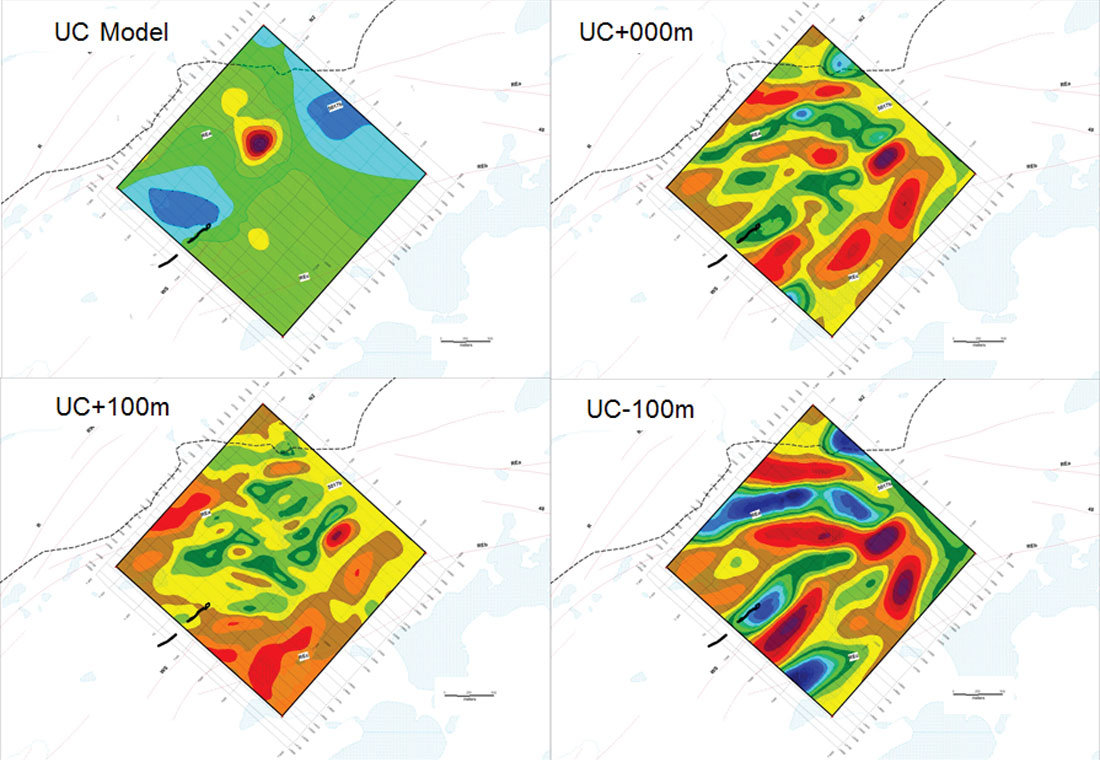
The 3D survey mapped the WS conductor in correlation with the Phoenix deposit (Figure 8). The resolution and accuracy of the ORION 3D survey is demonstrated in Figure 9, showing the difference between images from above (UC+100) and below (UC-100) the unconformity.
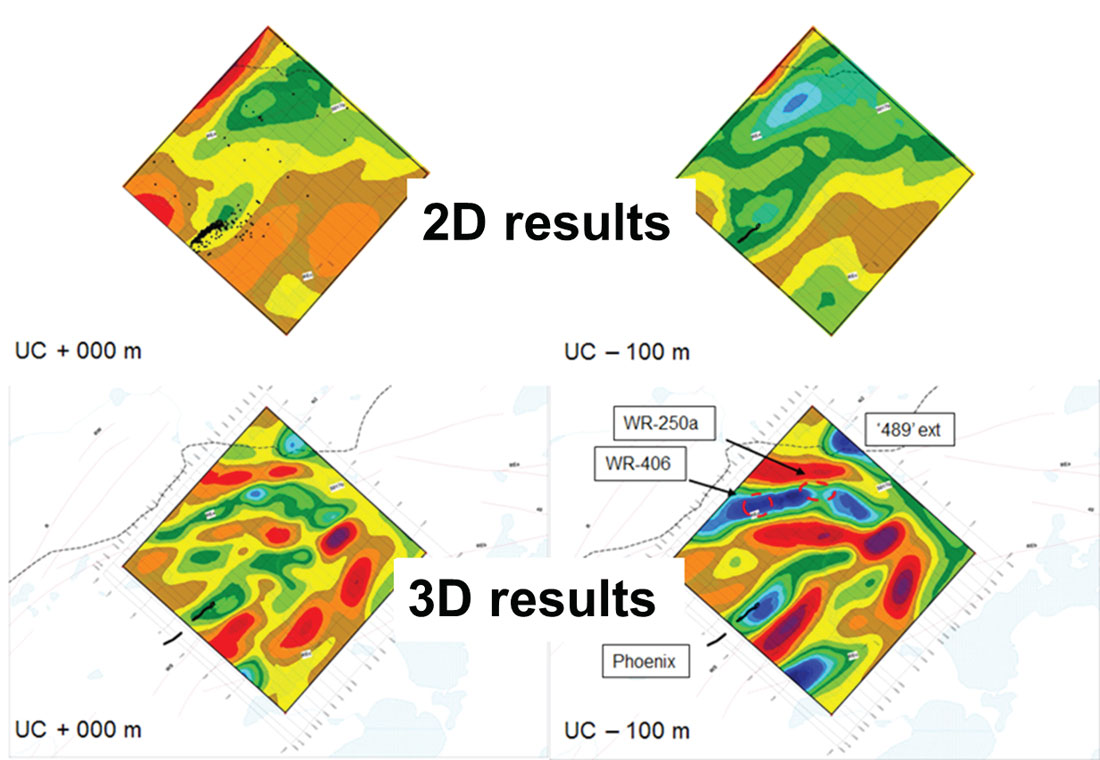
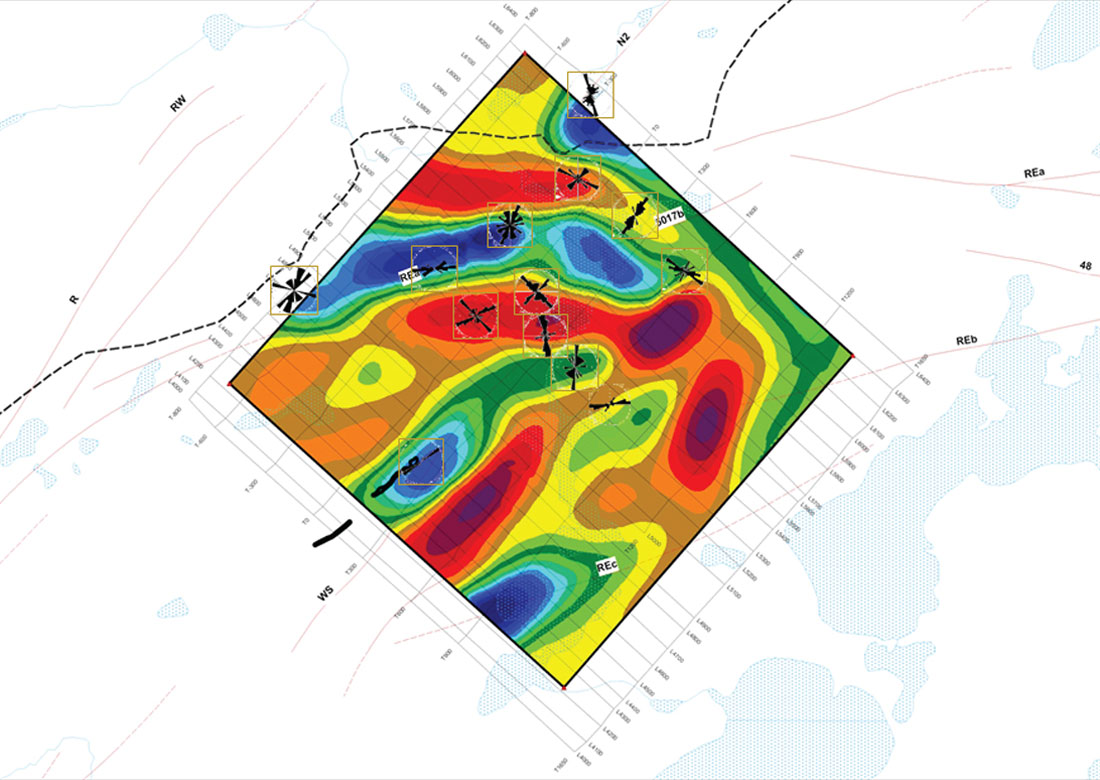
When the historical 2D results are compared with 3D results (Figure 10) the character of the basement is much better resolved and additional features are mapped in the latter. High and low resistivities are more intensely separated, and edges are better defined. The complex strike directions mapped in 3D are consistent with foliation mapping (Figure 11) from drill results.
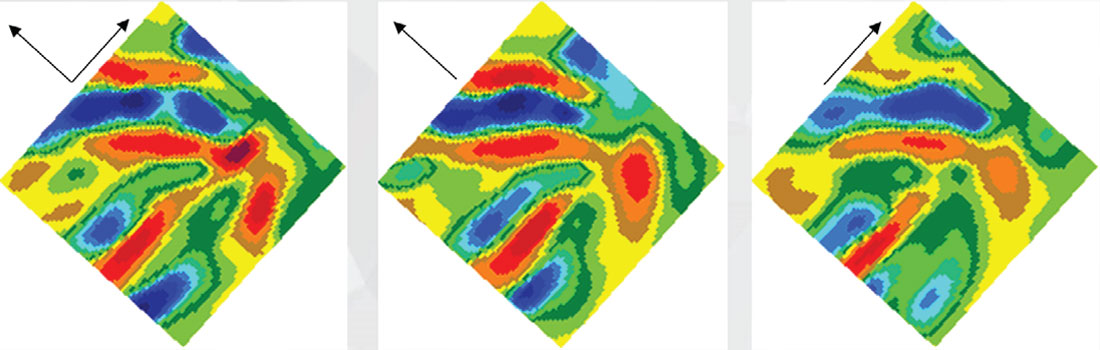
Decomposition of the data into line directions permits confirmation that the 3D information is preserved. The cross-line direction is parallel to general strike and the WS conductor width is less well-defined, but truncation is perhaps more consistent with the strike length of the deposit. Figure 12 shows the 3D inversion results of decomposed datasets.
Conclusions
The high resolution of the 3D models obtained from the ORION3D survey provided geophysical results that were VERY consistent with the KNOWN basement and overlying geology. The correlation between the ORION3D inverted data and the drill hole information (foliation directions and major contacts in particular) is very good and helps resolve the geology in areas where the 2D acquisition failed, in part due to line orientation (oblique to geologic strike). The 3D models displayed more detail and reflected the geometry of the geologic system better than previous results from 2D surveys.
MT and IP results are also available from the ORION 3D survey. Decomposition of the dataset has improved the understanding of the information in the dataset.

Acknowledgements
The authors wish to thank Denison Mines Corp, Cameco and JCU Exploration for permissions; and KEGS for the opportunity to present the original paper this article is based on.


Join the Conversation
Interested in starting, or contributing to a conversation about an article or issue of the RECORDER? Join our CSEG LinkedIn Group.
Share This Article