A mechanical earth model (or “MEM”) is a fundamental tool for considering the relationships between stress, strength and elastic properties of unconventional resources. The ultimate aim of these MEM’s is to aid the targeting of producible “sweet spots” so that an intelligent stimulation plan can be developed that leads to efficient lateral fracture growth, enabling economic production.
Methods that focus on a single parameter, such as Brittleness Index, to model these sweet spots may not necessarily yield optimal results. The reason for this is that multi-variant factors such as variability in total organic content (TOC), varying clay volume and mineralogy, variation in temperature (both present day and in the palaeo-history) and natural fracture patterns and permeability, all act to control/influence the presence of sweet spots (as well as their producibility), not just a single factor.
There are many different methods to create empirical and numerical mechanical earth models, however, empirical well-centric analyses are key to constraining interrelated criteria that can be used to map unconventional reservoir properties such as fracture gradient, kerogen porosity or directional permeability. In order to construct a successful MEM, therefore, these parameters, broadly classified here in this paper into pore pressure, rock physics and geomechanical properties, have to be determined as accurately as possible. This paper reviews how this is or can be achieved.
Introduction
An unconventional reservoir is one that cannot be produced at economic flow rates or that does not produce economic volumes of hydrocarbons without assistance from stimulation treatments or special recovery processes and technologies, such as steam injection (Naik, 2004). Typical unconventional reservoirs are tight-gas sands, coal-bed methane, liquid-rich gas shales and heavy oil deposits. For instance, economical production of gas shales requires enhancement of the inherently low matrix permeability (<0.001 D or 1 mD) of these reservoirs (Hill and Nelson, 2000). Likewise, the gas-bearing formations of the Bossier and Haynesville shales are very tight shale gas plays with extremely low matrix permeability (0.00007- 0.0007 mD) (Zhang and Wieseneck, 2011). Other examples include the Marcellus and Huron shales where permeability is 10-2 to 10-7 mD (Soeder, 1988). Well completion practices employ hydraulic fracturing technology to try to access the natural fracture system and to create new fractures. There are two potential approaches to optimize unconventional reservoir development; a “Manufacture” approach and a “GeoPrediction” approach.
(i) The “Manufacture” approach involves drilling many hundreds of wells as cheaply as possible and assuming that the unconventional reservoir quality is uniform across the play. Pattern drilling and uniform “stimulation” methods are utilised while keeping each well and perforation identical; well orientations and horizontal lengths are kept the same as are pump pressures and the amount of fluid.
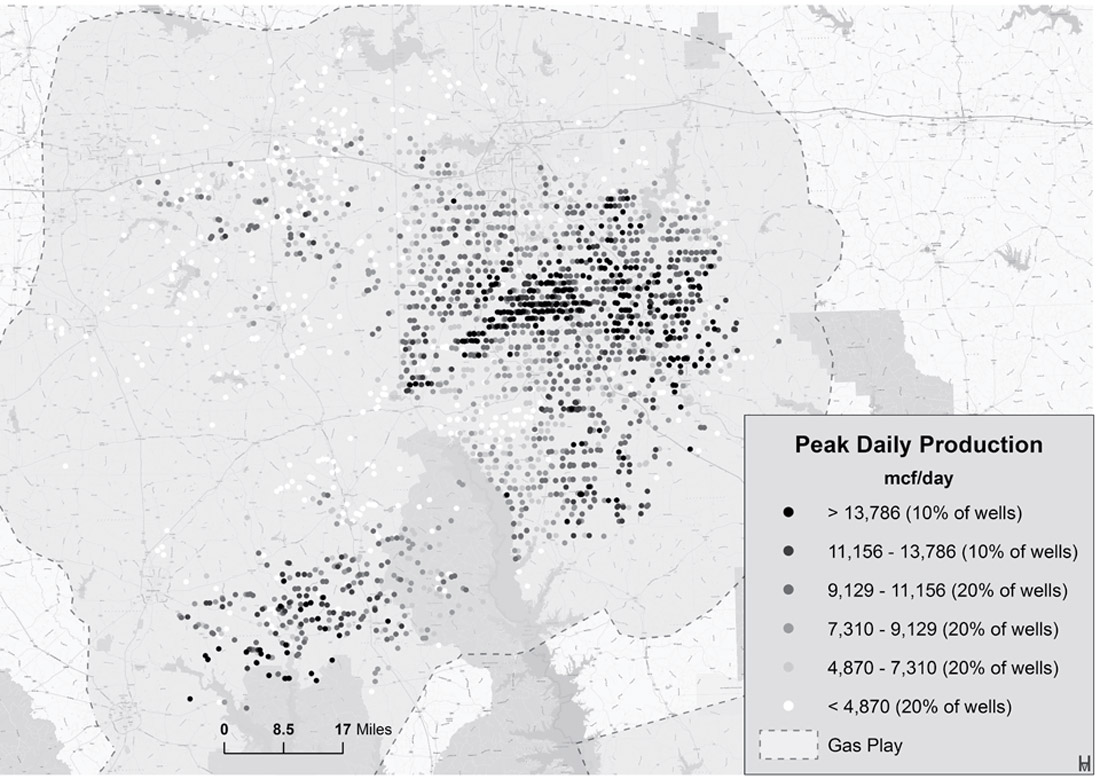
Figure 1, from the Haynesville play, would suggest that a small number of wells provide the majority of production. The reason for this is that reservoir quality is not continuous across this play but that in fact there are “sweet spots” controlled by depositional porosity, natural fractures and pore pressure. Brittleness Index is a calculated property based on various strength and elastic properties of rocks which has been defined differently by multiple authors for use in identifying sweet spots. Although this approach has been taken up by many looking to improve the efficiency of hydraulic fracture operations, it has had limited success and implies that rock properties alone are not the answer. The implication of this observation is that a significant portion of the cost of drilling is being spent on inefficient wells. For example, typical well costs to drill and complete a vertical well in the Cardium play in Alberta, Canada, typically range from CAD$1-$5 million. This cost can triple when the new plays in North-East British Columbia, e.g. Horn River Shale, are explored. Therefore, the cost of an inefficient well is far greater than the expenditure to perform smarter pre-drill analysis that integrates multiple geoscience disciplines, i.e. a “GeoPrediction” approach. At a smaller scale the same is true; a small percentage of the stimulated fractures produce almost all of the gas and therefore the rock quality is clearly not purely uniform.
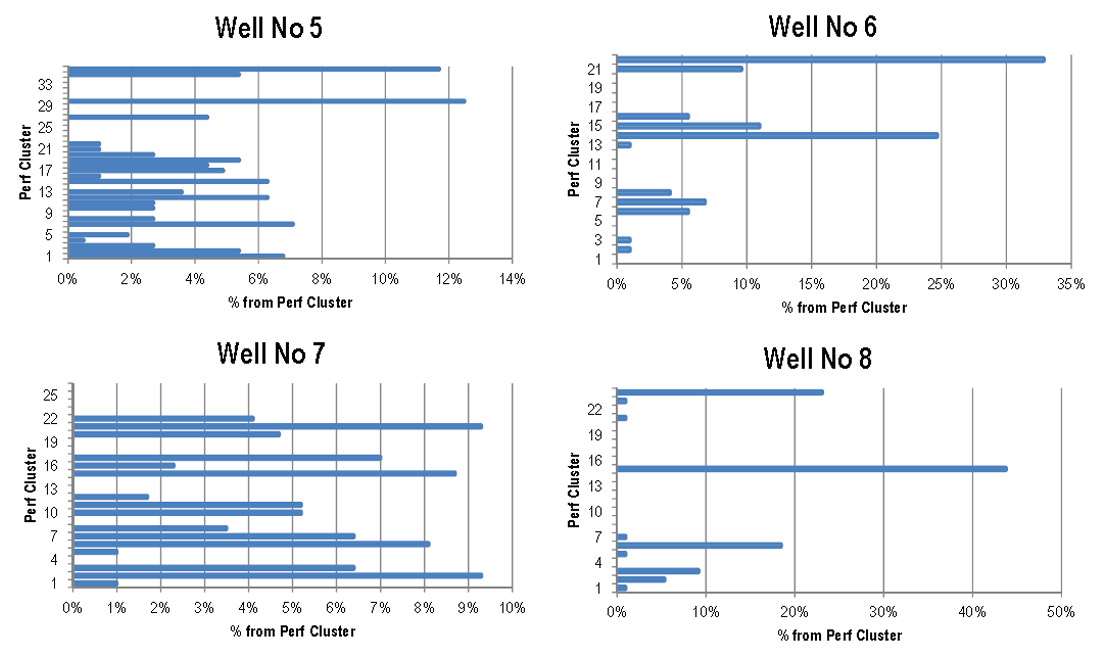
(ii) The “GeoPrediction” approach, discussed in this paper, is based on understanding the processes at play and determining how to be selective in how you drill and fracture wells to optimize the gas recovery / cost ratio through a) identification of reservoir quality, b) avoiding drilling hazards, c) intelligent hydraulic fracturing and d) reducing environmental risk and impact. Figure 2 shows that correct understanding of fracture orientation and permeability can reduce the number of fracture events needed.
The solution to this “GeoPrediction” approach lies in defining a Mechanical Earth Model (or “MEM”) which is a representation of the rock properties, geopressure and stress distributions within the crust. Each of these elements are interdependent and a change in one can impact the other two. An integrated multi-disciplinary approach to model each of these accurately will permit better assessment of the following issues:
- Unconventional rock property analysis of borehole data;
- Multi-scale property calibration of static and dynamic property measurements;
- Reservoir quality assessment for sweet spot identification;
- Finding high pressure and thus enhanced porosity areas;
- Finding and evaluating natural fractures and directional permeability;
- Optimally intersecting natural fracture populations;
- Avoiding kicks due to overpressure, wellbore collapse, loss of drilling fluid;
- Optimising hydraulic fracturing and well completion operations;
- Understanding growth of hydraulic fracture azimuth and fracture containment.
Methodology
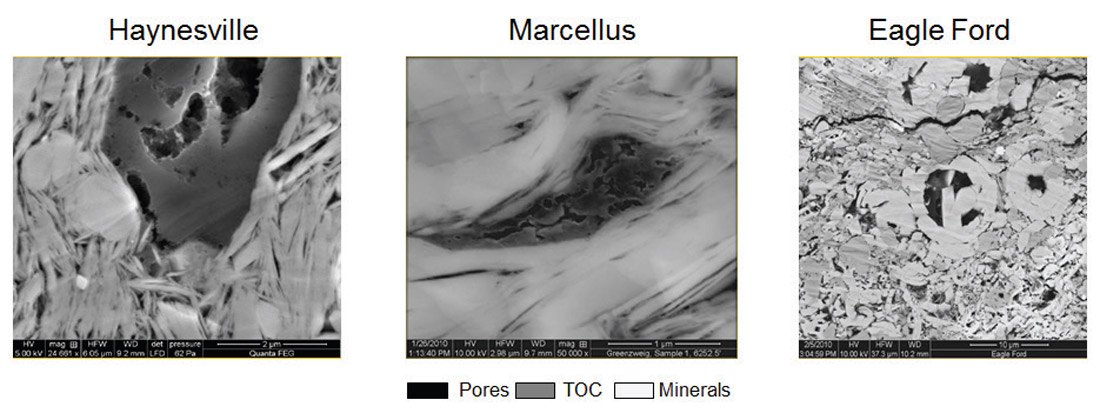
The following discussion has been broadly split into three sections on each of the main inputs to an MEM; pore pressure, rock physics and geomechanics. It should be noted that the same factor, e.g. TOC, may regularly influence more than one input discipline. As well as the three factors discussed, care should be taken to understand the geological regime in which the play is located as this affects the input property model. Published reviews such as Zhang and Wieseneck (2011), Li et al. (2012), Couzens-Shultz et al. (2013) and O’Connor et al. (2014) mention the importance of understanding the geology of unconventional plays, including the impact that burial and uplift history has. Also highlighted in some of the above studies is the importance of understanding variations in shale lithofacies, their constituents and their influences on log/seismic response. An example is shown below in Figure 3 where there is a wide variability of mineralogy, pore shape and distribution of total organic content (TOC) in resource shales (Miller, 2011). The majority of the geological influences on the MEM inputs are captured in the following discussion.
Pore Pressure
Pore pressure prediction uses wireline log data as a proxy for porosity and uses the assumption that a porosity-effective stress relationship exists such that porosity can be directly related to pore pressure. Unconventional plays are typically low porosity (inferring low pore pressure) due to a range of diagenetic (temperature, time and chemical) processes yet may retain high pressure.
Furthermore, the link between pore pressure and log response may be disrupted due to the presence of organic material (high TOC). A variation in TOC is shown to significantly lower the magnitudes of velocity and density (Passey et al., 1990). Slow velocity and low density are typically attributed to an increase in pore pressure so this effect needs to be removed from log data in order to correctly predict pore pressure; high pore pressure can lead to “sweet spot” preservation and hydraulic fracturing that can enhance production without the need for artificial stimulation.
High TOC also, of course, makes for a richer source rock which is desirable. Interestingly work by Carcione and Helle (2002) suggest that the type of overpressure generation can influence both layer (AI, GI) and interface (AVO) responses. Overpressure with undercompaction (also known as disequilibrium compaction) gives brighter amplitudes and reduced AVO gradient, whereas pore pressure generated by unloading (fluid expansion, e.g. gas generation) dims reflections and increases AVO gradient. In a TOC-rich source rock, gas generation would be increased (if the appropriate macerals were present) thus the latter process may be more dominant. The presence of these mechanisms can be detected using rock physics models such as Vp/Rho cross-plotting (Bowers, 1995; Swarbrick et al., 2012). The effect of gas on the Vp log can be removed either using modified Biot-Gassmann or Kuster-Toksoz relationships (Lee, 2008) or via calibrated Vs logs in plays with non-viscous fluids.
Variation in clay content (smectite, illite, and kaolinite) would affect the magnitude of pore pressure as well as how the shales respond to the associated changes in effective stress and compaction. This influence has been highlighted in Yang and Aplin (2005), as well as in a recent paper by Bjorlykke (2014) where work by Mondol et al. (2007) shows that at an effective stress (presumed to be the vertical effective stress; vertical stress minus the pore pressure) of 20MPa at a depth of 2km, smectite clays have 40% porosity compared to kaolinitic clays which have 20% porosity. Katahara (2007) utilised Gulf of Mexico shales to demonstrate other rock physics approaches, i.e. CNL/Rho cross-plots, to determine shale lithofacies. A secondary, although important use, is to sense-check deviations on Vp/Rho plots to determine if these are due to varying overpressure mechanisms or, in fact, lithology changes due to increasing/decreasing clay percentage, either through variation in sediment provenance or through diagenesis.
If the shales have ever reached elevated temperatures, typically > 100 ºC, they may enter the zone of chemical compaction whereby processes such as organic maturation and clay diagenesis will produce water, silica, oil and gas and other reactive components (e.g., Na, Mg and Fe ions). It should be noted that these processes are irreversible hence it is important to understand the palaeo-temperature history of the play and not just the present day temperatures. Porosity will reduce to approximately 5% and is no longer related to effective stress and therefore no longer related to pore pressure. Overpressure will increase, and effective stress reduces at low porosity. Eaton (1975) and Equivalent Depth methods will under-predict pore pressure if the same compaction model is used as for the cooler sediments. The pore pressure can increase due to processes such as fluid expansion and load transfer (where rock compressibility is compromised). Useful reviews of overpressure mechanisms are contained within Swarbrick and Osborne (1998), Swarbrick et al., (2002) and Lahann and Swarbrick (2011).
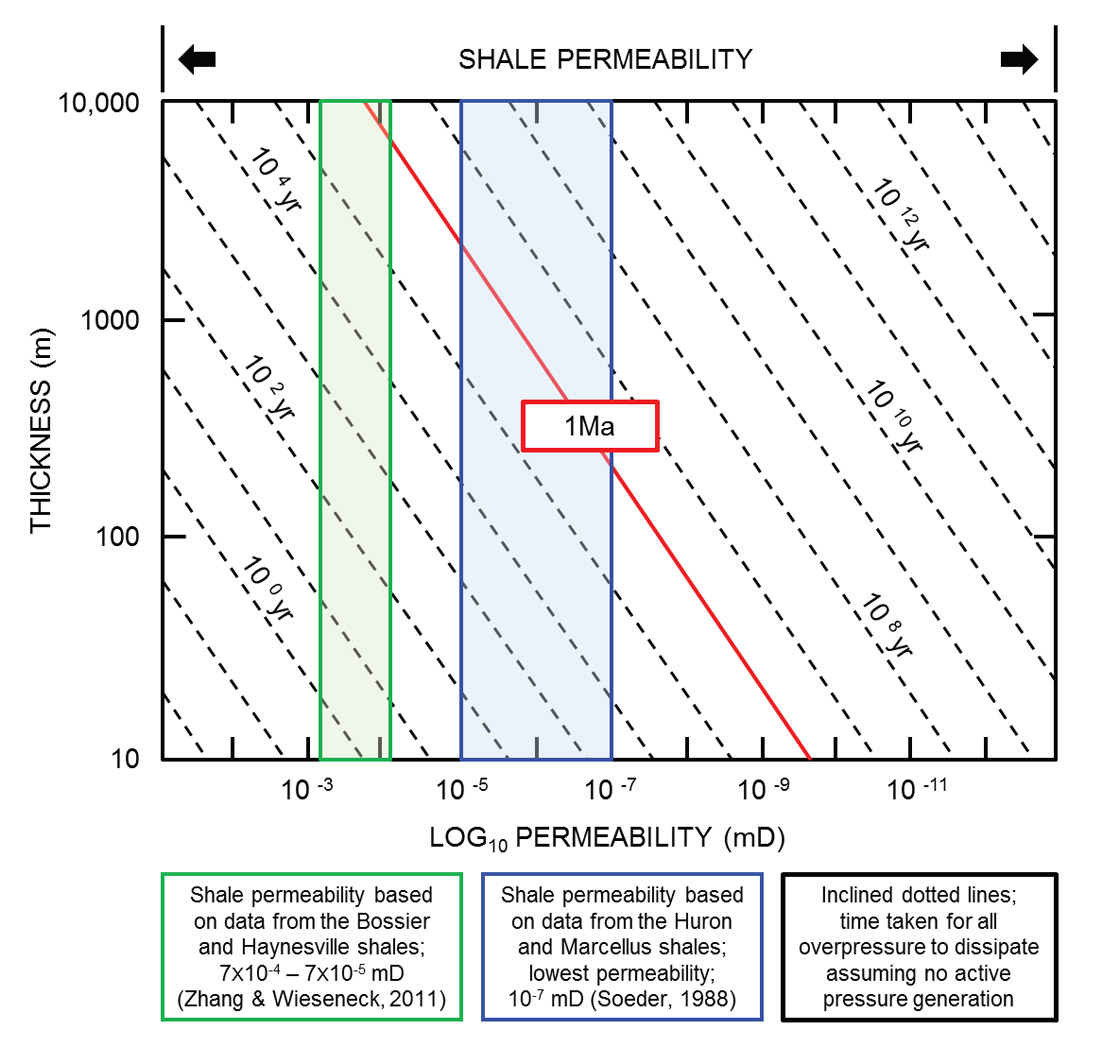
The importance of understanding the geology of these plays, particularly the impact that burial and uplift history was stressed above. Knowledge of shale lithofacies including porosity/permeability and TOC characteristics/ content will be invaluable in determining whether the pore pressure returns to hydrostatic prior to subsequent re-burial for example. The changes in effective stress directly relate to rock physics models used as part of an MEM. A period of uplift (or perhaps a period of non-deposition; a hiatus) is often associated with these unconventional plays (although it is important to stress, not always). If an unconformity occurs (observed from missing biostratigraphic zones on composite log data), then overpressure will have begun to dissipate during the unconformity. The rate of pressure escape can be modelled using data described in Deming (1994) and He and Corrigan (1995), for instance, whereby seal thickness, permeability and time affect how shales can maintain pressure (Figure 4). In this figure, the lowest published permeability data for a selection of unconventional plays has been superimposed. The implication is that even at the low permeability present in these plays, pressure will revert to hydrostatic in 1 Ma unless gas generation and expansion occurs (or seals are very thick).
Rock Physics
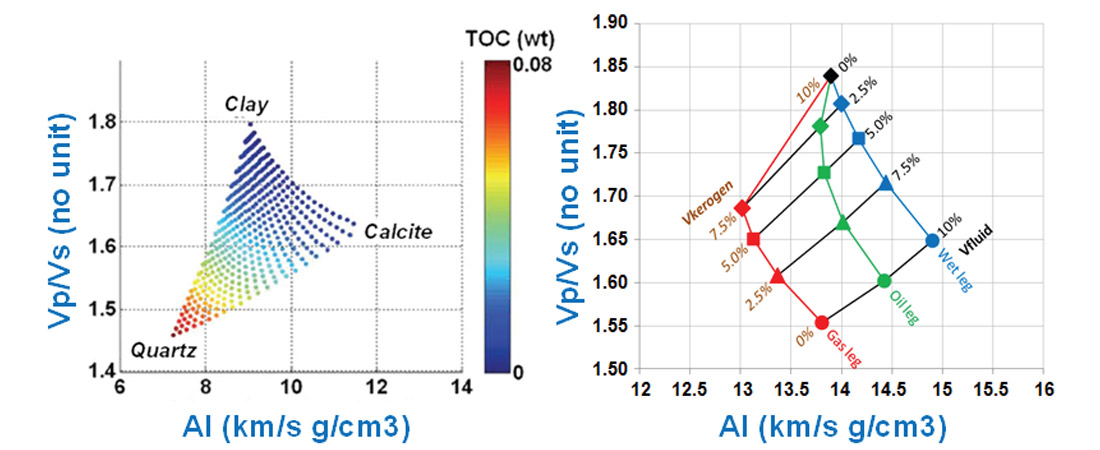
Unconventional rock-physics-based “GeoPrediction” is a time- and resource-effective approach, compatible with the fast turnaround of unconventional drilling schedules. Rock physics, defined as the link between the geological knowledge from wells, fluids and organic material present in formation pore spaces and their intrinsic seismic signatures, provides valuable technical insight on independent physical rock properties. These properties are used to predict elastic, geomechanical and related geological conditions from locally-calibrated poro-elastic models in the subsurface. Figure 5 (left) shows the dependence of geophysical properties on rock properties, e.g. mineralogy and TOC, where an increase in clay content increases Vp/Vs ratio and increase in quartz content decreases Vp/ Vs ratio. High calcite content results in high acoustic impedance. As mentioned above changes in velocity are often interpreted as changes in pore pressure; such an assumption could lead to destabilisation of the MEM without a full rock physics assessment. Figure 5 (right) shows the influence of kerogen in the elastic response of a tight reservoir under different fluid saturation conditions. For instance, a 10%-porosity brine-saturated organic shale exhibits similar Vp/Vs values as if it is saturated with gas at 50% with the remaining 50% of the matrix pores filled with kerogen. Likewise, a 10%-porosity gas-saturated organic shale shows the same AI value when its pores are filled with kerogen. Therefore, the AI-Vp/Vs domain require a bi-variate interpretation of lithology and fluid projections in order to accurately assess range of values related to either presence of kerogen or hydrocarbon saturation.
In order to identify unconventional sweet spots with the best reservoir quality (e.g. Davie et. al. 2012) the following steps are necessary:
- Identify mineralogy and lithofacies from core data (XRD, thin sections);
- Determine pore content and TOC volume from and core and calibrated logs;
- Estimating TOC thermal maturity of organic‐rich facies from petrophysical logs;
- Determine the relationship between elastic properties and facies;
- Underpin rock physics models by developing a geological model taking into account pressure generation, shale diagenesis, and their effect on porosity preservation; and
- Quantitatively interpret most-likely indicators of reservoir quality at sweet spots, using models constructed from calibrated seismic elastic and mechanical properties representative of changes in facies, TOC, and pore type/shape.
Additional subsurface characteristics must be considered to calculate an optimal fracture placement that results in strong initial production and sustained flow. This includes understanding the natural fracture populations (Downton, 2014) as well as the ability to initiate productive new fractures. The latter is related to the geomechanical strength of the reservoir and the surrounding formations, and these properties are mapped through their relationship to elastic logs. Rock physics assessments explain observed variations in elastic properties in terms of constituent components, and relate them to properties that can be mapped extensively through 3D seismic. An example of this is shown in Figure 6 where clay content is seen to control the Vp/Vs ratio and hence Poisson’s ratio, which impact in-situ stress and strength. Alternate parameterizations are possible, such as the LMR approach of Close et al. 2012.
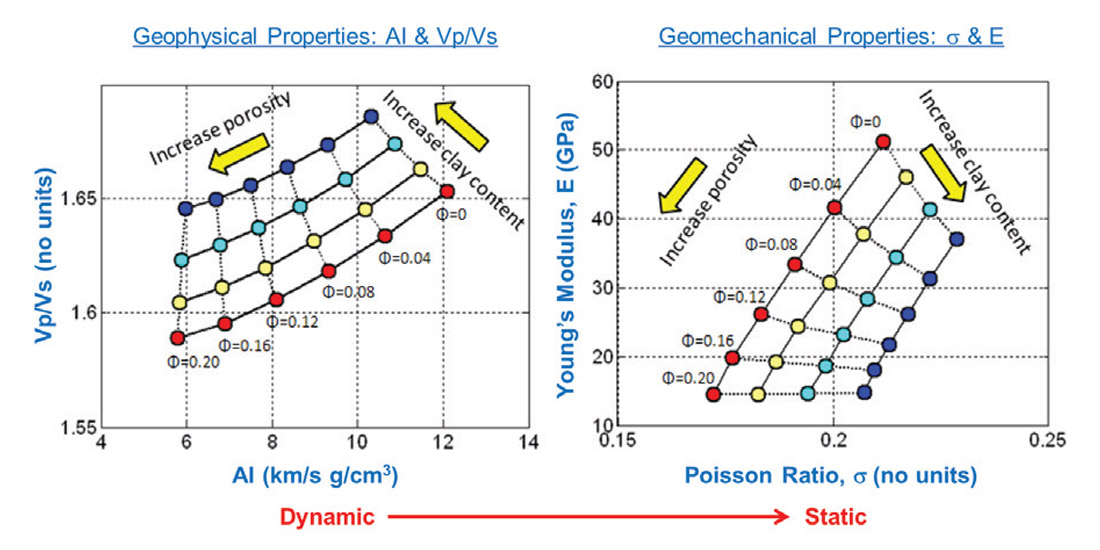
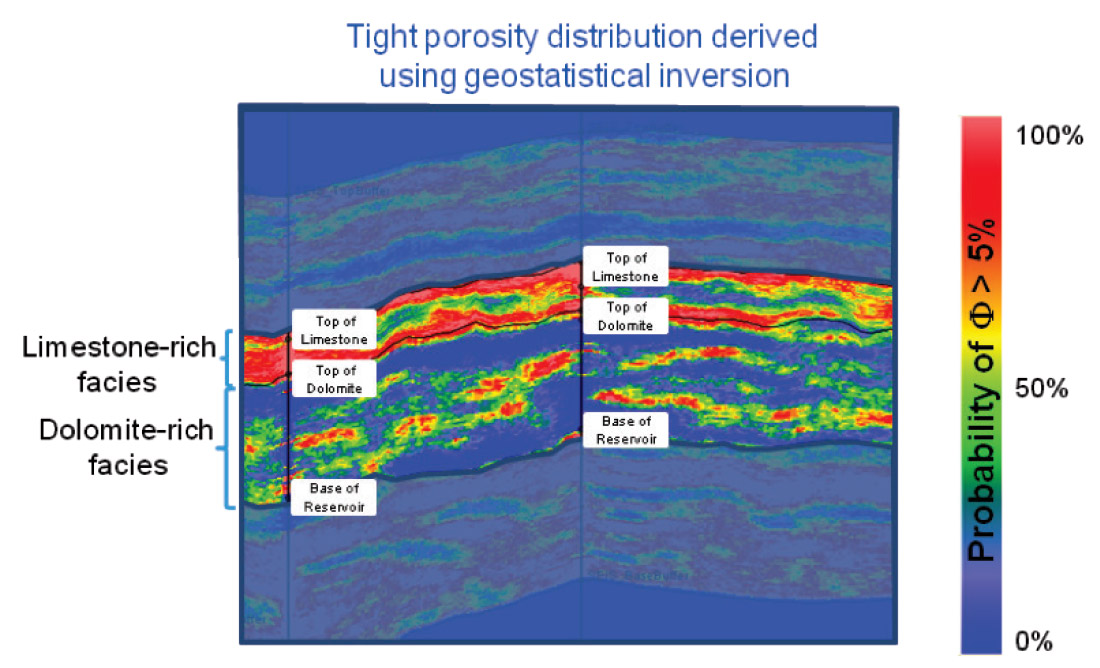
Figure 7 shows an example of the use of elastic properties at seismic scale (102m) to characterize tight reservoir properties at log scale (10-1m). Limestone-rich facies show a marginal PDF distribution of porosities if compared to dolomite-rich facies, due to secondary porosity developed over the limestone-rich interval, as interpreted from elastic properties assessed geostatistically at seismic scale. Note that dolomite-rich facies, considered as the main target of this tight reservoir, exhibit a scattered distribution of high porosities consistent with the rock physics model at log scale; this multi-scale result is used to assess optimal well path design leveraging high in-situ porosities (and permeabilities) along reservoir facies.
Geomechanics
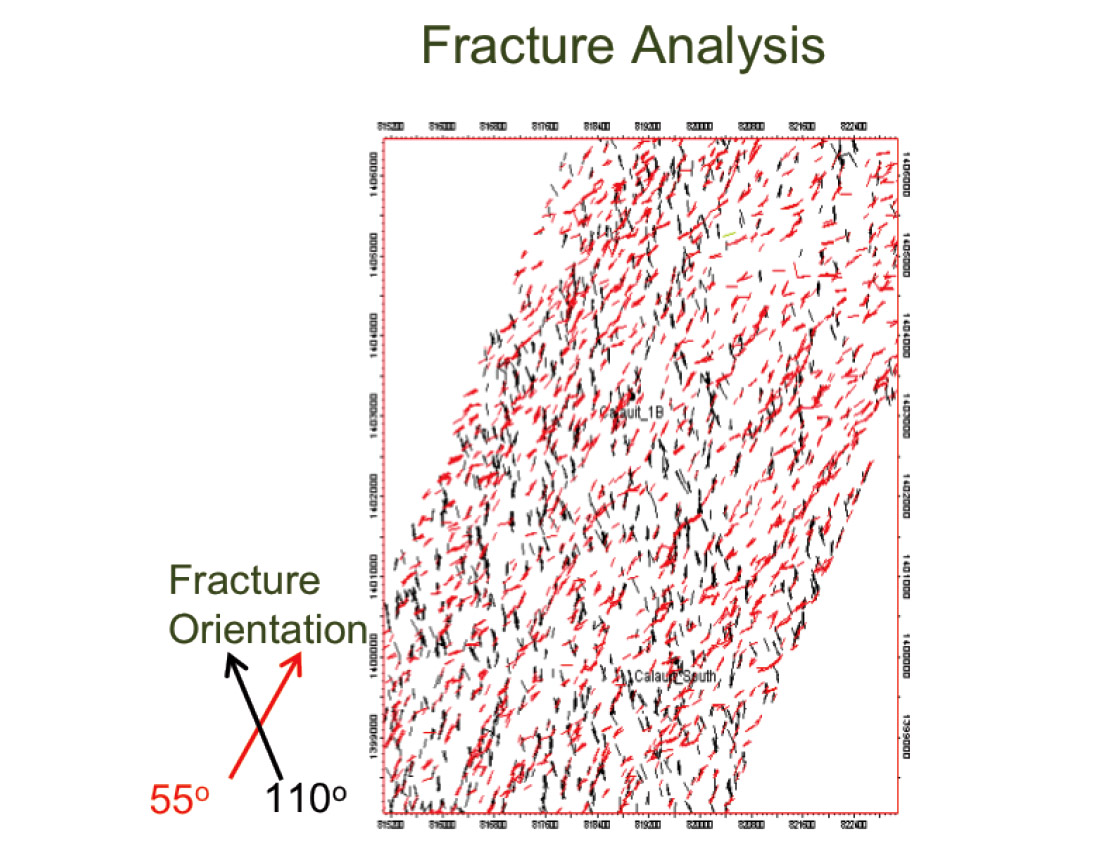
Burial history as well as lithology of sediments dictates their stress history. For instance, in fractured basement reservoirs, brittle rocks host more fractures than non-brittle or ductile rocks. The primary controlling factors are rock type, grain size, cementation, porosity, temperature and the effective confining pressure (Stearns and Friedman, 1972). Natural fracture patterns are reflected by the local in-situ stress state and rock properties at the time of fracturing. In Figure 8, from the Cooper Basin, Australia, an example of Natural Fracture Network characterisation is demonstrated. Depending on fracture orientation, permeability will vary. Permeability is the function of effective pressure (effective stress); K= f(Pe). As an example, monitoring wells from the White Tiger field in Cuu Long Basin, Vietnam it was observed that increasing the effective pressure Pe to 400at, the fracture permeability K would reduce from 95-97% to 60% due to rock properties (Huy et al., 2008). Stress changes, also influence pore pressure. Vertical and horizontal stress increases result in overpressure in normally or unconsolidated, undrained low-permeability sediments; overpressure due to tectonic stresses can be far higher in these situations than that generated purely by rapid sedimentary loading and can be problematic to detect as there can be no associated porosity anomaly (Yassir and Addis, 2002).
Traditional permeability is partly controlled by the effective stress and, as mentioned above, this is typically the vertical effective stress. It is worth noting that geopressure and geomechanics disciplines use the term “effective stress” whereas the same parameter is often referred to as “effective pressure” within rock physics; within this paper we use the term “effective stress”. In unconventional plays, permeability is realised through either natural or artificial fractures.
An intelligent stimulation plan leads to improved fracture placement to facilitate fracture growth, connectivity to natural structural elements and constraint within the target resource layer enabling economic production and avoiding loss of hydrocarbons due to out-of-zone fracture growth.
Natural fracture populations and orientations can be characterized using image log analysis and geomechanically assessed to better understand their behaviour with respect to hydraulic fracturing. This is done using the technique described by Mildren et al. (2005) which determines a pressure change (ΔP) required to initiate failure for any particular fracture surface with a defined strength in a particular stress field. This measurement can provide a relative permeability ranking of all fracture orientations in that stress environment, i.e. how far from failure a fracture plane is within the applied stress field. Low ΔP means a greater likelihood of permeability which corresponds with risk of failure.
A Mohr Circle diagram is a visual representation of effective principal stresses and can be combined with a failure envelope representative to the strength of the material (rock, fracture, fault etc.) under consideration. The relationship between the Mohr Circle and the failure envelope depicts the occurrence of brittle failure, the orientation of failure and the mode of failure (tensile, shear or mixed-mode). Various failure criterion can be used, however, for the purposes of this paper the Coulomb failure criterion have been implemented. Failure is represented on a Mohr Circle diagram as the point where the Mohr circle intersects the failure envelope. An increase in pressure, decreasing the effective stress, is reflected on a Mohr diagram by shifting the Mohr Circle to the left towards failure. Resolving the principal stresses acting on a fracture surface permits it to be plotted within the Mohr diagram using shear and normal stress coordinates. The pressure change required to initiate failure and the relevant failure mode can therefore be determined. The advantage of this approach is that effective stresses are used in conjunction with rock properties to assess structural permeability whereas Brittleness Index is limited to rock properties only.
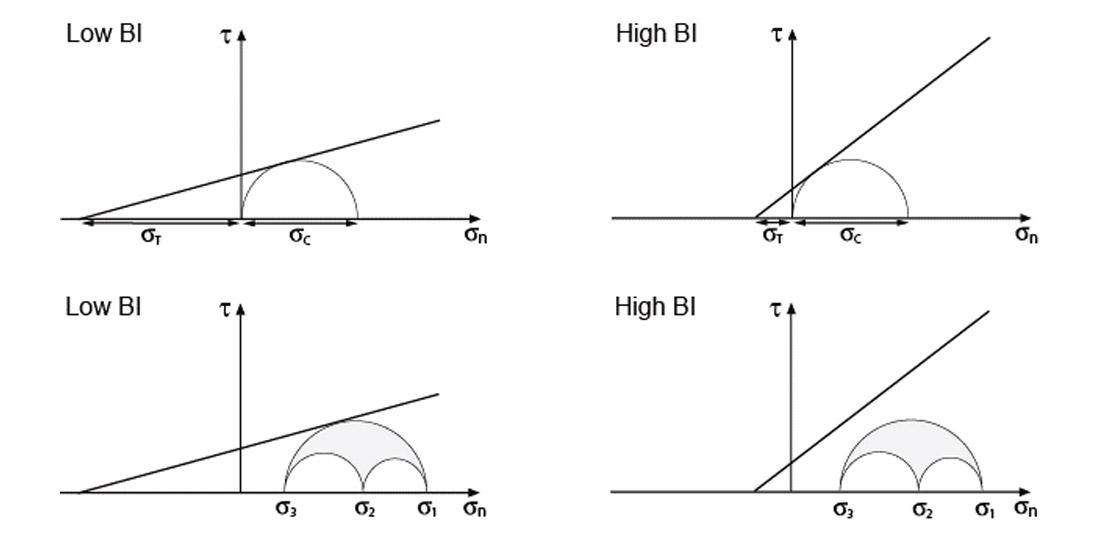
Brittleness index (BI) is a commonly used property when assessing unconventional resources and generally it is defined as a measure of the ease by which the rock can be fractured based on its total organic content, i.e. less TOC implies a more brittle material and therefore greater ability to be fractured. In this manner, it has been used as an indicator of suitability for hydraulic stimulation and a tool to map permeability “sweet spots”. There exist multiple ways to define brittleness index and most commonly include a term for compressive (σC) and tensile (σT) strength (Altindag, 2003). These algorithms are indicative of the “shape” or slope of a failure envelope and are related to rock strength, rather than the preference for brittle deformation. More importantly, this measurement remains independent of the stress distribution and therefore not necessarily a clear indicator of fracture likelihood.
The likelihood of failure/fracturing can be the same independent of the Brittleness Index if the stress distribution is appropriate (Figure 9). Used in isolation independent of the stress conditions, brittleness itself is unreliable. Improved criteria can be derived from evaluating the relationship between strength and stress which is more indicative of failure and therefore more closely related to natural permeability and improved production. Furthermore, an independent means of estimating organic content should be used to consider the likelihood of brittle or ductile deformation.
1D geomechanical models are commonly borehole-centric creations based on empirical data. Most of the data used to constrain MEMs come from existing wells (wireline, image log and drilling data) and laboratory tests of core/cuttings material. Where additional offset data are available, a wireline-based rock physics model can be used to generate compressional and shear velocities where none exist. Similarly, input properties could also be generated from seismic for model construction. Once offset 1D mechanical earth models have been constructed, spatial interpolation for predictive geomechanical assessment can be performed using a range of methods that fall within three categories; non-geostatistical methods, geostatistical methods and combined methods (Li and Heap, 2008). Seismic data can be used to guide interpolation of wireline data or, through inversion for density, shear and compressional velocities, form the basis for calculating stress magnitudes to create a 3D geomechanical model (e.g. Goodway et. al., 2012). Static property models derived through these methods can be used to construct property models for dynamic modelling of stresses and fluid pressures using numerical methods which can be projected through time. In all cases, stress, strength and elastic property based criteria can be applied to these models to identify permeability sweet spots.
Case Study
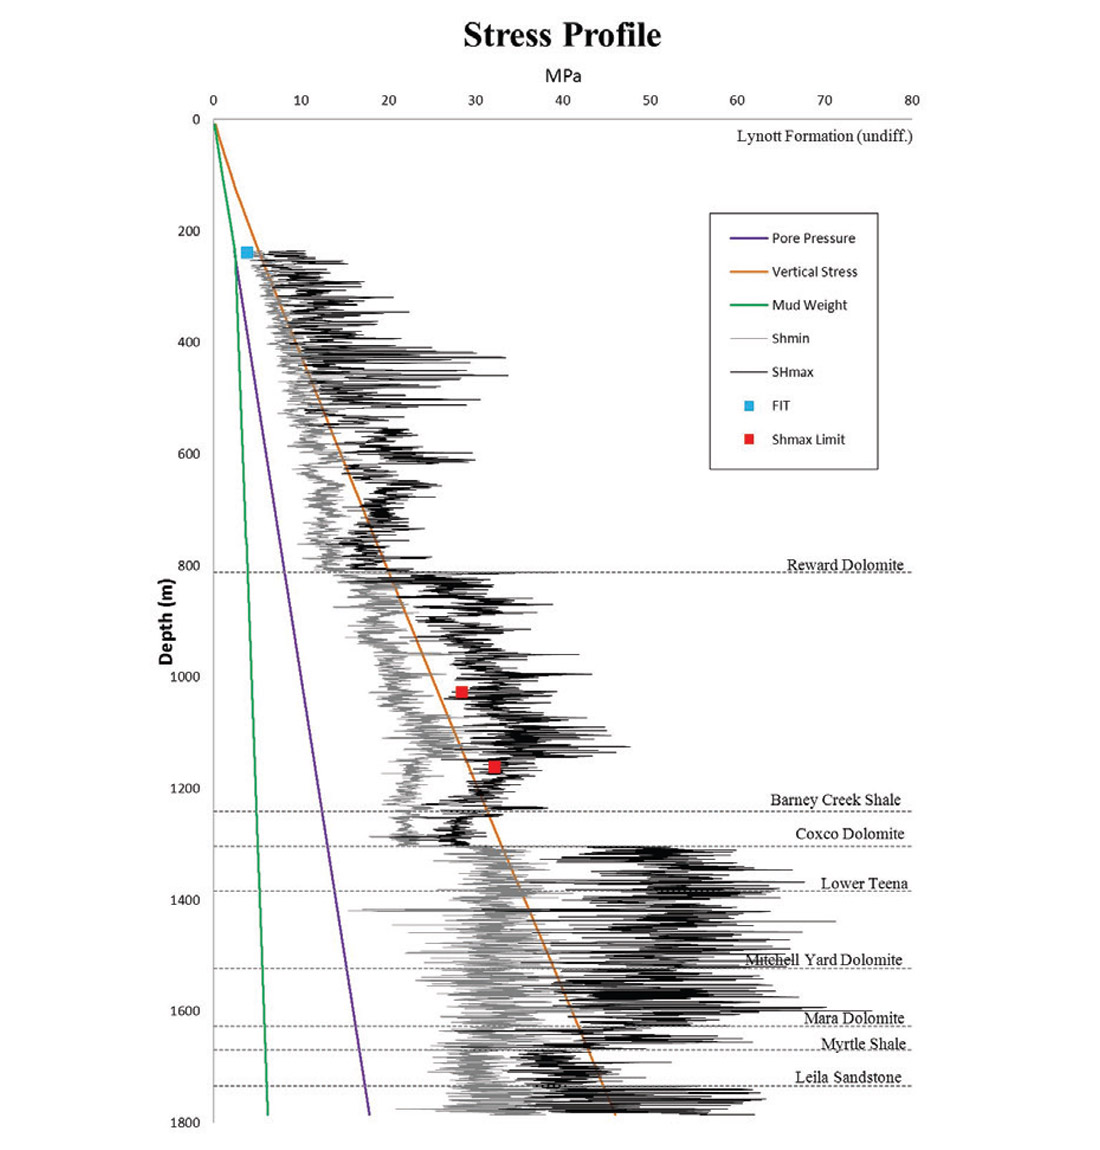
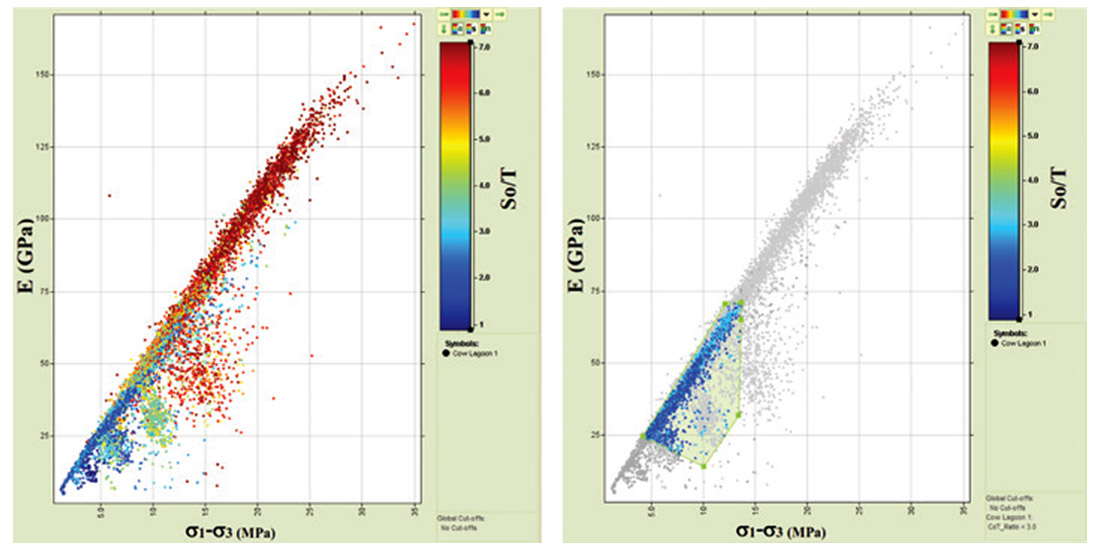
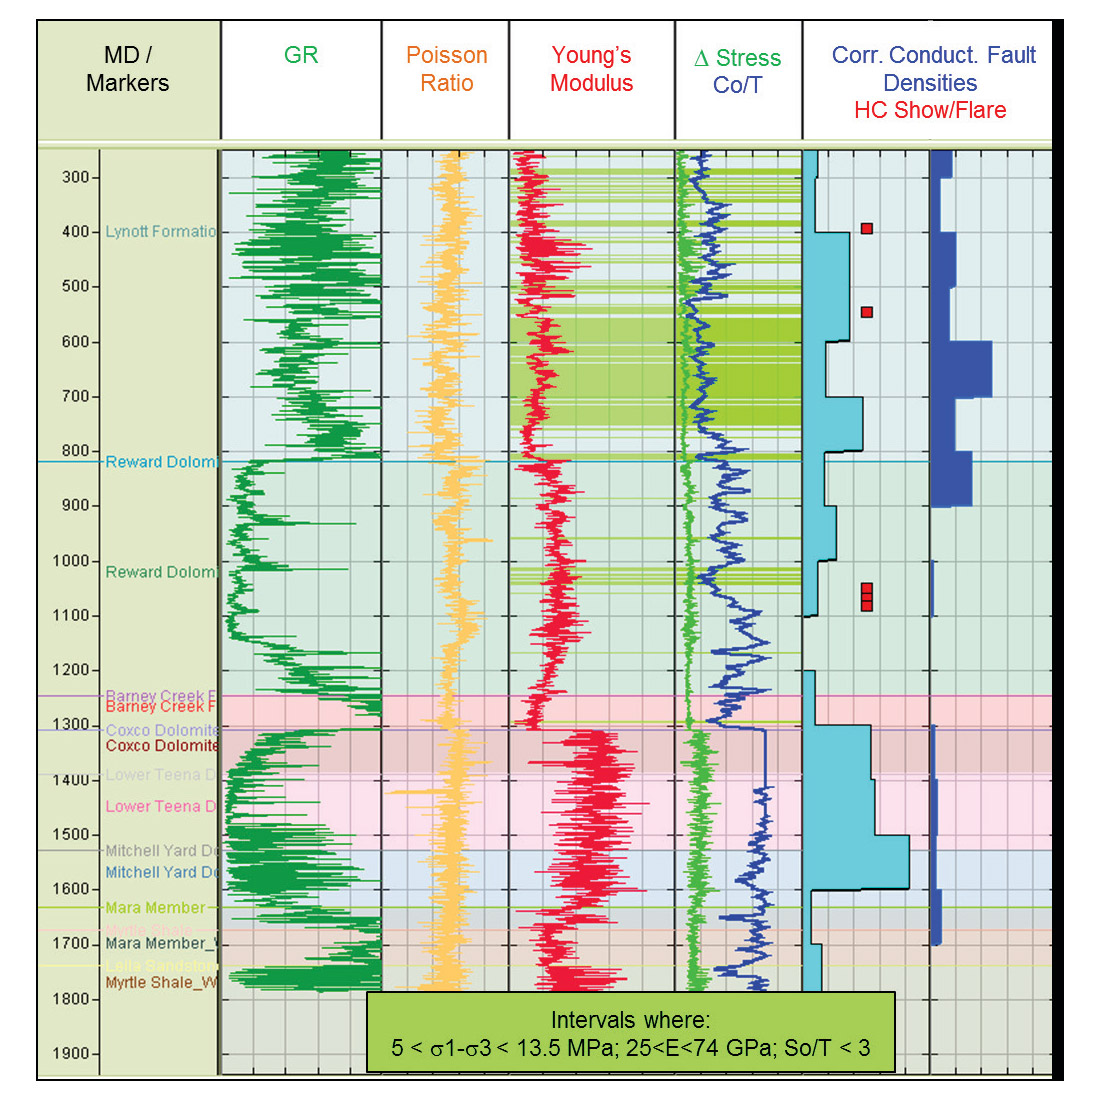
An unconventional borehole-centric dataset is used to demonstrate the use of multiple criteria to identify permeability zones. Figure 10 illustrates an empirical 1D geomechanical model for Cow Lagoon-1 located within the McArthur Basin, Northern Territory, Australia which was drilled by Armour Energy in 2012 to assess the unconventional prospectivity of the Batten Trough. Contemporary horizontal stress magnitudes vary considerably with depth and stress regimes range between strike-slip and extension within formations with differing elastic properties. This distribution of stress demonstrates the poroelastic effect expected in a high strain environment with low Youngs Modulus units correlating with low differential stress and high differential stress associated with high Youngs Modulus units. Stress, strength and elastic properties were analysed to identify relationships that correlate with natural fractures and documented hydrocarbon shows (Figure 11). Target horizons in the Batten Trough are characterised by low Young’s Modulus, low differential and low effective stresses and correspond with the following criteria: differential stress between 5 and 13.5 MPa, Youngs Modulus between 25 and 74 GPa and strength ratio (So/T) less than 3 (Figure 12).
These criteria can be applied to a 3D mechanical earth model to map locations with matching characteristics that includes a greater potential for production based on the presence of permeable natural fracture populations with stress and strength conditions conducive to stimulation.
Conclusions
In unconventional plays the ultimate aim is to target permeability “sweet spots” and then develop an intelligent stimulation plan. This leads to an efficient lateral fracture growth, within the resource layer, enabling optimal economic production and recovery. There has been a tendency to develop or rely on methods that focus on a single parameter such as Brittleness Index as a way to high grade acreage for development.
Brittleness index (BI) is a commonly used property when assessing “sweet pots” locations but this measurement remains independent of the stress distribution and therefore not necessarily a clear indicator of fracture likelihood. A Mohr-Coulomb diagram is a better representation of stress and strength. It is the relationship between the Mohr Circle and the failure envelope that describes brittle failure occurrence, the orientation of failure and the mode of failure. Further, stress is a function of pore pressure as well as the properties of rocks, whether carbonate, sand or shale.
Hence, any models developed for exploitation of unconventional plays should include parameters that, broadly speaking, can be linked together under the groupings of rock physics, pore pressure and geomechanics. Many geological factors present in most unconventional plays can have a significant impact on the derivation of accurate pore pressure, rock physics and geomechanical inputs into a successful model; these include
- An increase in TOC is shown to significantly lower the magnitudes of velocity and density which may lead to erroneous pore pressure and elastic rock property responses. Conversely, a lower TOC leads to a more brittle rock often considered a positive when placing wells and designing fracture stimulations.
- A variation in clay content would affect the magnitude of pore pressure as well as Vp/Vs ratio and Poisson’s ratio.
- Elevated temperatures promote clay diagenesis changing the rock framework, affecting factors such as clay mineralogy, hydrocarbon saturation, reactive components, compressibility, porosity, AI and permeability.
- Natural fracture patterns are reflected by the local in-situ stress state at the time of fracturing. Stress directions can be inferred from image log analysis. The order in which fractures are stimulated can affect their size and maximise reservoir contact from each stage of hydraulic fracturing.
Thus, in conclusion, we propose that the most robust model that can be developed to optimise these unconventional plays is an integrated mechanical earth model (or “MEM”). This is a fundamental tool for considering the relationships between stress, strength and elastic properties of unconventional resources. There are many different methods to create empirical and numerical mechanical earth models, however, empirical well-centric analyses are key to constraining interrelated criteria that can be used to map unconventional reservoir properties such as fracture gradient, kerogen porosity, or directional permeability. These parameters can determined from the property model and the pore pressure which are obtained from inverted seismic data to model in multi-dimensions.

Acknowledgements
We would like to thank ConocoPhillips for the permission to show some of the material within this paper.


Join the Conversation
Interested in starting, or contributing to a conversation about an article or issue of the RECORDER? Join our CSEG LinkedIn Group.
Share This Article