This case history is based on a coarse 3D seismic dataset that was acquired for a commercial Steam Assisted Gravity Drainage (SAGD) project in the Athabasca oil sands in Alberta. In conjunction with a dense core-hole drilling program, this legacy 3D seismic dataset was acquired to better understand the geological setting, assess the thickness and quality of the reservoir and decide how to orient the SAGD pads that were used to develop the field.
The efficiency of the SAGD process is a function of reservoir properties e.g. lithology, stratigraphy, relative permeability, fluid mobility, fluid saturations. 4D seismic has historically been the method of choice for characterizing the evolution of the reservoir, and in particular for monitoring the growth of the steam chambers around the SAGD well pairs. 4D seismic surveys based on the same acquisition parameters were acquired above specific well pads over the years.
To assess future developments in the area surrounding the project, a new 3D seismic survey will need to be acquired in the near term future. Beforehand, a review of the legacy 3D seismic surveys was conducted. Some of the questions that were raised include:
- Are they any obvious limitations with the acquisition parameters of the legacy 3D survey in light of today’s technology?
- Given that the source line spacing to primary target depth ratio is between 3 and 4, would 5D interpolation be of any help?
- With the advances made in seismic imaging since these data have been acquired, would the pre-stack time imaging results be better now?
- As all of the data lies within a 400ms two-way travel time window, would pre-stack depth imaging improve the spatial resolution of the seismic images?
- Could we quantify the amount and type of anisotropy that affects the data and could we take it into account in the depth imaging data processing flow?
- Finally, would the reprocessed data be more suitable for a quantitative interpretation?
Geological setting
The geological history of the area is extremely complex and not yet fully understood. The subsurface can be divided into five layers, each having their own internal complexity (Figure 1).
At the top, there is a thick Quaternary section that represents most of the overburden. It is made of glacial tills, former glacial lakes, etc. It was subjected to multiple glacial and interglacial intervals that left internal unconformities. Periodic ice-sheets of variable thickness carried and deposited glacial drift and till. The structural framework of the Quaternary shows gravity induced slumps, duplexes and internal small displacement faults.
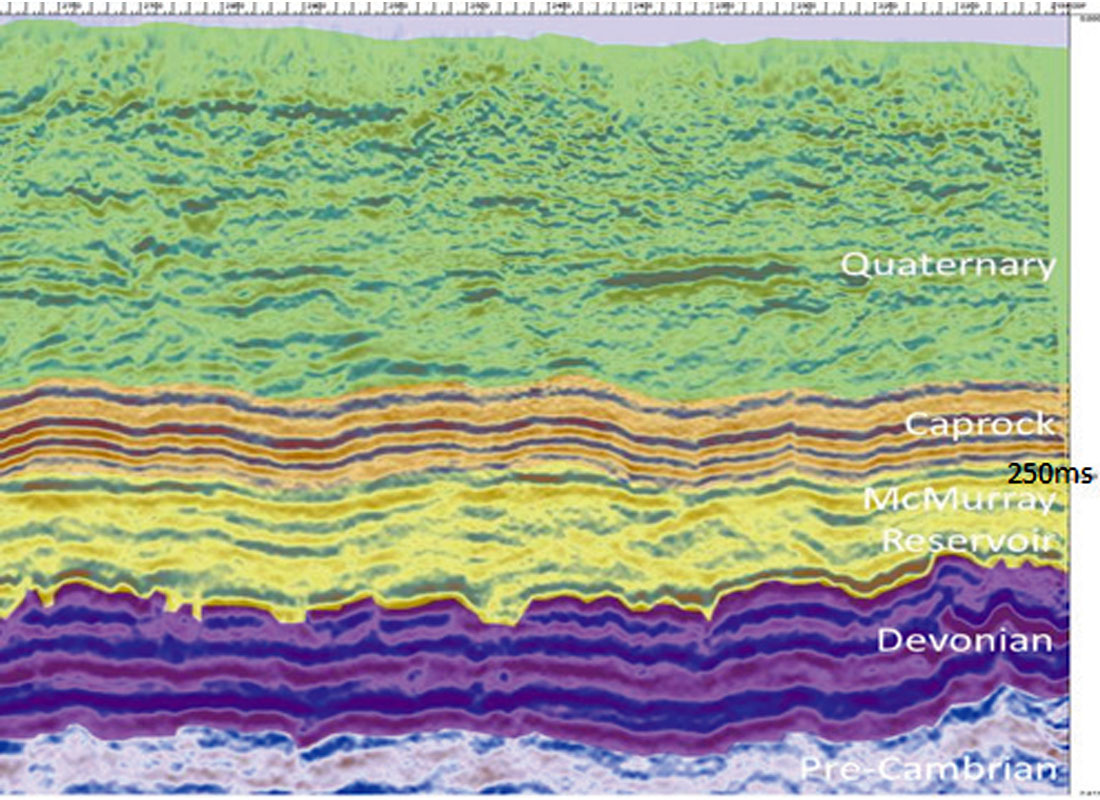
At the base of the Quaternary there is a major unconformity that corresponds to a period of erosion of a thick package of sediments dating from the late Cretaceous to the early Quaternary. Below this unconformity the Clearwater and Grand Rapids formations are mostly shaley, and form the cap rock. The caprock is finely layered and exhibits a very uniform lithology over the project area. It has an undulatory shape that was induced by the differential compaction of the underlying McMurray reservoir.
Below the caprock, the notoriously complex McMurray reservoir is made of inter-braided channel systems and inclined heterolithic stratification (IHS) that vary from clean sand beds to silty muds. At the base of the reservoir, there is a major unconformity that spans more than 200 million years, resulting in an extremely rough and weathered surface with paleo-topographic highs and lows. The Devonian formation is highly faulted, karsted and the paleo-surface is riddled with sink holes (Altosaar 2013). Some of the faults in the Devonian have clearly controlled the sedimentation of the McMurray reservoir. The Devonian section lies unconformably on the Precambrian basement. The contact between these two formations is another very rugged and weathered unconformity. Numerous fault-bound rhomboidal blocks can be identified at the top of the Precambrian.
Acquisition parameters of the legacy 3D dataset
The legacy 3D survey was shot in 2000 and covers a 14km2 rectangular area. The source line and receiver line spacing are 90m in an orthogonal geometry. The source station and receiver station spacing are 30m creating a 15m x 15m CMP bin. The dynamite source has a charge size of 1/8kg at a depth of 9m. The patch consists of 10 lines x 28 receiver stations (900m x 840m). The receiver stations consist of a string of 6 Oyo 30CT, 10Hz geophones that are clumped together (no array). The sample rate is 0.5ms. The fold taper is standard (i.e., a quarter of the patch size). The migration aperture includes the fold taper.
This geometry results in extremely low fold in the Quaternary with only 2 or 3 traces per bin. At a depth of 300 to 350 meters, corresponding to the base of the McMurray reservoir and the top of the Devonian, the fold increases to about 23 traces per bin. Assuming an average velocity of 2200m/s down to the McMurray reservoir, the maximum un-aliased frequency is around 73Hz for a minimum opening angle of 30 degrees (diffraction energy).
A quick review of these acquisition parameters concluded that:
- The source line spacing and receiver line spacing are too coarse to capture the heterogeneities that lie within the shallow portion of the Quaternary section.
- The frequencies that are required to achieve the resolution that we desire today are much higher and would require a tighter source and receiver spacing i.e. a smaller bin size.
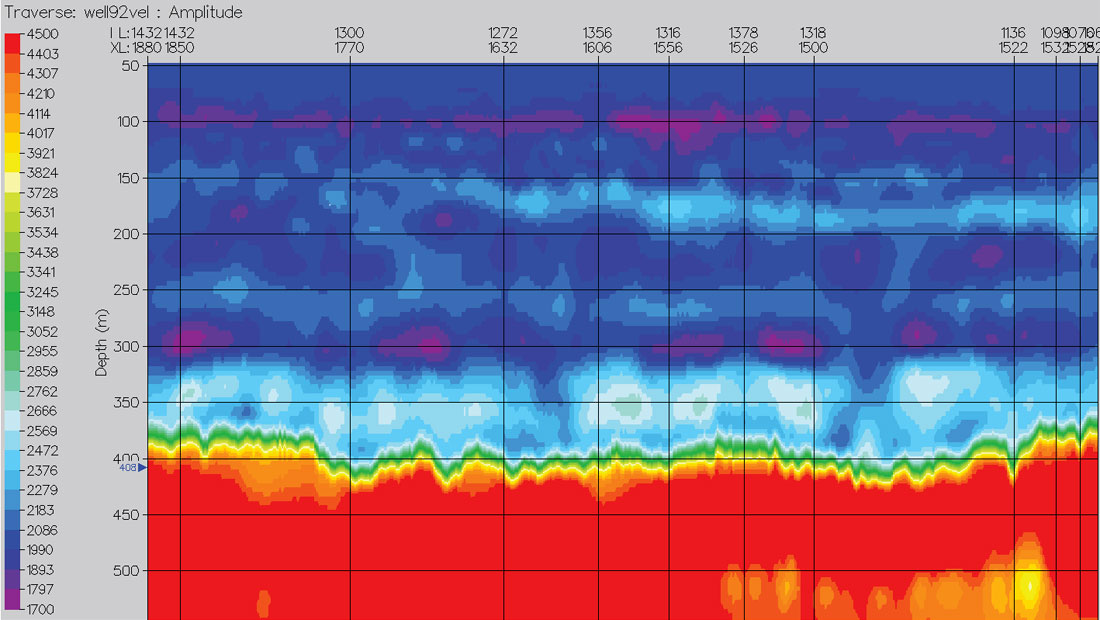
To complicate matters further and this is a concern specific to the project area, the velocity profile is atypical. Specifically, it does not continuously increase as a function of depth but shows strong velocity inversions within the Quaternary, as later delineated by tomographic depth velocity model building and shown in Figure 2. These velocity inversions are likely due to the transport and deposition of faster material by the ice sheets during the periods of glaciation. They will impact both depth imaging and reservoir characterization and would require a patch that is larger than usual.
5D Interpolation
The need for interpolating or regularizing inadequately sampled seismic data to minimize migration artefacts (migration is based on the principle of constructive and destructive interferences) and to preserve amplitudes has been identified a long time ago (Ronen 1987, for instance). It is of particular importance with 3D land surveys as lakes, rivers, setback distances from pipelines, wellheads and other infrastructures will induce holes in the seismic coverage that are difficult to fill in at processing. Various obstacles at surface will alter the regularly sampled acquisition survey geometry (orthogonal, mega-bin, bricks, etc.) and introduce some randomness in source and receiver spacing and source line and receiver line spacing. These perturbations will clearly affect the uniformity of the coverage.
Numerous tools have been developed over the years to try to address the aforementioned issues. Multi-dimensional interpolation of the seismic data (so-called 5D interpolation for 3D datasets) has established itself as one of the most robust. 5D interpolation (Wang 2004, Liu and Sacchi 2004, Trad 2008, Downton et al 2012, Cary 2012, etc.) comes in various flavors as each geophysical contractor has now implemented its proprietary approach, however it is beyond the scope of this paper to discuss their respective strengths and weaknesses. 5D interpolation remains an area of active research both in academia and in the industry as issues such as aliasing continue to be addressed by increasingly sophisticated technology.
For the legacy oil sands data, 5D interpolation offered a potential way of improving the spatial sampling such that pre-stack time migration (PSTM) could be used to provide a higher resolution image. This dataset was processed with a post-stack time migration flow in the past. While PSTM flows were evaluated and brought some limited uplifts, they also introduced a lots of migration artefacts. This process was therefore considered of limited value by the geophysicists and interpreters at that time. The post-stack time processing flows were optimized over the years and became standard for the processing of the monitor surveys (4D).
Because this legacy 3D survey is quite coarse and because we wanted to assess the potential of this dataset for pre-stack imaging and reservoir characterization, we opted for an emulation of a denser seismic data acquisition where both the source and receiver line spacing and the in-line source and receiver spacing would be divided by two. This reduced the CMP bin size to 7.5m by 7.5m. The main goal was to improve the azimuthal coverage and reduce migration artefacts. Small holes were filled in, but larger holes (lakes for example) remained when the gaps between data points were too large to be handled reliably by the interpolator.
Time and Depth Imaging
For the initial part of our analysis, the legacy 3D survey was reprocessed in 2012 with an amplitude friendly multi-azimuth PSTM processing flow. As outlined above the pre-stack data that were input to the migration were 5D interpolated. In the study area, all of the geological layers are extremely shallow. Because the velocity is around 2000m/s in average, there is almost a 1 to 1 equivalence between the time and depth scales. The entire geological section lies within the first 400-450ms of the seismic image. Such a short time window presents considerable challenges at processing, and care was taken to allow the new sequence to provide as much uplift as possible.
When completed, the visual differences between the legacy post-stack and new pre-stack migrated volumes were subtle when comparing individual in-lines and cross-lines, confirming earlier findings. However, differences were more pronounced on time slices and attribute volumes (coherency cubes, etc.). In particular, on the pre-stack time volume, the topography of the Devonian unconformity is much more detailed than on the post-stack volume. This is of primary importance for designing the optimal SAGD horizontal well pairs that will be located just a few meters above it or that will be running through some portion of it.
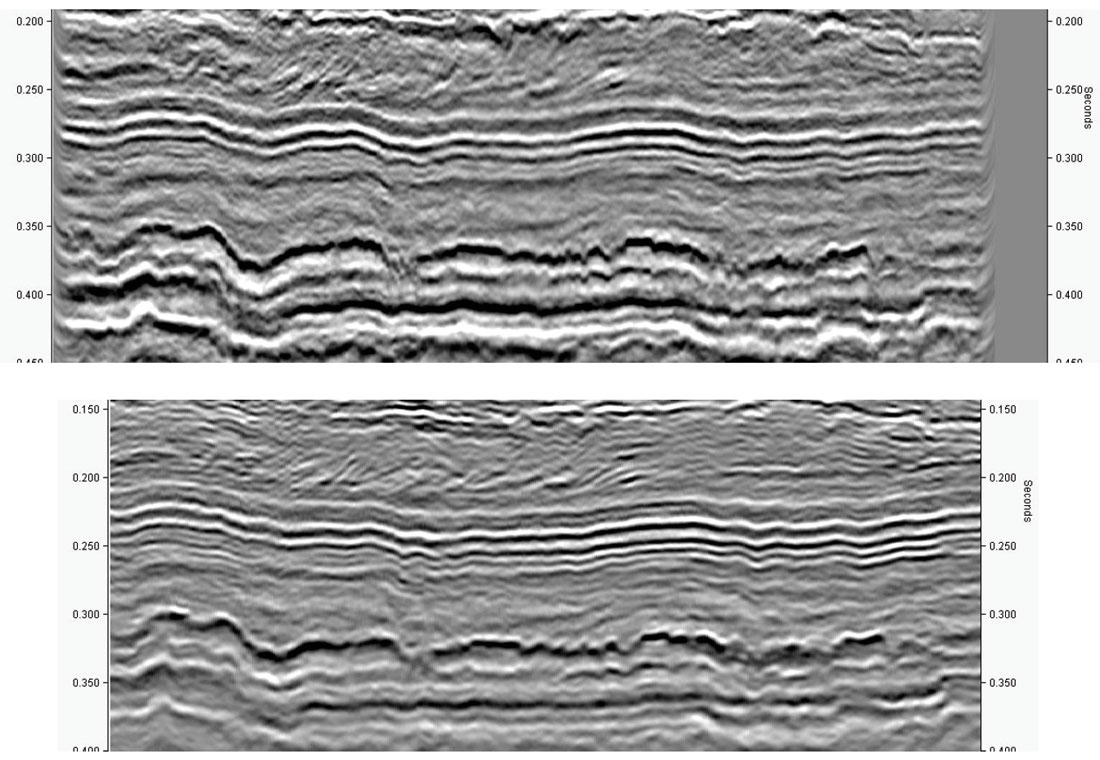
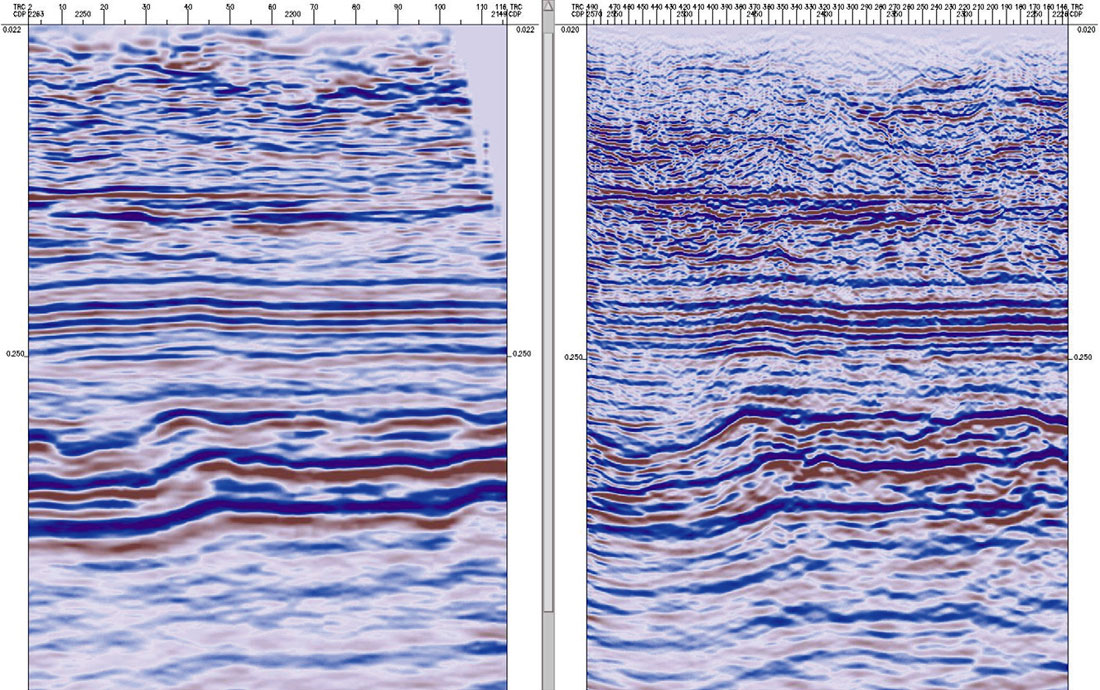
Top – Legacy Time Migration
Bottom – Anisotropic Pre-Stack Depth Migration stretch back to time.
The two sections have a different datum.
To take the work further, a pre-stack depth migrated image (PSDM) was produced, again using a 5D interpolated input. The benefits of the pre-stack depth migration volume over the pre-stack time migration volume were obvious. Not only do the wells tie in depth at the cap rock and at the Devonian unconformity, but the structural positioning and definition was improved. Figures 3 and 4 show clearly the benefit of the reprocessing.
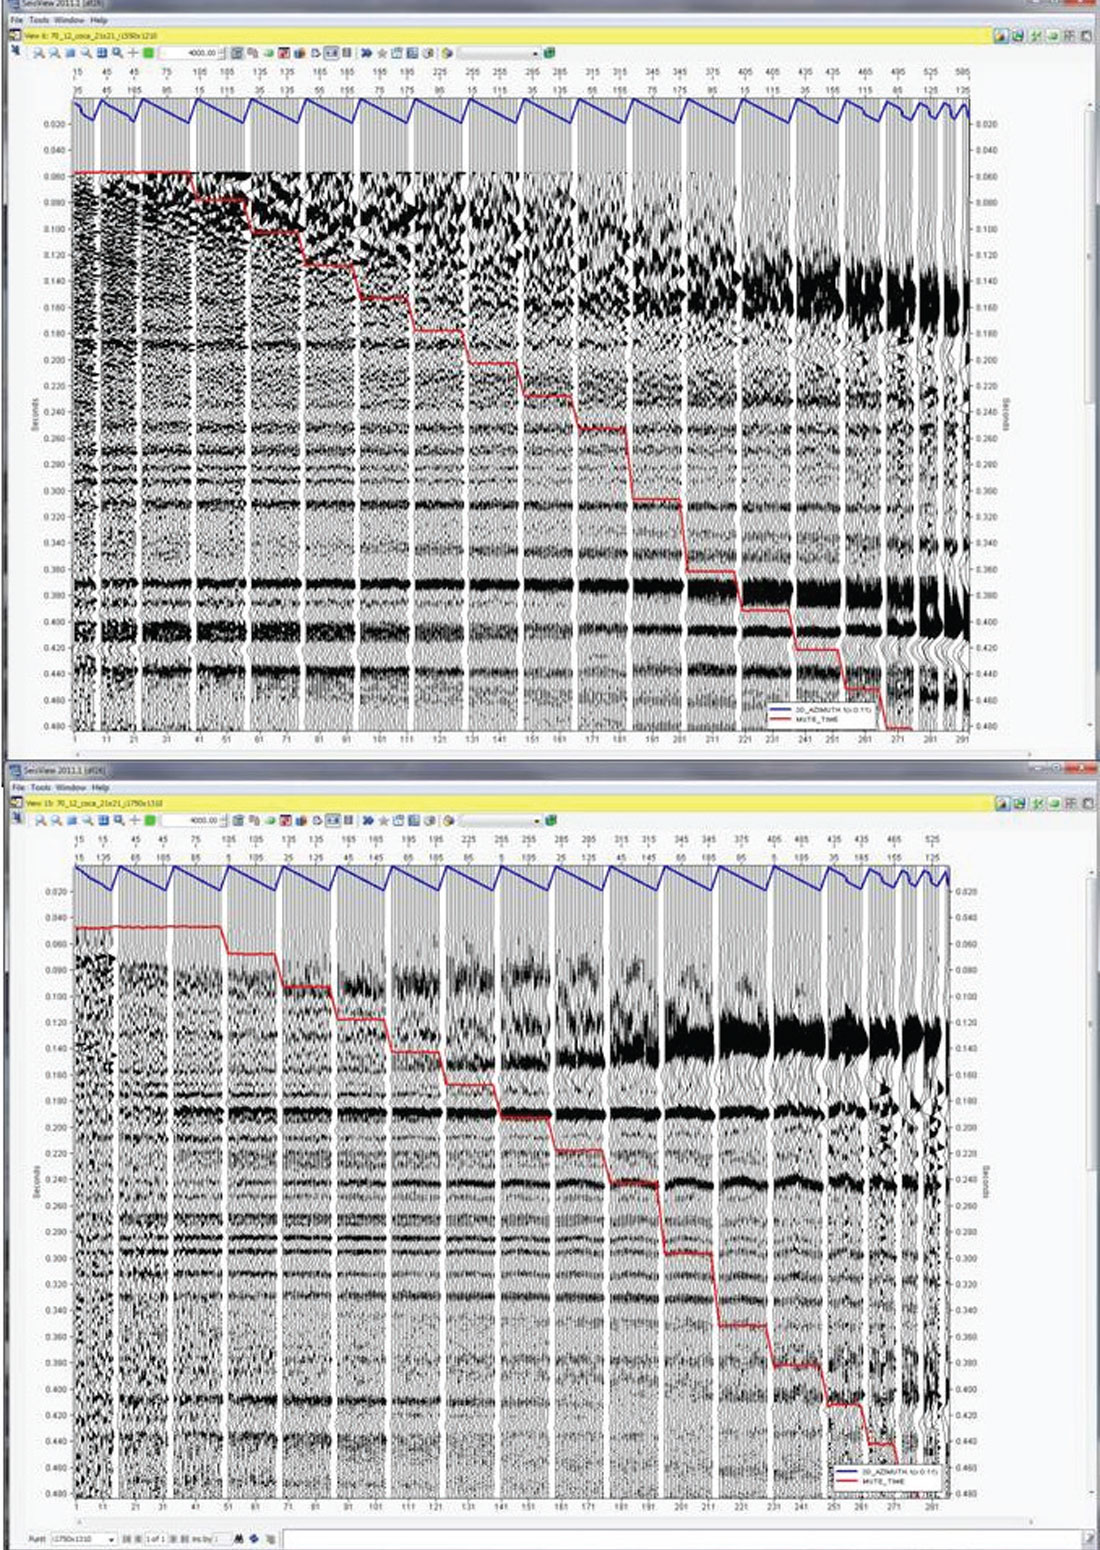
The pre-stack depth migration flow is multi-azimuth and anisotropic, with the data being migrated from the base of the weathering layer as described by Charles et al (2008). As in this paper, an anisotropic model provided better focusing and well ties than with an isotropic model. Because each geological macro layer may be affected by different types of spatially variable anisotropy, evaluating the anisotropic parameters was very difficult for this dataset. Figure 5 shows common-offset common azimuth (COCA) displays for two different areas of the survey – the variation in azimuthal effects is clear. However, it proved impossible with this dataset to dissociate the shallow azimuthal velocity variations within the Quaternary from potential orthorhombic anisotropy effects. The fold was just too low in the upper part of the Quaternary section. As a result, we limited the anisotropy symmetry to tilted transverse isotropy. Imaging differences in the individual azimuthal volumes showed that the data were affected by both illumination issues and azimuthal variations. Additional azimuthal corrections were therefore applied to the individual azimuthal volumes in using a non-rigid matching technique prior to stacking.
We concluded that the anisotropic pre-stack depth migration volume provided the best answer in terms of resolution and data conditioning, confirming common knowledge. Pre-stack depth migration gathers were therefore used in reservoir characterization in subsequent work.
High resolution 2D test lines
While the reprocessing efforts on the 3D dataset using 5D interpolation, PSTM and A-PSDM, had yielded significant improvements over the legacy product, it was felt that the resulting image still lacked the resolution necessary to optimize the SAGD production of the area. In particular the Quaternary lacked detail, and the Devonian surface still showed evidence of smearing.
To test this hypothesis, several high effort and high resolution 2D lines were acquired in the project area to assess the Earth response, and determine what acquisition parameters would be required to achieve the desired imaging results. Two 2D Walkaway VSPs were also acquired to get an estimate of attenuation and anisotropy as well as to locate multiples and converted modes. For all of these lines, the source and receiver spacing are both 5m, with sources located at the receiver midpoints. All receivers were single 3C analog geophones. Some lines were shot live three times, with source depths of 6m, 9m, and 12m. Test shots were fired at both ends of one line with varying charge size and depths. Examples are shown in Figure 6.
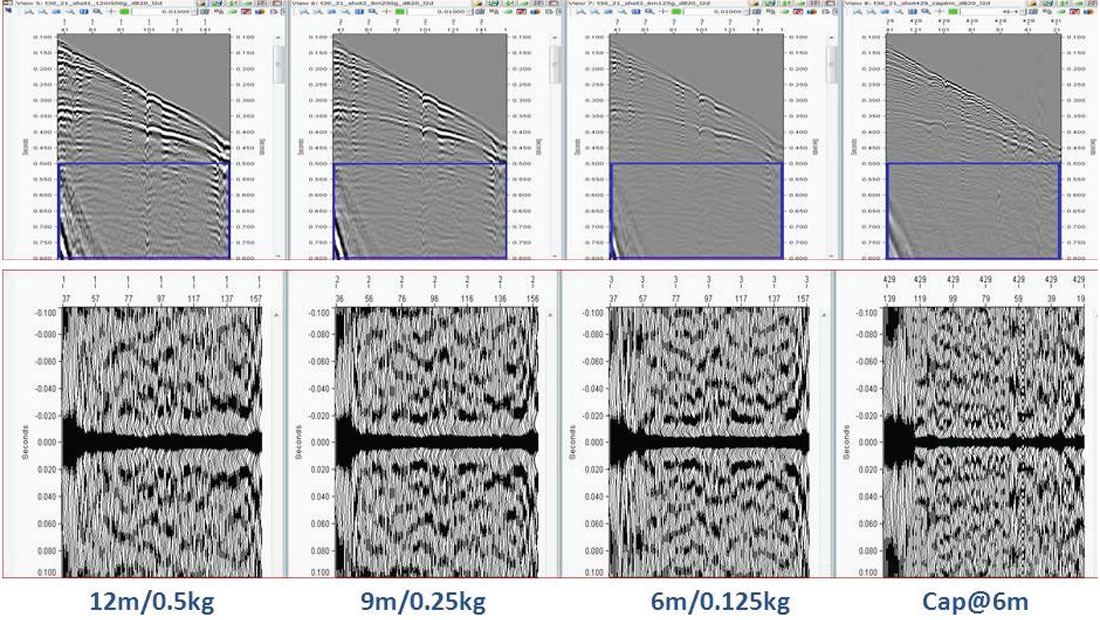
Comparing shot records, spectra and the stack sections in particular, 1/8kg at 6m was considered to be the best source for these lines. As expected, increasing the charge size shifted the dominant frequency of the source wavelet towards the lower end of the spectrum (Figure 6). Although a higher frequency source-ghost notch is more desirable, there is a trade-off between reducing the effect of the source ghost (i.e. by decreasing the hole depth) and the amount of the source generated noise (ground-roll, air-waves, etc.) that we will be found in the shot records while minimizing the risk of blowouts. The frequency notch due to the source ghost is at about 125Hz for the 6m shot points, at about 95Hz for the 9m shot points, and at about 80Hz for the 12m ones.
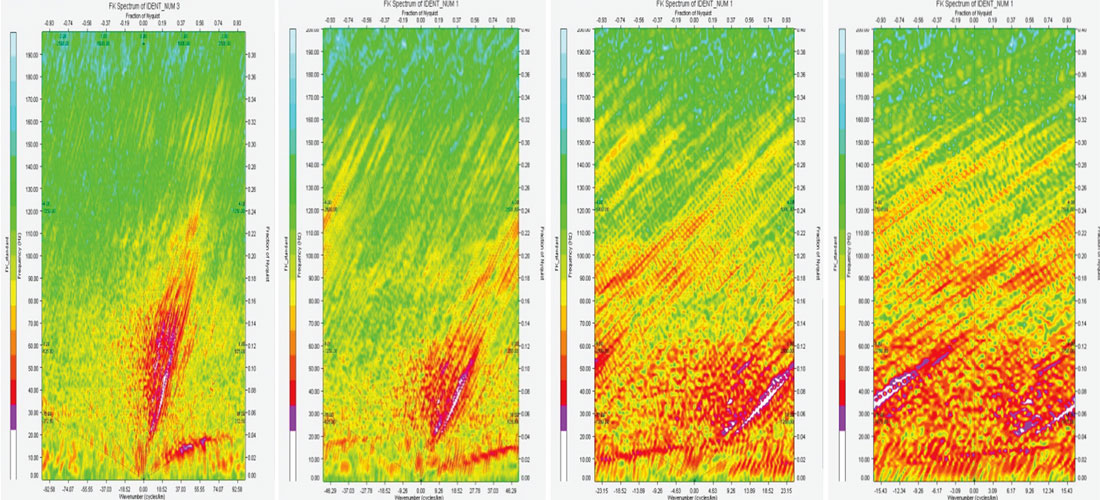
F-K spectra (Figure 7) illustrate aliasing wraparounds of the most powerful events for Figure 6. 2D source tests and autocorrelations from a deep time window. different receiver spacing. There is almost no aliasing for a receiver spacing of 5m, some mild aliasing for a receiver spacing of 10m and a fair amount of aliasing wraparound for the receiver spacing of 20m and 30m.
While the 5D interpolation and PSTM / A-PSDM work had yielded some imaging improvements, the high resolution 2D proved to be spectacularly better, confirming the suspicion that 5D interpolation and depth imaging on the existing dataset fell short of the potential for seismic to provide detailed images for SAGD production. Figures 8 and 9 compare two different 2D lines (L1 and L2) with both the legacy 3D and the new PSTM 3D respectively.
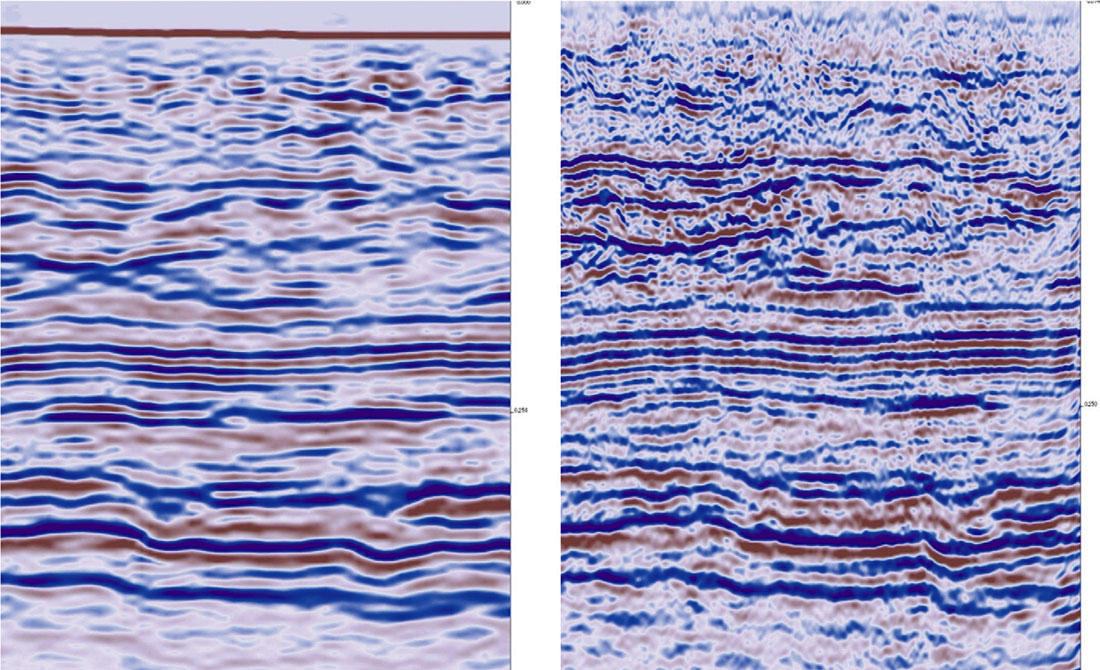
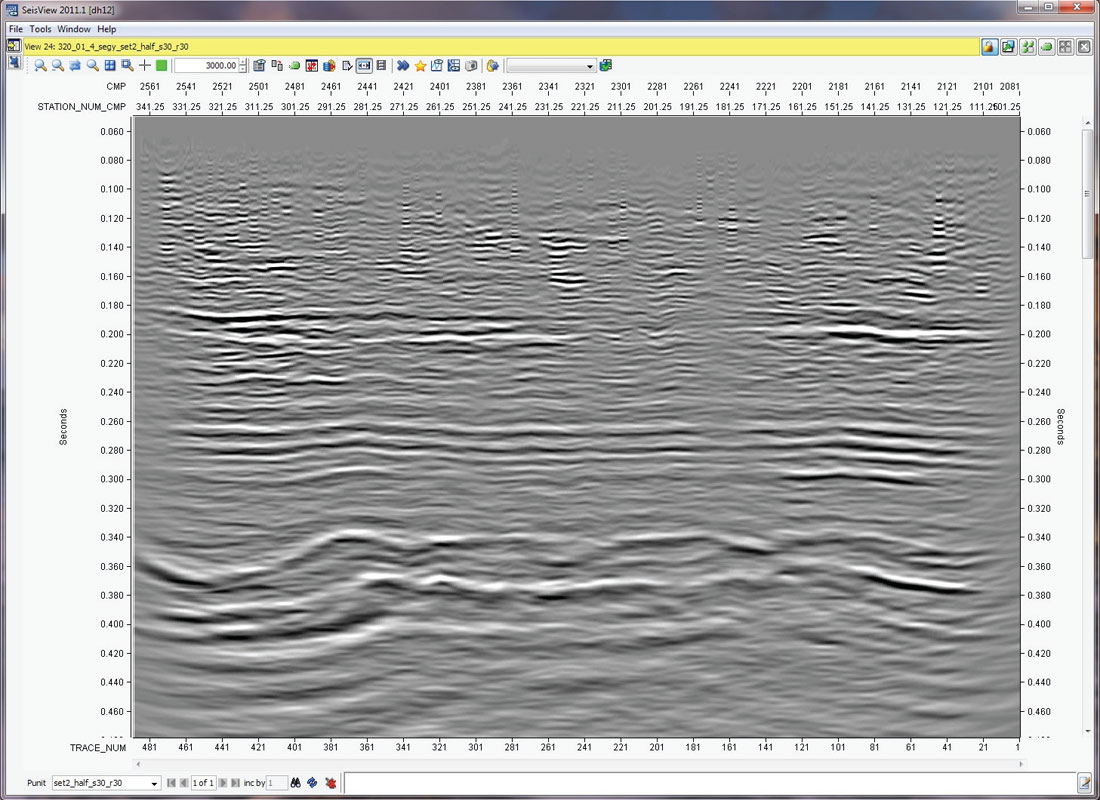
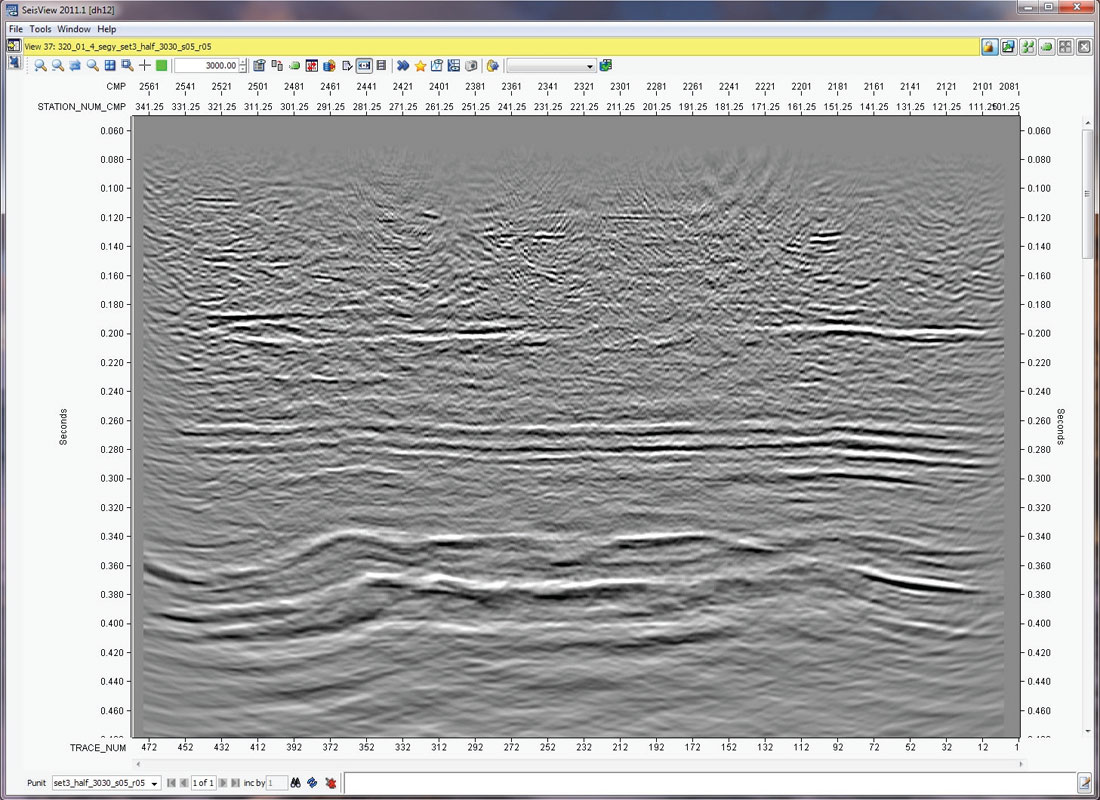
Since the legacy 3D and the high resolution 2D lines have almost identical source and geophone characteristics, with the processing flows being very similar, the improvement in seismic resolution that we see can only be due to the increase in surface sampling. To test this further, decimation was used to assess the degradation of the 2D seismic image as the source and receiver spacing increases. Different decimation combinations were compared: 5m x 5m versus 10m x 10m, 20m x 20m and 30m x 30m (Figures 10-13). Source only decimation results were also derived: 5m x 5m versus 10m x 5m, 20m x 5m and 30m x 5m. It should be noted that no effort was made to process each combination from scratch – while this is likely to result in slightly improved images with, for example, the removal of some low frequency migration artifacts, the spatial resolution losses would remain.
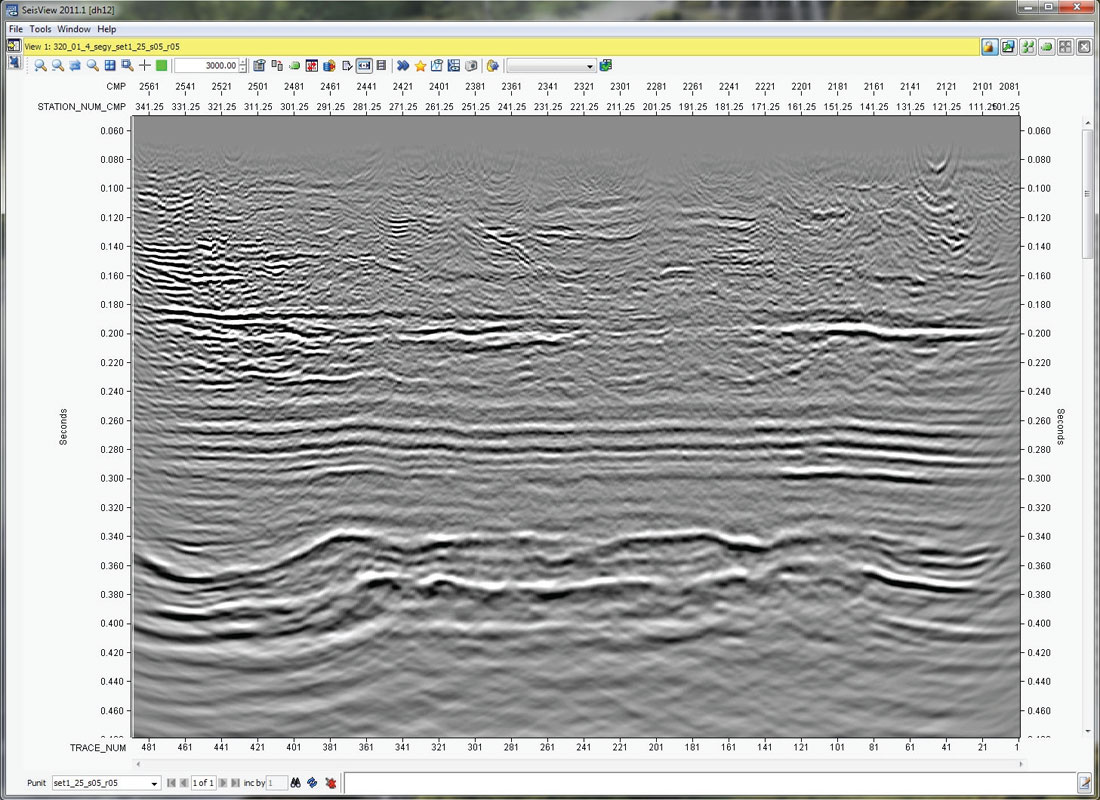

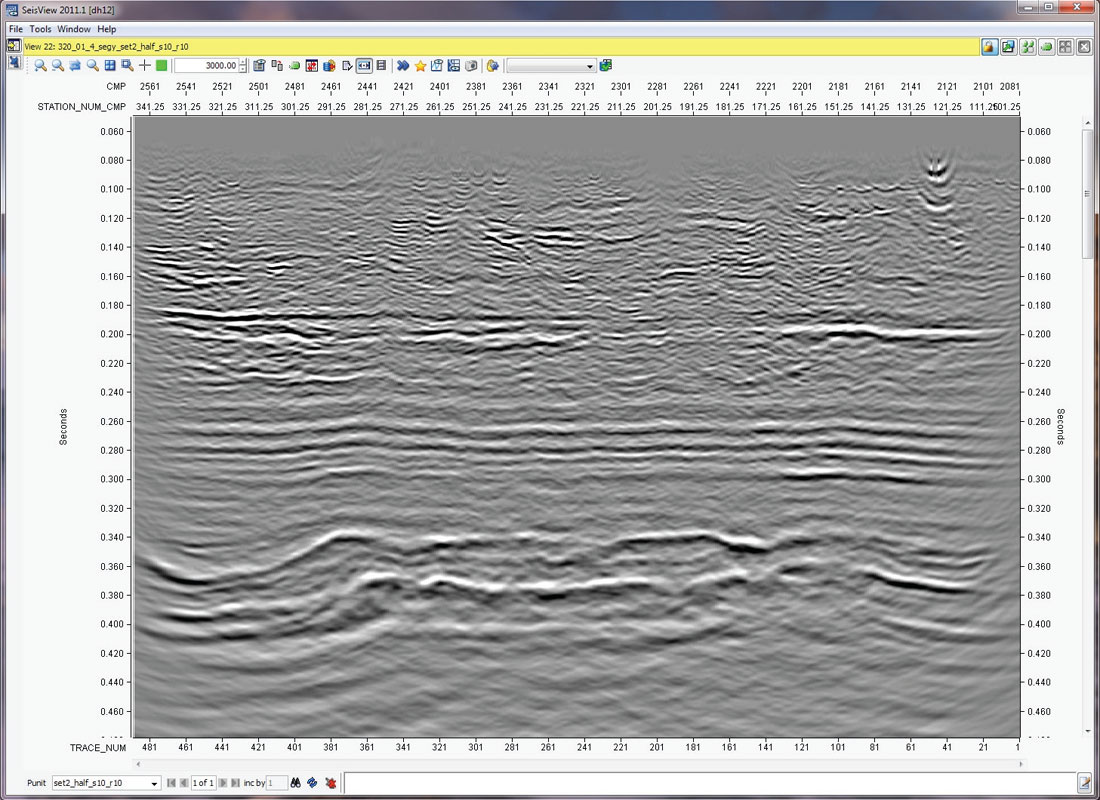
As expected, when the 2D source and receiver spacing were both 30m (Figure 13), the resolution deteriorated to produce an image that is similar to the legacy 3D. Even the 30m x 5m combination (Figure 14) clearly shows a deterioration of the illumination of the Devonian unconformity in particular, the caprock as well as in the shallow part of the Quaternary, compared to the original full resolution image.
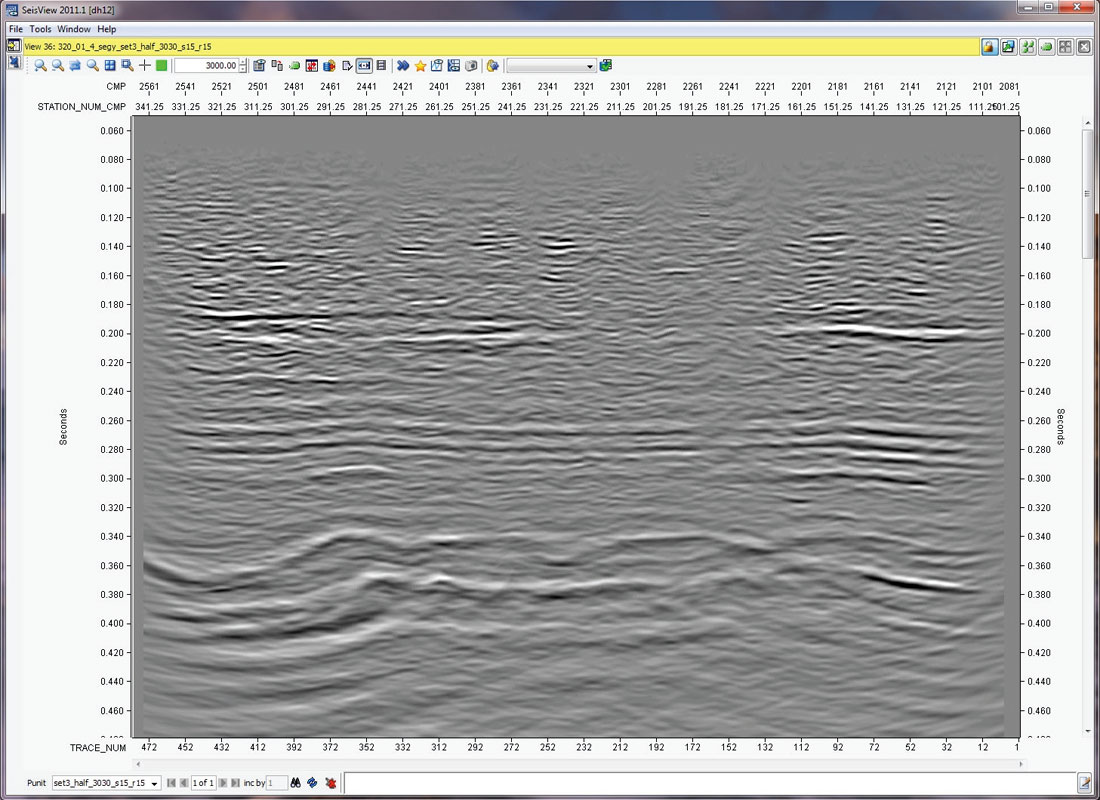
As a final test the decimated 2D datasets were 5D interpolated back to the original geometry to assess how well the process could recover the missing data. Figure 15 shows the most extreme case, from the 30m x 30m decimation back to 5m x 5m. Comparing this with Figure 10, the original 2D image, clearly shows the limitations of the method, even with the latest anti-aliasing algorithms. The missing information, in particular the heterogeneities in the subsurface, result in an image notably poorer than that produced from real high resolution seismic. This is consistent with the result seen from running 5D interpolation on the 3D legacy data.
Although 5D interpolation is a very useful tool to interpolate un-aliased 3D data, regularize the seismic data coverage and reduce migration artifacts (Trad 2009, Downton et al 2012, Cary 2012), it is clearly not a substitute for high density, high resolution, seismic data acquisition in this geological setting. It is simply not possible to obtain, or even come close to, the imaging quality of the high resolution 2D lines using current processing technology on the existing sparse 3D acquisition data. New 3D acquisition parameters were proposed by Charles et al in 2013.
The 2D converted wave data has proven problematical in this area, and work is continuing on understanding the results. The PS section, scaled to the PP section, is of much lower spatial and temporal resolution. The existence and location of the conversion points varies along the reflectors making the registration and statics estimation challenging. Attenuation on the S-waves was clearly visible but difficult to compensate for. We concluded that the requirement for acquiring adequately sampled 3C data at the study area would be extremely costly and leave an unacceptable environmental footprint. While a joint inversion of PP/PS data to recover the density parameter more accurately is highly desirable, it may just not be possible within the project area.
Conclusions
Despite such a short time window, anisotropic pre-stack depth migration provided substantial imaging improvements over pre-stack and post-stack time imaging. Strong azimuthal variations were observed at far offsets but a much denser data set would be required to dissociate azimuthal anisotropy effects from shallow velocity variations. Nevertheless even tilted transverse isotropy (TTI) improved the results over the one derived with an isotropic model.
For this project area, we have established that 5D interpolation used as a regularization tool was beneficial as it improved the azimuthal coverage, data conditioning and reduced migration artefacts, enabling pre-stack imaging. However, both the decimation and interpolation test of the 2D data, and the comparison of the interpolated 3D data to the high resolution 2D data, demonstrated that there is no magic from 5D interpolation. Interpolation simply cannot correctly recover the heterogeneities in the subsurface when they have been insufficiently illuminated by poor spatial sampling. With the current processing technology, 5D interpolation is not a substitute for high density, high resolution seismic data acquisition in the project area.

Acknowledgements
We would like to thank the following people and organizations: Suncor Energy Inc. for the permission to publish these results, all of those at Schlumberger Geosolutions who helped with this project, Josef Heim in particular, Peter Vermeulen and Andres Altosaar for their geological insights, and Eileen Charles, Michael Webb, Graham McFarlane, Karen Primrose and Mike Perz for reviewing and improving this paper.
Disclaimer
Suncor Energy Inc. and its affiliates (collectively "Suncor") do not make any express or implied representations or warranties as to the accuracy, timeliness or completeness of the statements, information, data and content contained in this presentation and any materials or information (written or otherwise) provided in conjunction with this presentation (collectively, the "Information"). The Information has been prepared solely for informational purposes only and should not be relied upon.


Join the Conversation
Interested in starting, or contributing to a conversation about an article or issue of the RECORDER? Join our CSEG LinkedIn Group.
Share This Article