Introduction
Aeromagnetic surveys provide important information on geologic features and enable low-cost regional coverage. For these reasons, magnetic maps often serve as primary regional information on the resource potential in large areas.
Regional public-domain aeromagnetic data have long been available for most of Alberta, but there have been gaps in coverage and the data quality and resolution have been uneven and sometimes low. New regional airborne total magnetic intensity (TMI) data were recently acquired for the Alberta Energy Regulator/Alberta Geological Survey (AER/AGS) in two large areas of northern Alberta, where the public-domain aeromagnetic data were too sparse or too low-quality for modern exploration, or where such data did not exist at all.
One area is Alberta’s portion of the Canadian Shield, where the new regional aeromagnetic data are needed to identify and delineate geologic features and thus to better understand Alberta’s geology and resource potential. In north-central Alberta, a large gap in the public-domain aeromagnetic coverage has now been filled almost entirely.
Flights were conducted in February and March 2021 by EON Geosciences Inc., and data processing was performed by both EON and Geo Data Solutions GDS Inc. A total of 91,775 line-kilometers of new data were flown with three fixed-wing aircraft.
Details and parameters of these two regional surveys, along with map images of the new data, are presented here. Survey results are available on the AGS website (ags.aer.ca) as a data layer in the Alberta Interactive Minerals Map interactive GIS map application. Existence of such modern public-domain data might smooth the way for detailed mineral and hydrocarbon exploration by private investors.
Utility of Magnetic Data in Geological Mapping and Resource Exploration in Alberta
Magnetic and gravity surveys make it possible to reconnoiter large areas at a low cost compared to seismic reflection data. Lacking a controlled source, these geophysical methods are environmentally benign, and air operations do not significantly disrupt human activities and wildlife habitats on the ground. The aeromagnetic method was chosen for its proven utility as a big assist to geological mapping in both mineral and hydrocarbon exploration.
The rock property that links magnetic anomalies to rock composition is total magnetization. Unlike density, which is scalar, total magnetization is a vector sum of a bewildering variety of many dissimilar types of rock magnetization, which could be primary and secondary, remanent and induced. To separate out these various magnetization types in a rock sample is not always easy, and low reliability of the results has contributed, for example, to the deceptive conclusions drawn sometimes from paleomagnetic studies in tectonics.
Magnetization depends on the rocks’ composition, as well as their current state and their entire previous geologic history. Magnetic anomaly sources can reside at various levels in the continental crust that are cooler than the Curie isotherm: any hotter and deeper, and the rocks lose their magnetization. Shallow sources can produce sharp (short-wavelength) magnetic anomalies, whereas anomalies from deep sources tend to be broad and smeared (long-wavelength). The specific minerals that carry magnetization, such as iron oxides and sulfides, can appear in the rocks in very small amounts, and their distribution might have little connection to the overall lithology. Because the magnetic field is typically non-vertical and dipolar, even a simple rock-made anomaly source can deceptively produce an anomaly pair: a high on one side and a low on the other.
In the pericratonic Alberta Basin, magnetic data have been used to delineate fault and fracture networks in the Precambrian crystalline basement since the early days of oil exploration (e.g., Garland and Bower, 1959; Lyatsky et al., 2005). These faults and fractures had many direct and indirect influences on the patterns of deposition, erosion, compaction, organic maturation, and alteration in the Phanerozoic sedimentary cover, as well as on the distribution of oil and gas source rocks, migration routes, reservoirs and traps.
In the Canadian Shield, including in Alberta, magnetic anomalies can reveal the metamorphic and igneous rocks’ geologic grain, which is commonly ductile in origin. Anomalies can also indicate variations in rock composition, metamorphic patterns, concentrations of magnetic minerals, and structural deformation including sharp discontinuities due to brittle faults (Langenberg and Nielsen, 1982; Langenberg, 1983; Goff et al., 1986; Sprenke et al., 1986; Langenberg and Eccles, 1996; Lyatsky, 2010). Regional magnetic maps can thus provide useful reconnaissance for mineral exploration.
Recent years have seen the acquisition of public-domain, modern aeromagnetic and gravity data in the Athabasca Basin in northern Alberta and Saskatchewan. An updated regional geologic map of Precambrian rocks in northeastern Alberta was published by Pana (2010). Our new aeromagnetic survey builds on and adds to that ongoing, multidisciplinary effort.
Survey Design
The AGS identified two priority survey areas from the perspective of improving our understanding of the geology and resource potential of two regions:
- the Alberta portion of the Canadian Shield, and
- the large aeromagnetic data gap in north-central Alberta, in the Alberta Basin.
Depth to the crystalline basement in north-central Alberta is on the order of hundreds of meters, and it increases considerably from NE to SW. Intra-sedimentary sources of magnetic anomalies occur sporadically in the Alberta Basin, related to occurrences of igneous rocks and intra-formational primary or secondary magnetic minerals. However, previous AGS geologic mapping and magnetic interpretations, plus the decades of oil-industry experience (e.g., Lyatsky et al., 2005), show that intra-sedimentary anomaly sources in the Alberta Basin are typically small and local. Basement-sourced anomalies were therefore deemed to be of primary interest in this regional work.
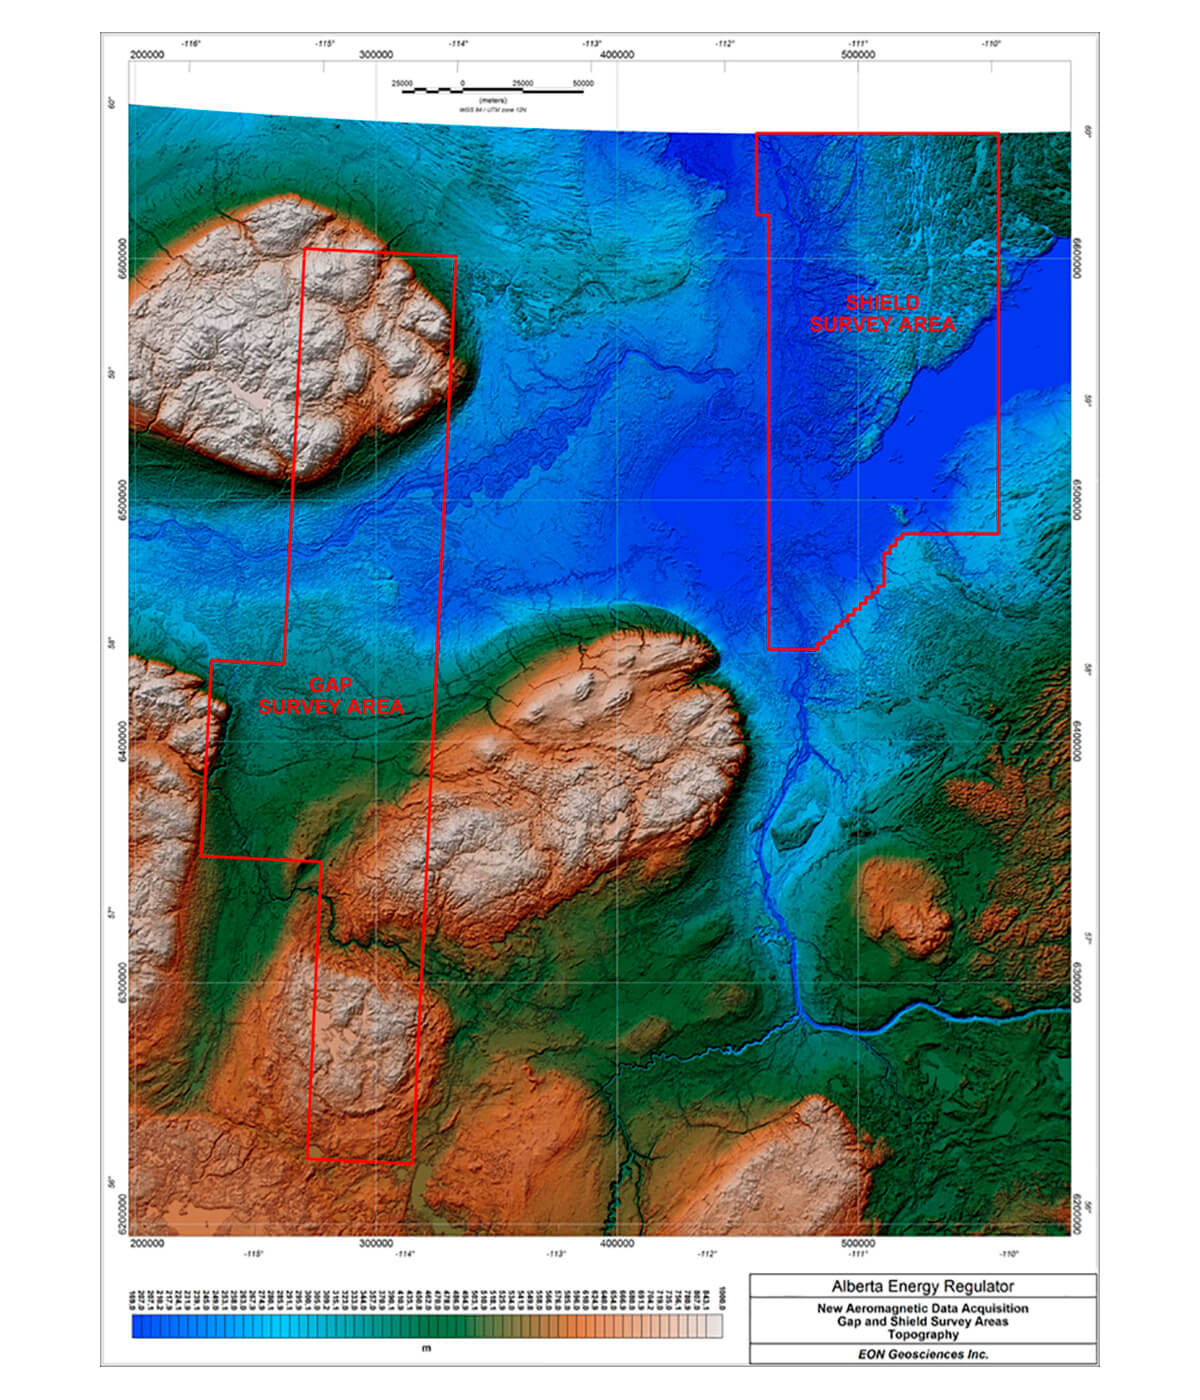
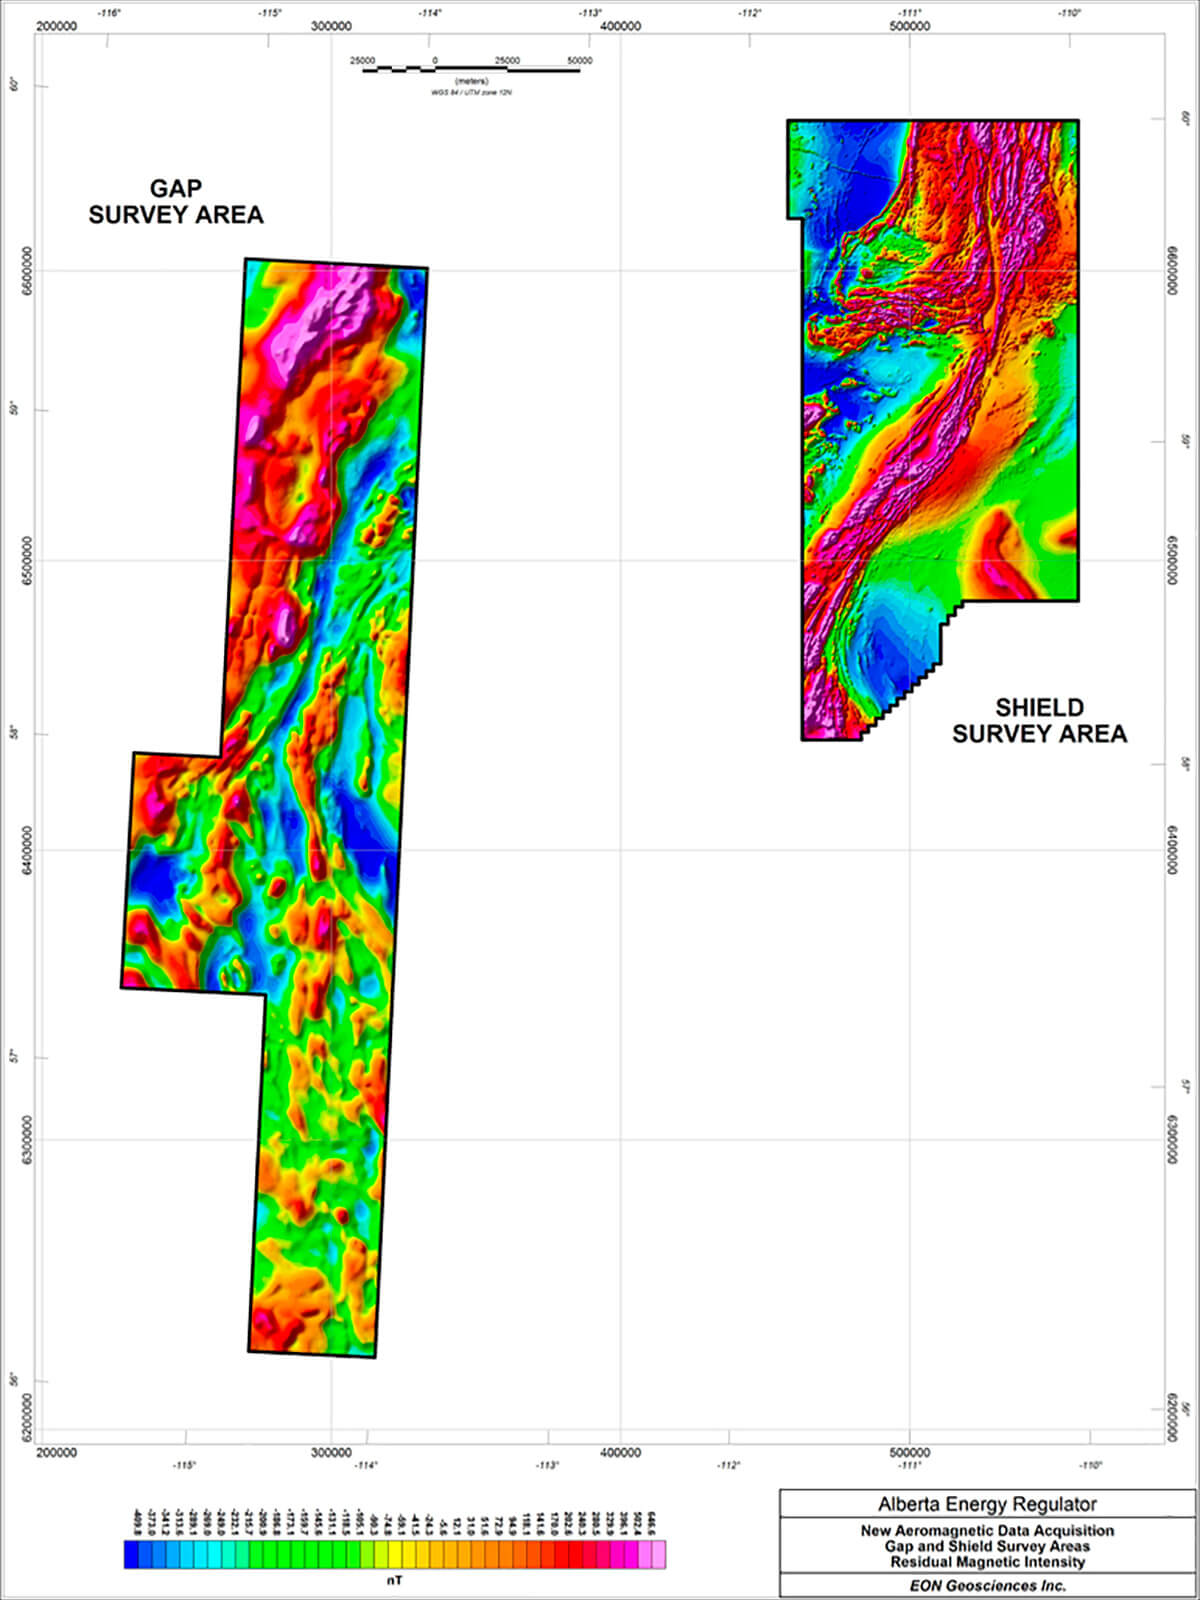
Data were acquired over the Gap survey area (north-central Alberta) at an 800 m line spacing with tie lines at 2,500 m. A terrain clearance of 200 m was chosen to avoid aliasing of short-wavelength anomalies along flight lines and to avoid risks associated with low-altitude flight over rugged terrain (Fig. 1). At a quarter of the flight-line spacing, this altitude is also consistent with conventional data-acquisition practices.
Sources of magnetic anomalies are much closer to the surface in the Canadian Shield, where the mostly non-magnetic sedimentary cover is lacking. With its comparatively shallow geologic targets, mineral exploration calls for the most detailed possible magnetic surveys. The topography in the Alberta part of the Shield is much smoother than in the Gap block. The flight-line spacing was set at a relatively tight 400 m, with a 100-m terrain clearance and a 2,500-m tie-line spacing.
The grain of regional magnetic anomalies in both survey areas varies considerably, but it is largely N-S. Despite the added cost and survey time due to extra aircraft ferry and turnarounds, a decision was made to fly both surveys E-W to obtain the best possible delineation of anomalies.
Field Operations
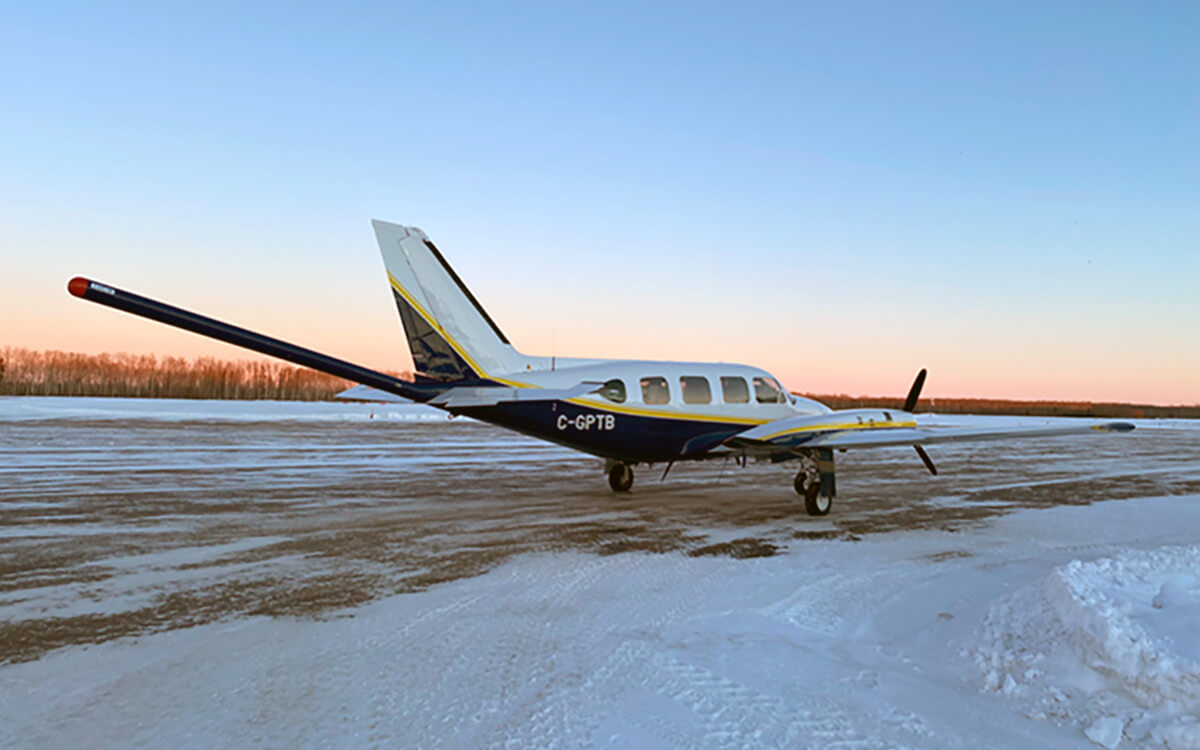
The deep, prolonged cold snap in February 2021, which broke cold records all over the continent, delayed production flying because the aircraft and on-board equipment are not rated to operate below certain temperatures. The winter storms also caused low visibility and low ceilings. Still, mobilization and some of the flight testing of the planes (Fig. 2) proceeded on schedule. After that, the meteorological weather was largely favorable.
Unstable space weather can cause the magnetic diurnals to be active enough to make data acquisition impossible. When the ambient magnetic field is changing rapidly as the solar wind interacts with the Earth’s magnetosphere, aeromagnetic data cannot be recorded reliably.
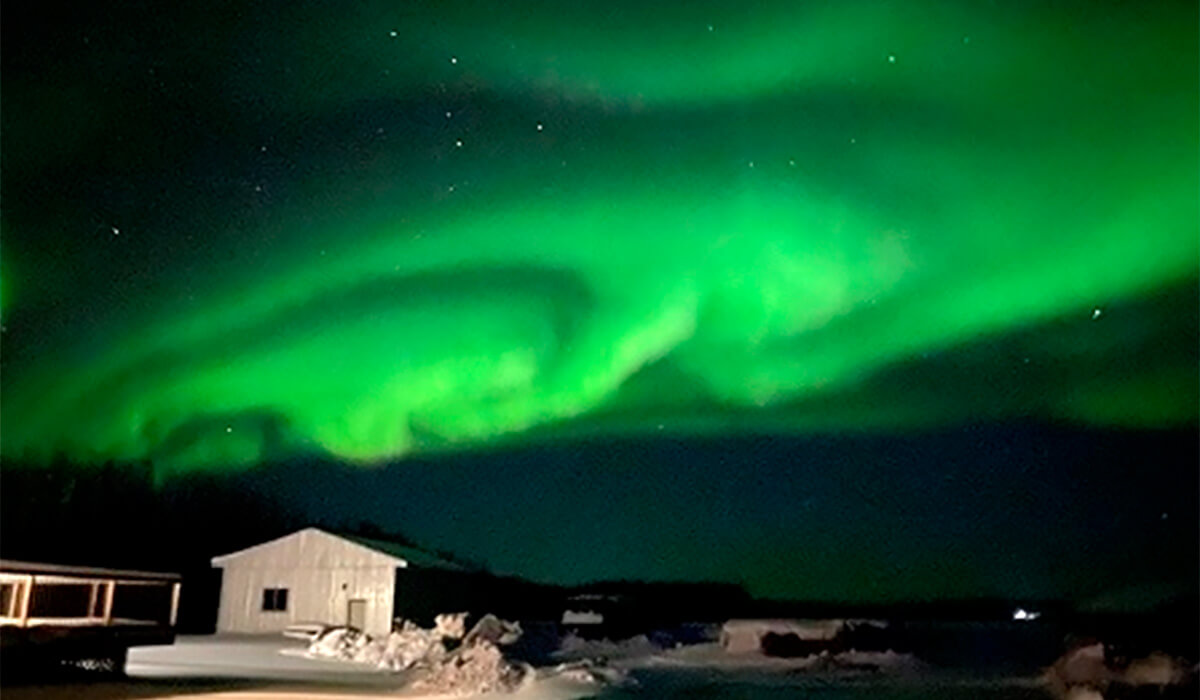
Active magnetic diurnals did cause delays (as well as some impressive night-time auroras: Fig. 3) in the early stages of the survey. The weeks around the spring and fall equinoxes tend to be associated with especially active magnetic diurnals, possibly because the ionospheric convection is stronger and the cross-polar cap potential, which is the total variation in the resulting ionospheric electric potential, is greater near the equinoxes (Cnossen et al., 2012; Shepherd et al., 2002). Besides, magnetic diurnals tend to be strong in the winter months. The magnetic weather is also commonly especially active at high latitudes, where both survey areas lie.
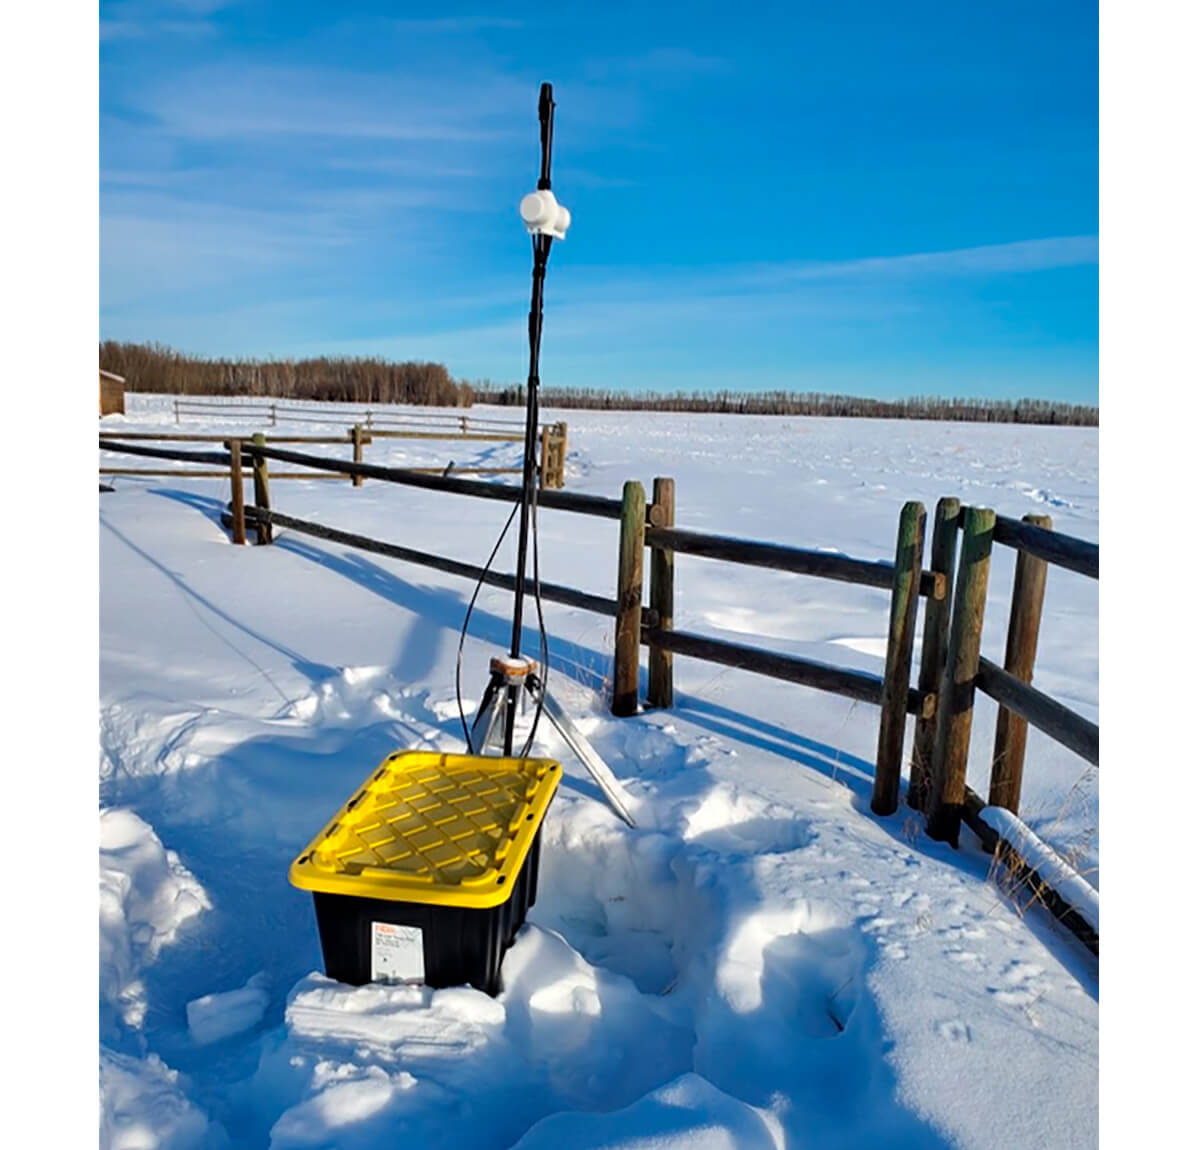
To monitor and record the magnetic diurnals, ground magnetometers were deployed at both bases of operations (Fig. 4) at localities as free as possible from magnetic noise and human disturbance. Two ground instruments were deployed at each locality to provide backup in case one failed and to make it possible to identify blips of man-made (“cultural”) origin. For example, a person walking near the instruments with metal objects might cause similar blips in both instruments but several seconds or minutes apart. When the magnetic diurnals exceeded the contract-specified tolerance, production flying was suspended until the conditions improved, and data inadvertently recorded during the above-tolerance diurnals were re-flown. The recorded diurnals were subtracted from the aeromagnetic data during processing.
Data were also re-flown if the aircraft deviated too much from the contract-specified flight paths, either vertically or laterally.
Data Processing
The newly recorded data were immediately processed to remove magnetic diurnals even while the rest of the flying was continuing. Geosoft software, which is very common in potential-fields work, was used at all stages of data handling.
The most elaborate processing steps were to level and de-glitch the recorded data, which required time-consuming experimentation and meticulous attention by the processors. For the best delineation of local anomalies, the International Geomagnetic Reference Field (IGRF) was removed from the data, and the gridded data were prepared for anomaly enhancement. Because the Earth’s magnetic field has been changing very fast in recent years, care was taken to use the most up-to-date IGRF.
The list of deliverables is provided in Table 1. The main purpose of such data processing was to enhance small and subtle anomalies that could be of exploration significance, such as anomalies related to local mineralization or brittle faults and fractures.
| Gap survey area, Final Digital Data | ||
|---|---|---|
| Product | Data | Format and projection |
| Table 1. List of derivative maps generated for the Gap and Shield survey areas (source: EON). The following final digitial data were delivered to the AER. | ||
| Database | Final processed survey data | Geosoft GDB, WGS-84 and ASCII XYZ |
| Grid | Total magnetic intensity (TMI) | Geosoft GRD, WGS-84 and ASCII GXF |
| Residual magnetic intensity (RMI) | Geosoft GRD, WGS-84 and ASCII GXF | |
| Residual 3rd order trend removal (RES_3trdRemoval) | Geosoft GRD, WGS-84 and ASCII GXF | |
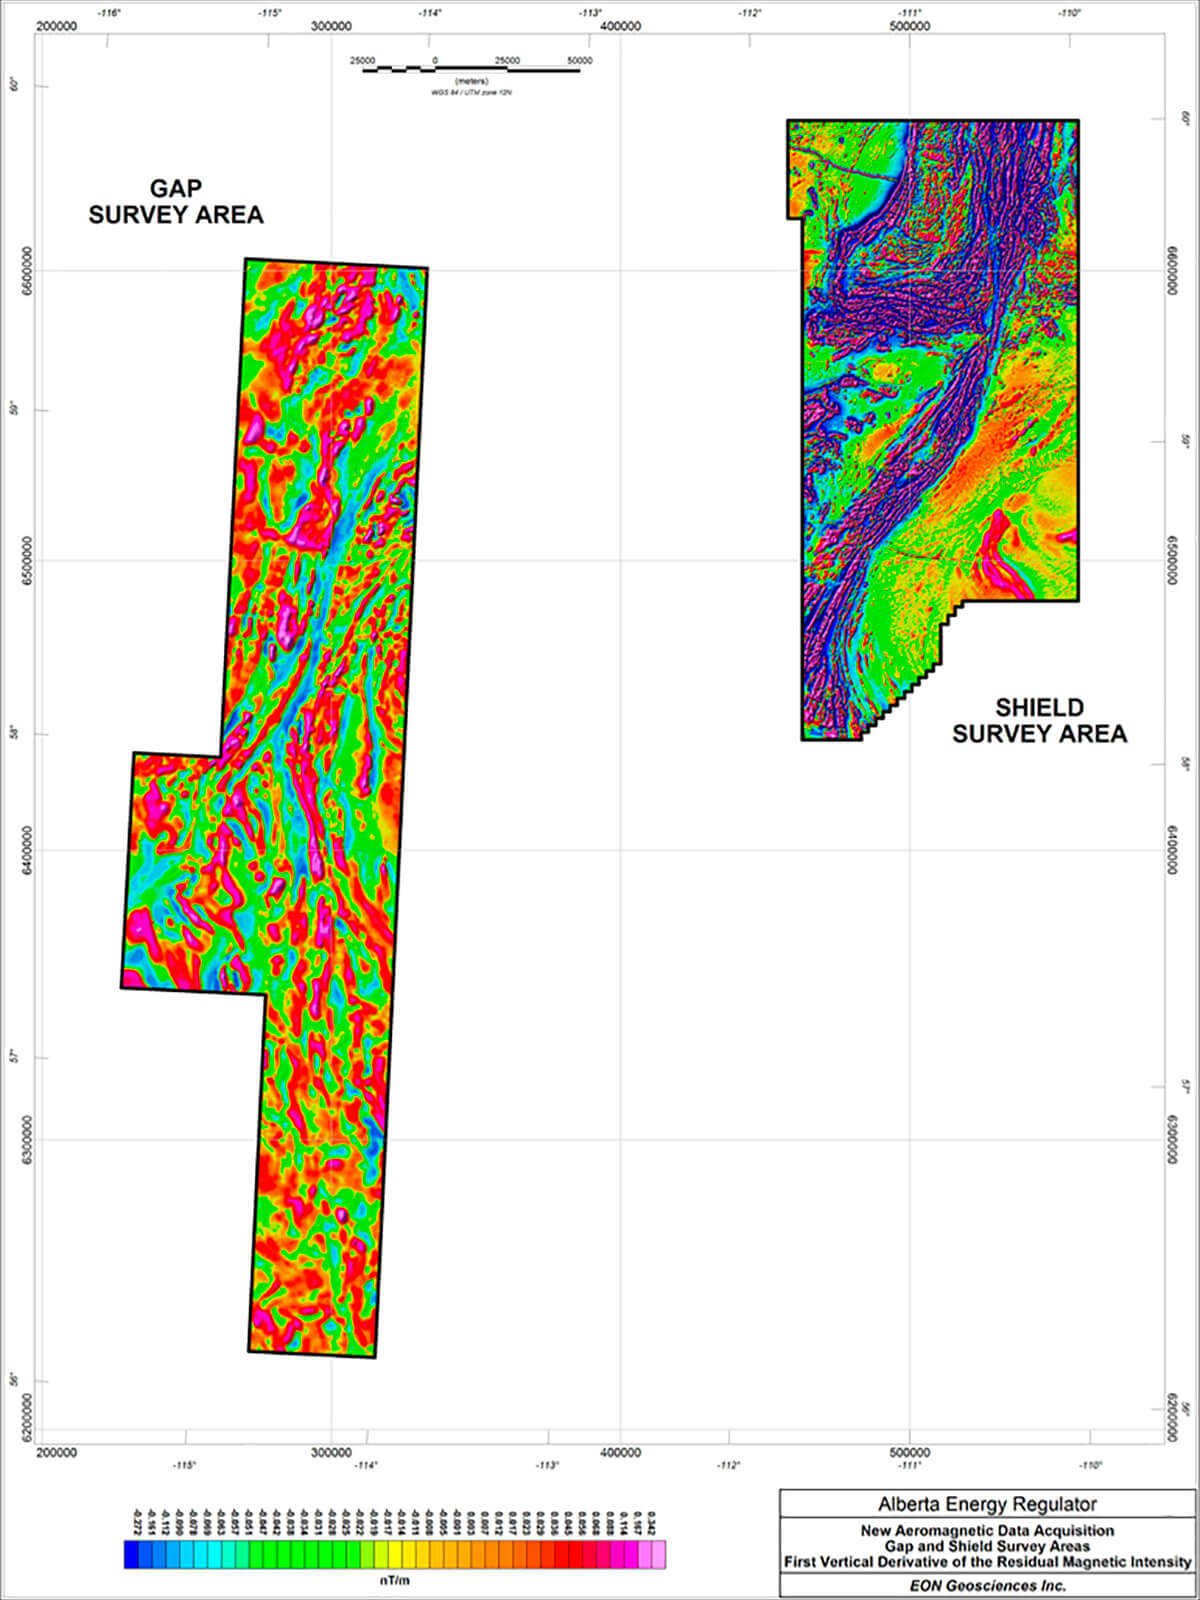
| 1st vertical derivative (VrGrad1) | Geosoft GRD, WGS-84 and ASCII GXF | |
| 2nd vertical derivative (VrGrad2) | Geosoft GRD, WGS-84 and ASCII GXF | |
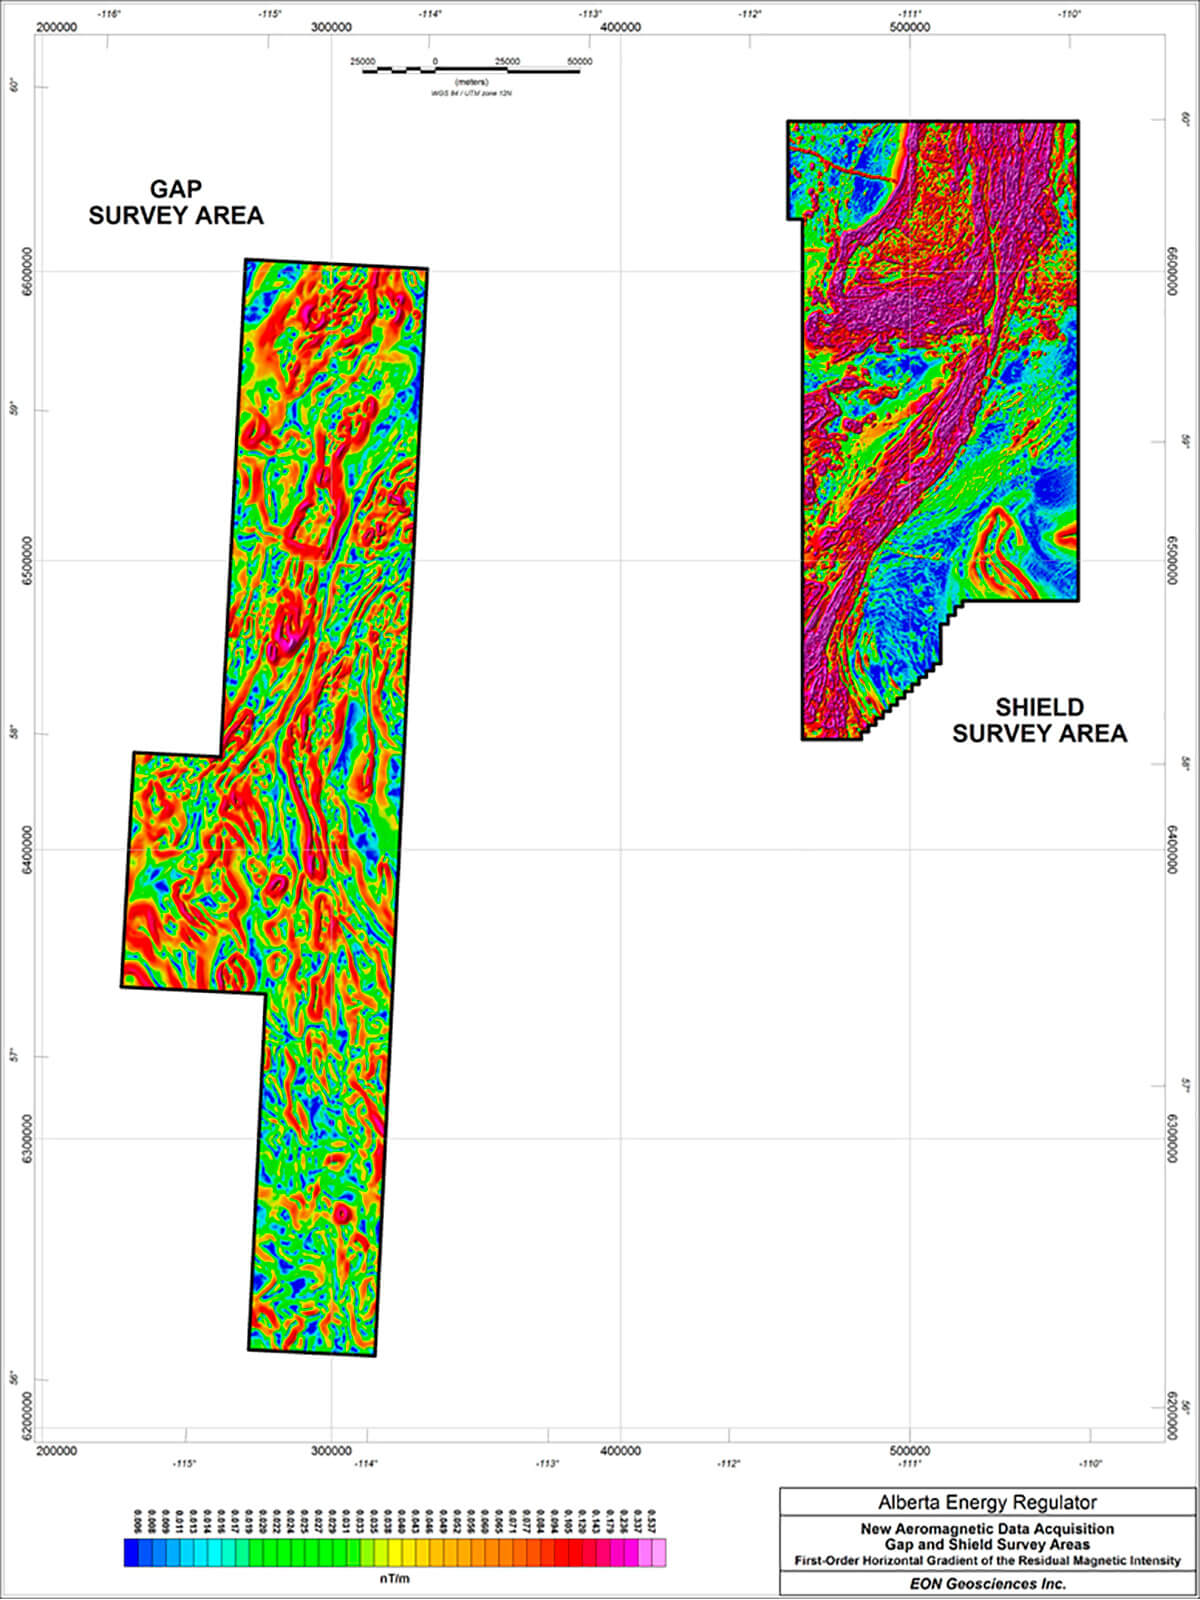
| 1st horizontal derivative (HzGrad1) | Geosoft GRD, WGS-84 and ASCII GXF | |
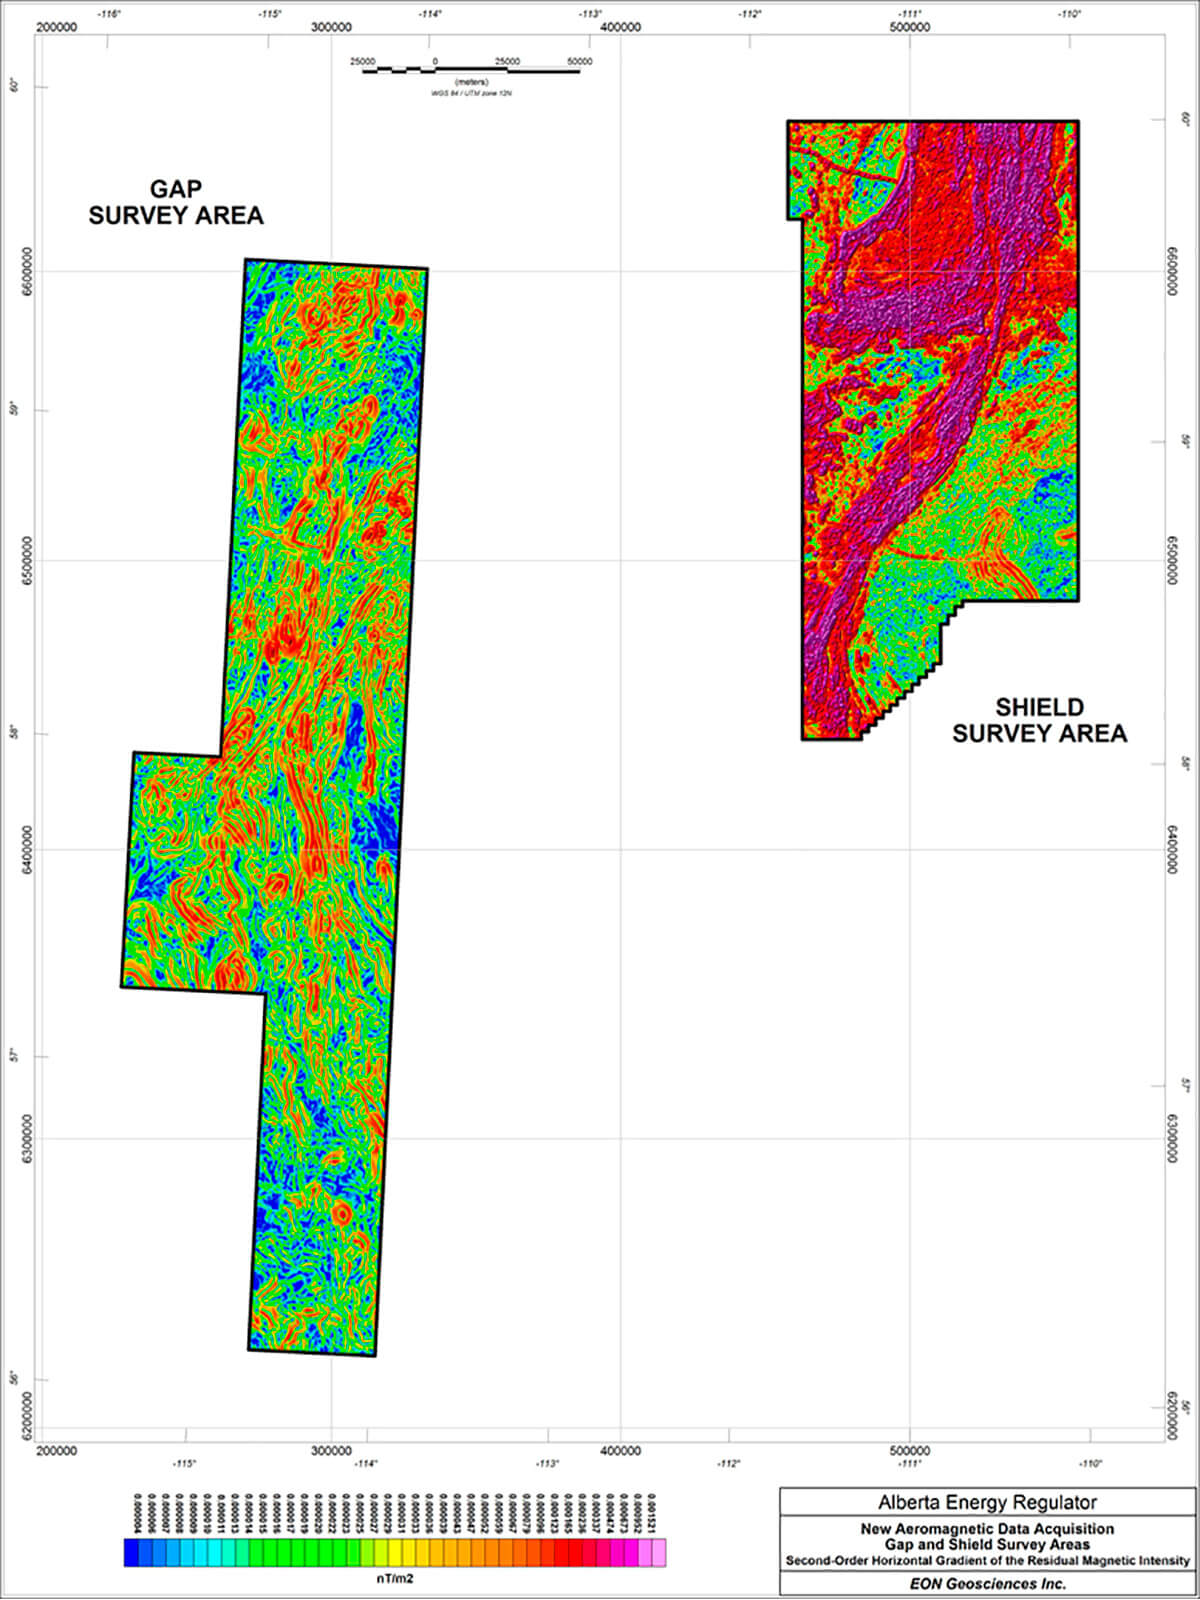
| 2nd horizontal derivative (HzGrad2) | Geosoft GRD, WGS-84 and ASCII GXF | |
| Automatic gain control (AGC_5km) | Geosoft GRD, WGS-84 and ASCII GXF | |
| Automatic gain control (AGC_15km) | Geosoft GRD, WGS-84 and ASCII GXF | |
| Report | Logistics, processing, and documentation of products (combined single report for both Gap and Shield surveys) | WORD and PDF |
| Shield survey area, Final Digital Data | ||
| Product | Data | Format and projection |
| Database | Final processed survey data | Geosoft GDB, WGS-84 and ASCII XYZ |
| Grids | Total magnetic intensity (TMI) | Geosoft GRD, WGS-84 and ASCII GXF |
| Residual magnetic intensity (RMI) | Geosoft GRD, WGS-84 and ASCII GXF | |
| Residual 3rd order trend removal (RES_3trdRemoval) | Geosoft GRD, WGS-84 and ASCII GXF | |
| 1st vertical derivative (VrGrad1) | Geosoft GRD, WGS-84 and ASCII GXF | |
| 2nd vertical derivative (VrGrad2) | Geosoft GRD, WGS-84 and ASCII GXF | |
| 1st horizontal derivative (HzGrad1) | Geosoft GRD, WGS-84 and ASCII GXF | |
| 2nd horizontal derivative (HzGrad2) | Geosoft GRD, WGS-84 and ASCII GXF | |
| Automatic gain control (AGC_3km) | Geosoft GRD, WGS-84 and ASCII GXF | |
| Automatic gain control (AGC_10km) | Geosoft GRD, WGS-84 and ASCII GXF | |
| Automatic gain control (AGC_25km) | Geosoft GRD, WGS-84 and ASCII GXF | |
| Report | Logistics, processing, and documentation of products (combined single report for both Gap and Shield surveys) | WORD and PDF |
As much as possible, we preferred simple data-processing techniques whose derivative products can be intuitively related to the raw anomalies. Mathematics is, by its nature, abstract. Too-elaborate math can generate derivative maps whose geophysical meaning is unclear, and that can undercut the credibility of subsequent geological interpretations. Besides, using simple techniques reduces the chance of undetected processing errors and the harm to the data such errors could cause.
As in our previous magnetic work in Alberta (Lyatsky et al., 2005), we avoided the Reduction to Pole (RTP) in both survey areas. This procedure would employ phase rotation to simulate the appearance of local anomalies if the geomagnetic field were vertical (as it is only at the Earth’s magnetic poles, hence the procedure’s name). However, northern Alberta lies at a fairly high magnetic latitude, where the RTP changes to the anomalies are not significant. More importantly, RTP assumes that all rock magnetization is induced and that remanence is absent. However, measurements on rock samples in the Alberta part of the Canadian Shield show remanent magnetization to be noticeable and in some localities high (Sprenke et al., 1986). The RTP procedure was not undertaken prior to the anomaly enhancements to avoid contaminating the data by applying RTP where it is not appropriate.
By experimentation with the new data as well as from prior experience, the best anti-aliasing was usually accomplished with two or three passes of the Hanning convolution filter, which is a common anti-aliasing method. Glacial erratics, local composition variations in the till, removal of magnetic till by rivers, and man-made infrastructure can all cause local but strong magnetic blips. Besides, even the best leveling can occasionally leave behind some residual flight-line corrugation. These undesirable blips and corrugation can become visible when the data are processed to enhance subtle anomalies, and they should ideally be removed from the data prior to anomaly enhancement. However, eliminating them must be done very carefully to avoid suppressing desirable short-wavelength anomalies caused by shallow geologic features (Figs. 5-9).
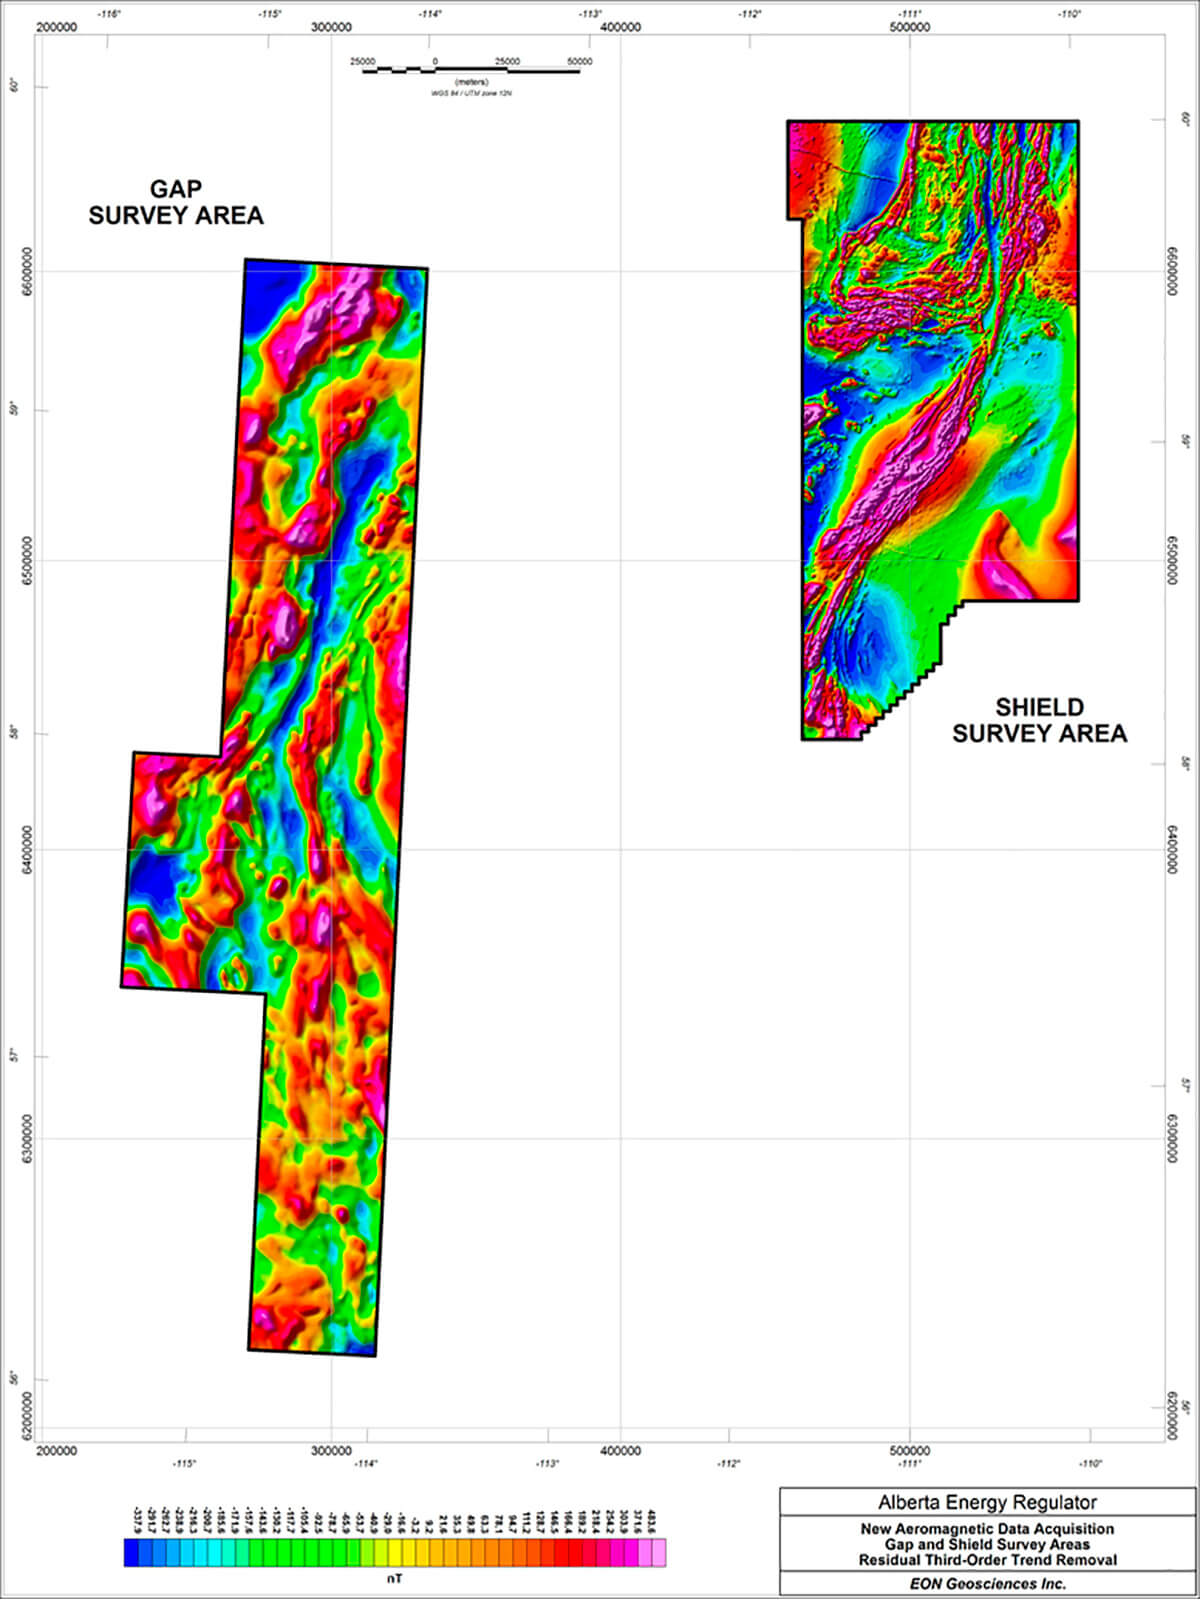
Third-order trend removal was the method chosen to separate local from regional anomalies, consistent with our previous regional studies in Alberta (Lyatsky et al., 2005). Because it allows inflections, a third-order surface is commonly a fair representation of the regional magnetic field. Wavelength filtering was avoided where possible, for the following reasons:
- The pick of the cut-off wavelength is arbitrary.
- The non-vertical filter roll-off prevents clean separation of wavelengths.
- Gibbs ringing, should it occur, can produce anomaly-like but undesirable linear artifacts.
One uncommon but vivid processing product in this study is the second-order horizontal-gradient maps for both survey blocks (Fig. 8). Quite simply, a conventional horizontal-gradient grid is used as a base, and to it, the horizontal-gradient procedure is applied for a second time. The result is an intuitive map which resolves the intricacies of the anomaly pattern as well as the subtle breaks in this pattern that could be caused by brittle faults. Hopefully, this useful technique will be adopted in the industry more broadly.
Summary
The purpose of this project was to acquire new aeromagnetic data and to process these data in ways that would be useful for the delineation of subsurface geology, which would, in turn, inform the assessments of resource potential in the two map areas. We used the tightest flight-line spacing the budget allowed, especially in the Canadian Shield, and we flew the new data across the dominant anomaly grain.
Care was taken to process the new data in ways that could help further local and regional geological and resource evaluations, including both mineral and (in the Gap) hydrocarbon exploration. Enhancement of subtle anomalies was a core objective of the processing, but the raw data are freely available to users who might wish to re-process them in their own ways.
Delineation of brittle faults is important in both hydrocarbon and mineral exploration. Subtle magnetic lineaments that are fault-related might be expressed as linear anomalies and gradient zones, alignments of local anomalies, or linear breaks in the dominant anomaly pattern.
The Canadian Shield contains significant known and potential mineral resources. Metallic minerals do occur in the Alberta part of the Shield (Langenberg and Eccles, 1996), but this area of the province remains underexplored. In mineral exploration, even small and local magnetic anomalies can be associated with mineral occurrences. The new data generated in this project will lead to an improved understanding of the regional and local geology, and it will enable a better evaluation of the resource potential of northern Alberta.


Join the Conversation
Interested in starting, or contributing to a conversation about an article or issue of the RECORDER? Join our CSEG LinkedIn Group.
Share This Article