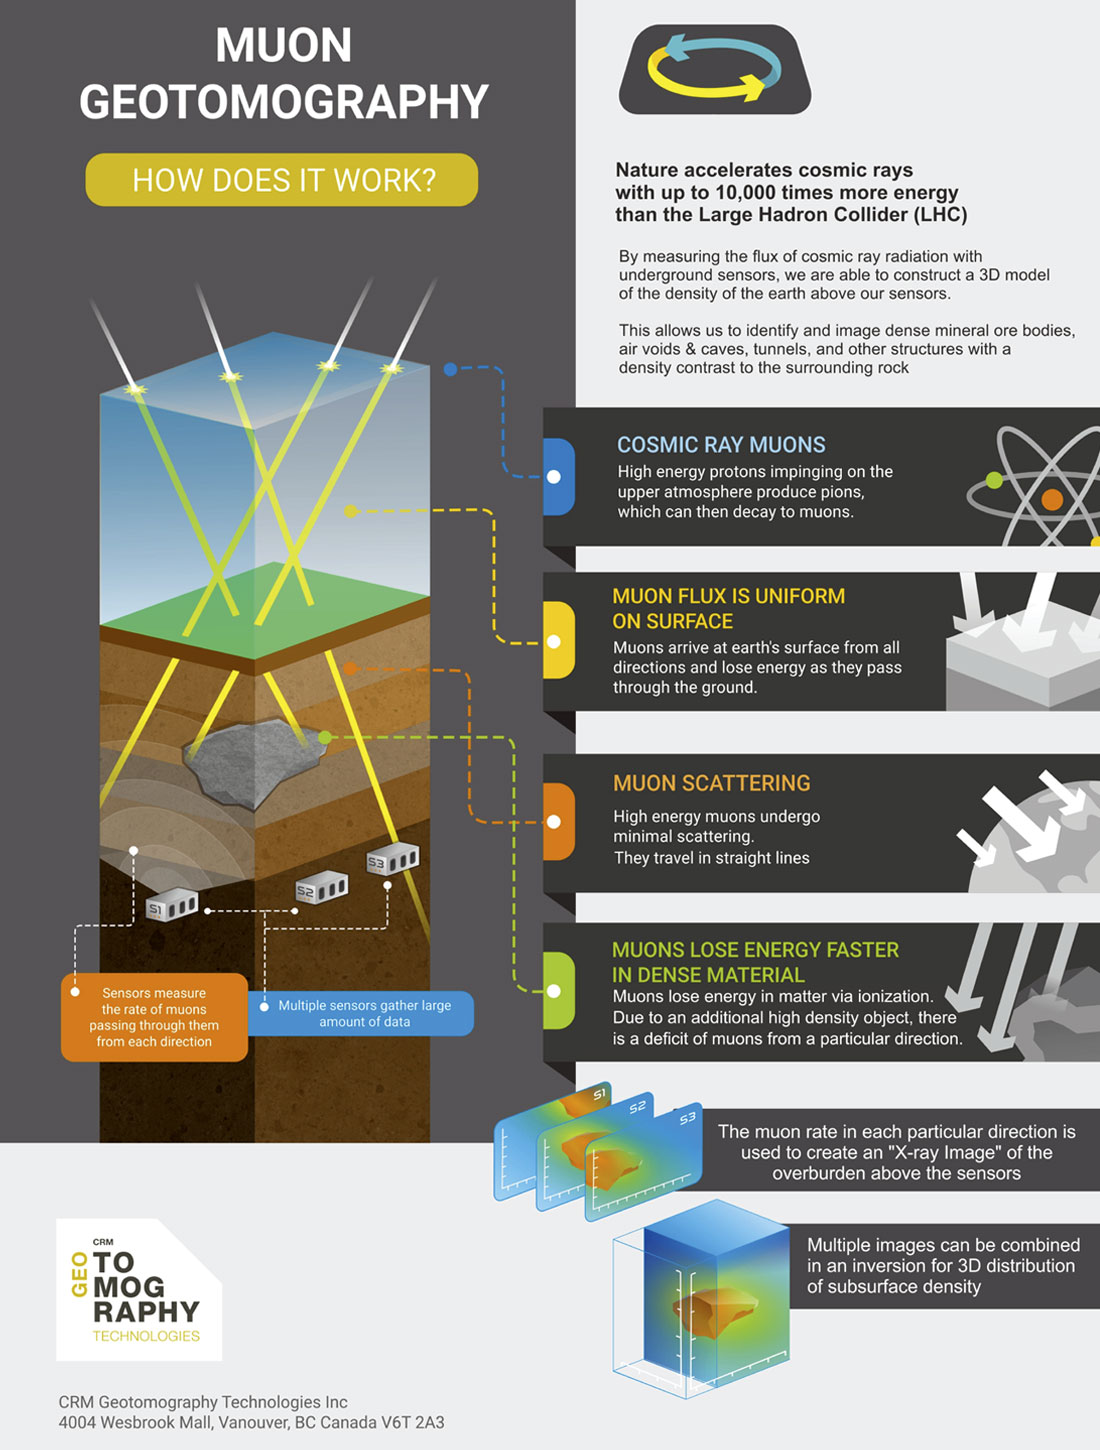
Muon geotomography is a novel density measurement technique based on the absorption of cosmic ray muons in the ground. Naturally occurring cosmic ray muons emanating from the upper atmosphere lose energy as they penetrate the earth. These muons are absorbed at a rate that is proportional to the density of the material they pass through. Thus, by measuring the flux through muon sensors situated underground, the average density in the overburden above the sensors can be determined. Regions of anomalous density can be inferred from reduced muon flux arriving at the sensors from the surface along certain directions. By combining data from multiple sensor locations, a 3D model of underground density can be created. This has applications in mineral exploration near existing mines and in greenfield sites, as well as block caving monitoring, oil and gas reservoirs, and other resource estimation and geotechnical applications.
The first recorded use of muon-based geophysics was by E. P. George in the 1950’s, who used muon attenuation to infer the average overburden of material above a railway tunnel. The famous physicist Luis Alvarez used muon attenuation to search for hidden chambers in an Egyptian pyramid (in that case, the search was for an enhancement of the muon flux due to a chamber filled with air instead of rock).
More recently, muon tomography has been investigated as a tool for mineral exploration. CRM Geotomography Technologies, Inc. is a spin-off from TRIUMF Innovations, the commercialization arm of TRIUMF, Canada’s particle accelerator centre. Begun in 2013, CRM has successfully proven muon tomography technology for mineral exploration by using its muon detectors to image multiple mineral deposits in North America, including at Nyrstar’s Myra Falls mine in British Columbia, Teck America's Pend Oreille mine in Washington State, and at Orano and Cameco’s McArthur River uranium mine in Saskatchewan. To date, the focus has been on proving and developing the technology by imaging known deposits and searching for extensions to existing ore bodies where underground infrastructure is in place. CRM is currently working on development of a borehole muon sensor applicable to greenfield exploration, and plans to achieve a deployable prototype in 2019.
Methodology
One way of understanding the method of muon geotomography measurements is by comparison to X-ray imaging. In the case of muons, the absorption of the “rays” by dense structures is over much larger distance scales, and the intensity of muons is much lower than the X-rays that are artificially produced in usual medical applications, but the overall principle is the same. The intensity of muons impinging on a detector is recorded to produce a 2D image of muon attenuation, or “radiograph”, of the ground above it.

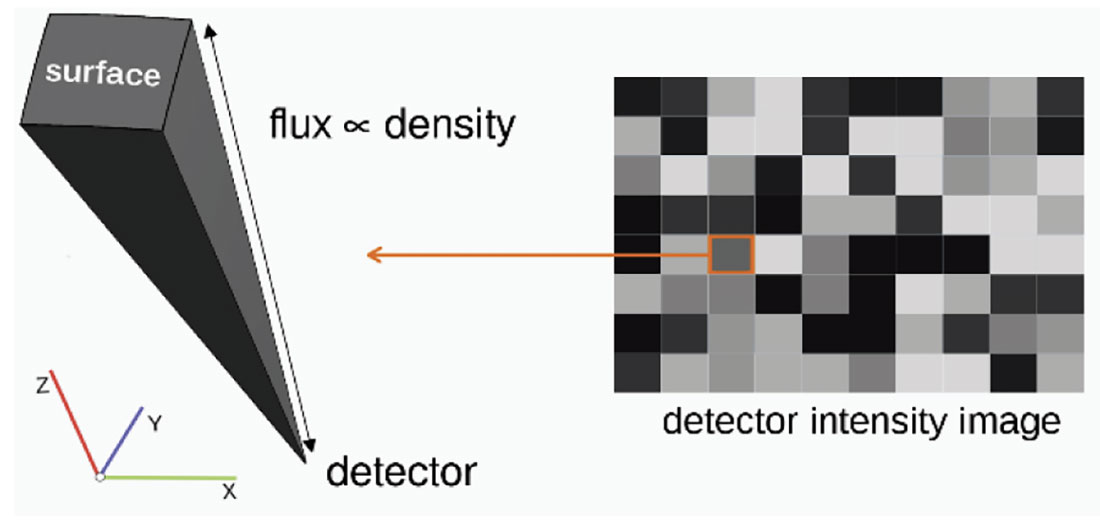
With high efficiency, the CRM muon sensors determine the direction of each muon that passes through them. Over a given exposure time, a pixelized image of muon intensity from each direction above the sensor is developed. Each pixel represents a section of solid angle (a cone) from the sensor to the surface, as depicted in Figure 2. Because the muons arrive at random times (though the average rate is predictable), over any given exposure time there is a statistical uncertainty on the total number of observed muons, and thus on the measured intensity. As the exposure time increases, the relative uncertainty diminishes, and the true underlying structure of average density emerges in the radiograph.
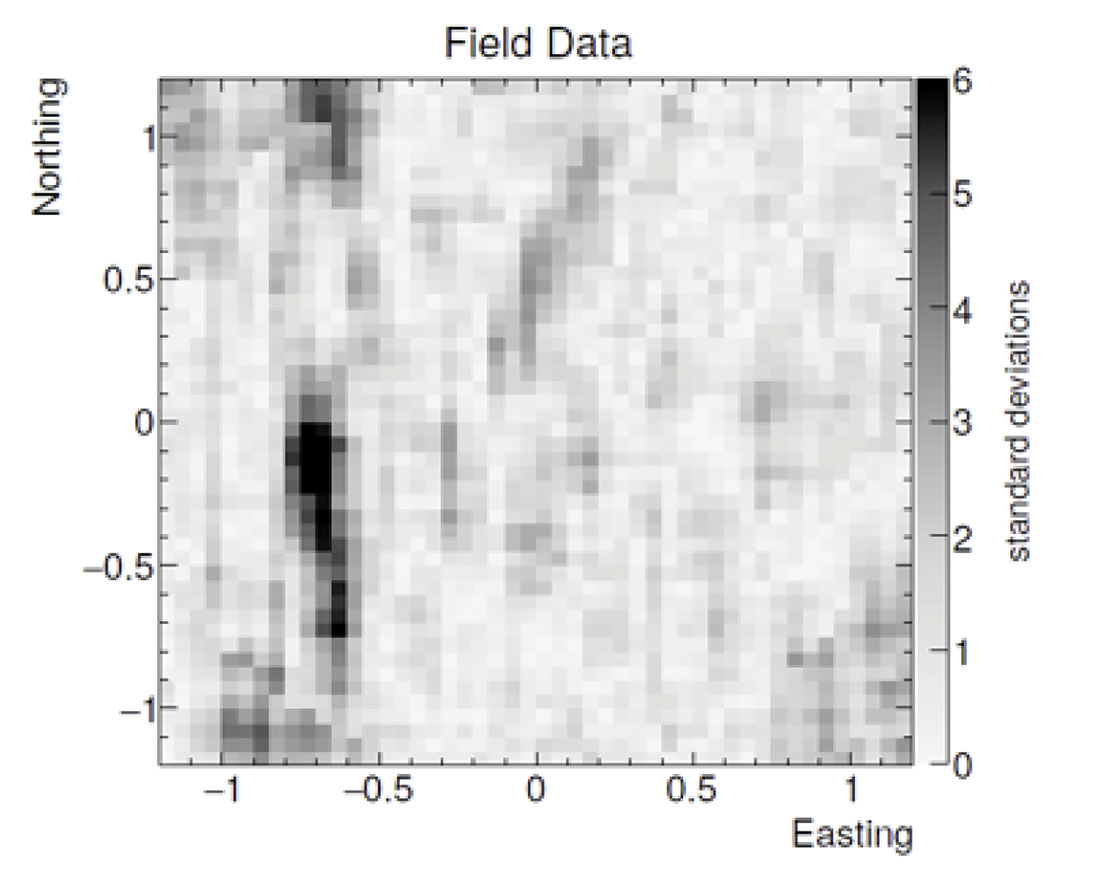
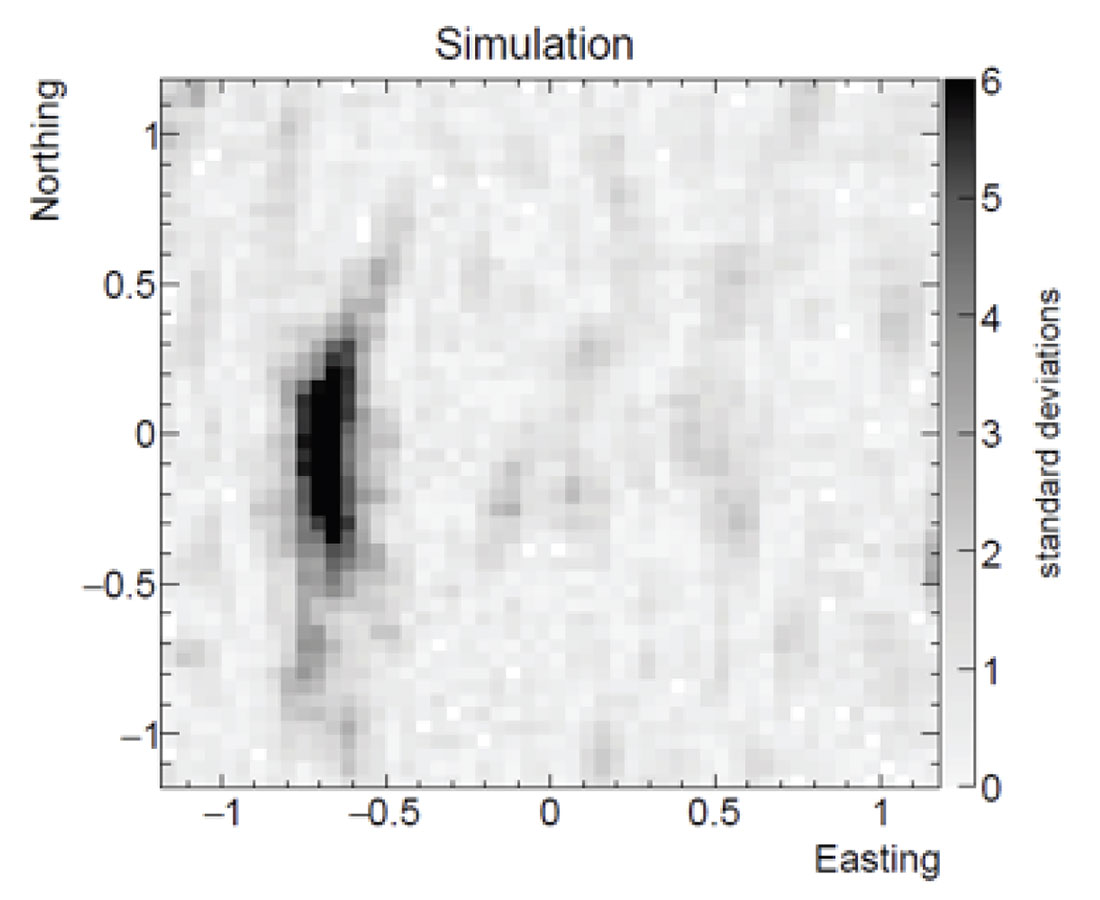
A convenient way to visually identify anomalies in a muon radiograph is to compare the observed intensity to the expected (given some a priori geological model, such as a uniform subsurface of some density). A useful metric in each pixel of the radiograph is the difference of observed to expected, divided by the statistical uncertainty. Example radiographs from a recent survey performed by CRM are shown in Figure 3. A high-density anomaly is seen in the southwesterly direction in the field data or observed intensity (Figure 3a) that accords well with what can be expected from simulation (Figure 3b) with the presence of a high-density structure with uniform density.
By combining multiple muon radiographs acquired at different locations, a 3D density model can be derived using simple inversion algorithms. As before, the analogy to X-rays holds, and 3D density models are built from muon radiographs in a very similar way as in X-ray computed tomography.
Results
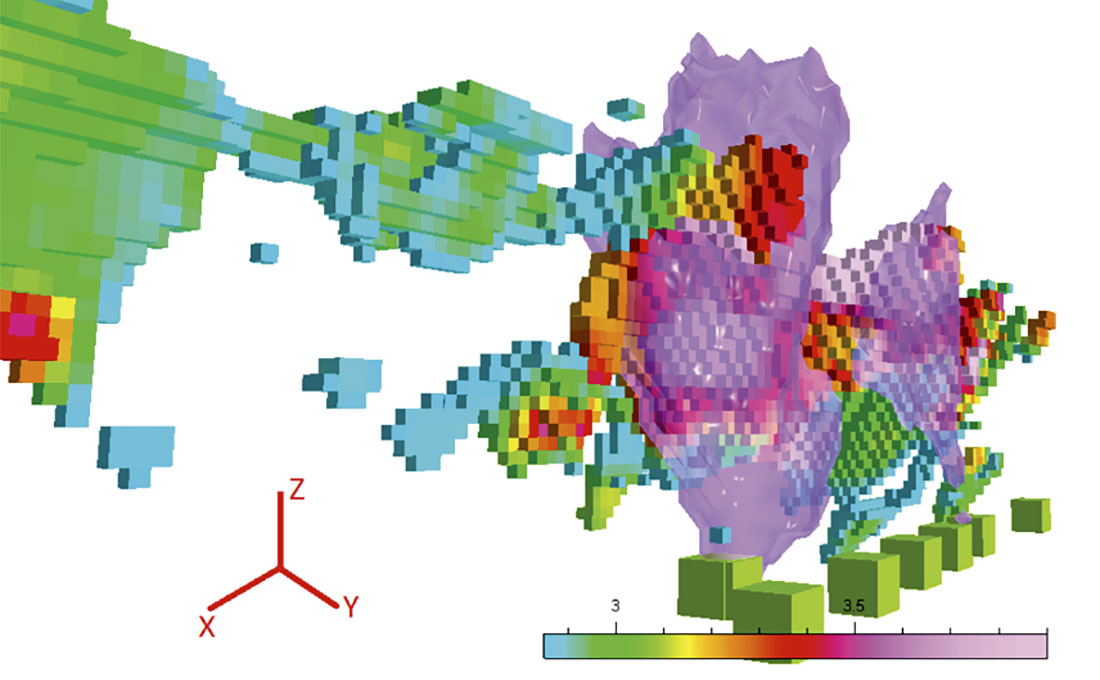
In the Myra Falls field trial, a prototype muon detector was placed in a drift below and off to the side of the known Price deposit, which is a VMS-type polymetallic (zinc/silver/copper/gold) deposit. The muon detector was situated about 200 meters below the surface under steep terrain, and was moved to various positions along the drift for some weeks at each location. LIDAR data was used to develop a topographic model so that the distance to the surface was precisely known along all directions from each detector location. After a total exposure time of a few months, the radiographs from each detector location were incorporated in a 3D inversion. A shell of the resultant density model is compared to a block model derived from drill data in Figure 4.
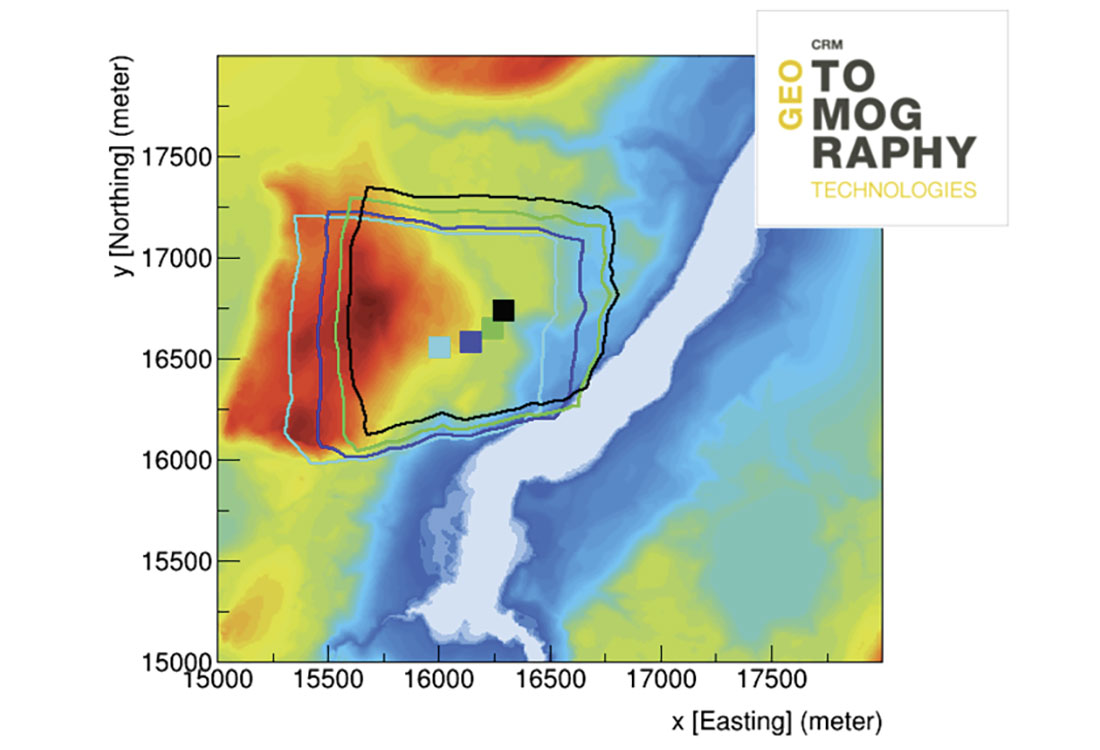
In the Pend Oreille field trial, two of CRM’s muon detectors were placed in four different locations at about 650 meters depth, underneath an MVT-type lead/zinc deposit. The topography above the mine, on the Economic Diversification, and TRIUMF Innovations. order of 50 m, is shown in Figure 5, along with the fields of view at the surface associated with the four detector locations. As can be seen, the volume of rock interrogated by a single muon detector was very large.
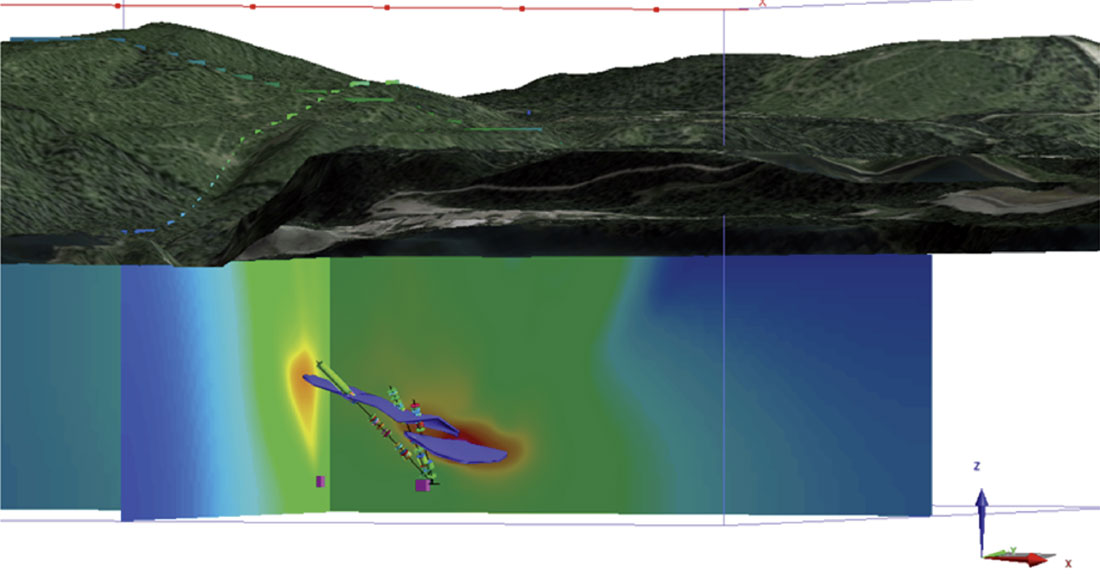
This field trial was blinded. Only after the muon survey, that indicated the presence of a high-density anomaly, were the results provided to Teck and compared to their own model of the deposit and CRM informed that there was an actual deposit there. After incorporating data from five drill holes out of more than 270 drill holes in and around the deposit, with the muon tomography in a joint inversion, CRM could produce a compact density model that compared very well with the known ore shell (see Figure 6).
More details on the Pend Oreille survey can be found in the presentation by Joel Jansen at ASEG 2015, “Blind Test of Muon Geotomography for Mineral Exploration”.
Conclusions
Muon tomography is a burgeoning field. Apart from mineral exploration and other geologically-based applications, this powerful imaging technique is also being explored for industrial and civil structures monitoring and even for imaging nuclear reactors. One of the salient features of muon tomography is that the cosmic rays are produced by supernova explosions light years away, providing a free, natural, and continual source for 3D density imaging. Further, the volume of rock interrogated by borehole muon detectors is an order of magnitude larger than the volume from a fence of drill holes. Among some of the other advantages of muon geotomography are that:
- it is unaffected by electromagnetic or mechanical noise and cultural features;
- it is directional imaging, with less inherent ambiguity than a potential field; and
- it is safe and passive.
CRM has proven that muon tomography technology is capable of imaging dense ore bodies at many hundreds of meters underground, and is looking forward to field trials with a borehole instrument that could be a game changer for greenfield exploration. We are also actively investigating other applications and preparing for field trials where appropriate. One area of particular interest is in SAGD (steam-assisted gravity drainage) oil reservoirs, where there is great utility in monitoring the time evolution of density distribution in each reservoir as bitumen is extracted. Given the relatively shallow depths of extraction wells in which a borehole device could be situated (less than 400 meters), we think this application of muon geotomography also shows great promise.

Acknowledgements
CRM Geotomography Technologies Inc. is indebted to early adopters and testers of muon geotomography, namely Nyrstar (Rick Sawyer, Myra Falls) and Teck Washington Inc. (Joel Jansen, Pend Oreille), and to our funding partners, including National Research Council, Western Economic Diversification, and TRIUMF Innovations.


Join the Conversation
Interested in starting, or contributing to a conversation about an article or issue of the RECORDER? Join our CSEG LinkedIn Group.
Share This Article