Let me set something straight from the beginning. This is not going to be one of those review articles where the author gushes with excitement about his subject like some sort of cheerleader. I will try to be more rational than that. This is not because I have nothing good to say about multicomponent seismic exploration in Canada-I am actually quite optimistic about its future. However I am not optimistic to the point of being foolishly excited. Perhaps my subdued attitude stems from the fact that I am not a very excitable person (processing multicomponent seismic data for long periods of time would dull anyone’s senses). Actually, I think my attitude stems from the fact that I have been around for too long to allow myself to be drawn into making foolish statements about multicomponent seismology being “the next wave of exploration”, or similarly silly predictions about the future. That kind of statement has been made too many times before, only to be drowned out by the relentless waves of ordinary P-wave data that continue to rule the seismic business.
So if you are reading this article to get some sense of whether converted-wave seismic exploration really “works” in western Canada, or whether you are missing out on some new wave of technology, my lack of gushing enthusiasm should set you at ease. You do not have to worry about me trying to cajole you into thinking that multicomponent seismology is going to solve all your exploration problems, or even that it is going to add any value at all to your seismic programs. Most of all, I do not want to be deceitful by misleading you with hype. Goodness knows there is more than enough hype in our business already.
Without any attempt to exaggerate, what I really believe about multicomponent seismic exploration is that the extra information from a converted-wave survey should be useful to you, and it might even be capable of solving a problem or two. But I cannot honestly say that it is always going to help you out because I do not know that to be true. Quite honestly, after dealing with multicomponent data for more than a dozen years now, I still do not have a really good idea of how useful the stuff really is.
The fact is that I am simply a seismic processor, not an interpreter. I have processed plenty of multicomponent surveys in my day, but I have interpreted none of them. And the people who have interpreted them, for whatever reason, usually tell me precious little about how it all turns out in the end. It tends to be that way with most of the data that processors work with: once the final products are handed over, it is as if the entire project disappears into a black hole, never to be heard from again. So I am not even the right person to ask about how useful multicomponent data ends up being in the final assessment.
On second thought, however, this last statement is a bit of a cop-out. As you may have suspected, I cannot have spent so much time working with converted-wave data without having plenty of opinions about the whole multicomponent design, acquisition, processing and interpretation business. Naturally, I have the most to say about processing, but since that is probably the subject that generates the least interest, I will keeps those remarks to a minimum.
For a more scholarly overview of converted-wave exploration than this one, I would recommend the tutorial paper by Stewart et al. (1999), which includes an excellent compilation of recent case histories. The SEG textbook by Tatham and McCormack (1991) is also an excellent reference, although it has little specific information about P-S converted-wave exploration.
There was a time-more than five years ago-when Calgary was probably the converted-wave seismic centre of the world. But to most geophysicists this was little more than a curious distinction, like saying that the town of Vulcan is the Star Trek capital of Alberta. In all honesty, I believe that the amount of multicomponent data acquisition going on in Canada has never amounted to more than a steady drip. In contrast, interest in marine 4C ocean-bottom seismic recording has taken off rapidly in the last five years, starting with Statoil’s startling results that showed that P-S data could see through gas clouds, but P-P data could not (Granli et al., 1999). There are now several complete sessions devoted to multicomponent seismic at every SEG meeting, and the technology is continuing to spread quickly throughout the world. In Canada, the amount of multicomponent recording has recently increased from a steady drip to a continuous trickle. A lot of the increased interest in multicomponent recording has come from interest in Input/Output’s new solid-state VectorSeis sensors (Tessman et al., 2001).
For some reason that is unknown to me, multicomponent seismic recording in Canada has focused from the beginning (the early 1980’s) almost exclusively on 3-C converted-wave data using P-wave sources. In contrast, multicomponent experiments that were going on at the same time in the United States were focusing mainly on 9-C shear-wave source recording, and the converted-wave portion of the measurements were often completely ignored. With only one or two exceptions that I know of, all land multicomponent recording that has been done in the last several years has been 3-C, not 9-C. The much lower cost of acquisition and processing, the far simpler logistics involved with using P-wave sources, and the higher- quality final products are all reasons why 3-C recording is winning out over 9-C. Nevertheless, 9-C recording is not completely dead, and it probably never will die out completely.
I said at the beginning that I am optimistic, but not overwhelmingly excited, about the future of multicomponent seismic in Canada. I am forced to be optimistic because new converted-wave data keeps showing up to be processed fairly regularly. At the same time, I cannot get overwhelmingly excited about the steady amount of multicomponent data that is acquired in western Canada because, with only a couple of exceptions, I never see the same people or companies come back to shoot more of it. If converted-wave data were really that useful, what is taking multicomponent exploration so long to progress beyond the initial experimental stage?
There are lots of possible reasons for the fact that converted-wave surveys have not moved into the mainstream of seismic exploration. One of them is possibly that the quality of data is too poor to be workable. Compared to data from other parts of the world that I have seen, however, western Canada has some of the best quality converted-wave land data that you could ask for. Instead of blaming the data, some people like to blame the interpreters, which is what Bob Tatham did this past spring during his SEG Distinguished Lecture in Calgary. One of his main messages, as I remember it, is that a big barrier to the widespread application of converted-wave surveys is the lack of experience and understanding on the part of the interpreters. If you are an interpreter, this kind of statement must make the hair rise up on the back of your neck. You are probably ready to blame the processors. But as a processor, I am certainly not willing to take the blame. In my mind, the present state of converted-wave processing is perfectly respectable, especially considering the data that we have to work with.
Instead of just pointing fingers, let me make some observations that may cast some light on the subject. Concerning the quality of data, although we are fortunate to be able to acquire high quality converted-wave data in western Canada, what constitutes “high quality” needs to be defined. Consider the raw radial-component receiver gather from a single 3-C geophone in Figure 1 from a recent 3C/3D survey acquired in Saskatchewan by PanCanadian. This horizontal-component data shows outstandingly strong P-S reflected energy. In some places in the world, it is hard to see any reflected energy at all at this stage of the processing. Although this data is somewhat better than most converted-wave data in western Canada, the average quality of most Canadian data is not far behind this.
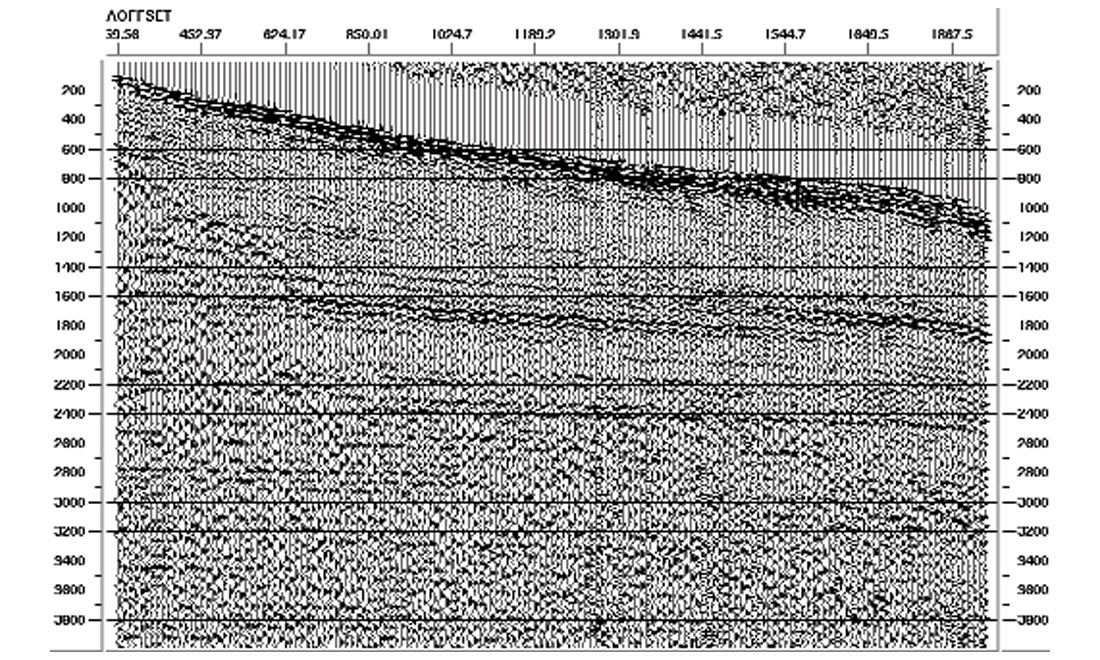
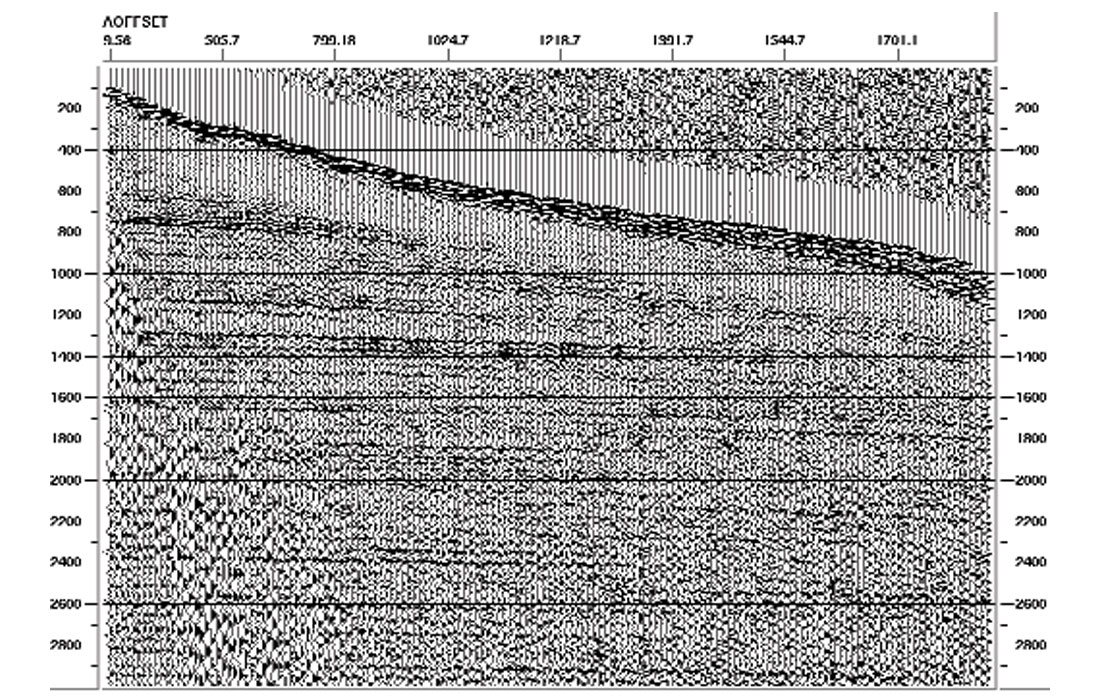
As good as this converted-wave data is, however, the P-S reflections on the radial component are not as strong, coherent or as rich in high frequencies as the P-P reflections on the vertical-component receiver gather shown in Figure 2. This is the way it always is: the P-S data may be high quality, but it is never as good as the corresponding P-P data (unless there is a gas cloud in the neighbourhood, which is sometimes the case with marine data). This is simply a consequence of the fundamental physics of the size of P-P and P-S reflection coefficients. So we need to qualify what we mean by high quality data. They can mean different things when talking about P-S and P-P data.
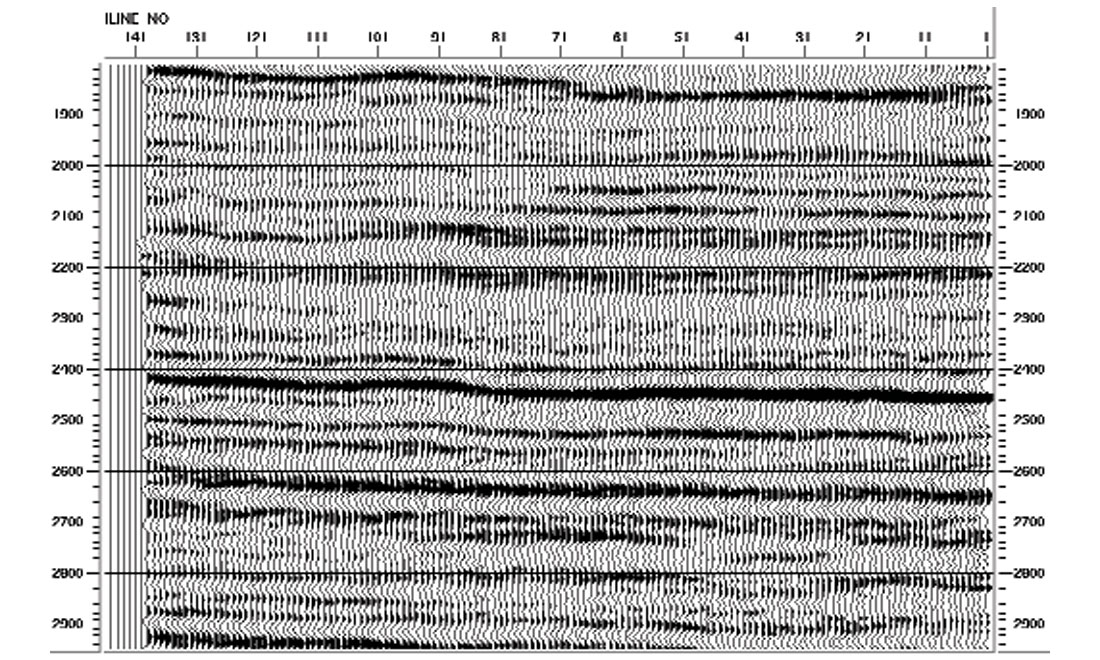
Figures 3 and 4 show portions of the final migrated stacks of the radial and vertical components of the Saskatchewan dataset. Both are “high quality” stacks with lots of coherent energy, but the P-P stack is higher frequency and less noisy, so it is definitely better overall. The difference in the quality of the raw data directly affects the quality of the stacks. Nothing we do in processing can alter this fundamental fact. Nevertheless, in this area the data quality is so good that the P-S stack is approaching, or surpassing, the quality of a lot of P-P data that we are used to seeing in western Canada.
The most common complaint that I get from interpreters is that the P-S data has poor resolution compared to the resolution of the P-P data. Typically the high end of the final filter on the P-S data is 40 to 50 Hz, whereas with P-P data it might be 70 to 90 Hz. The dominant frequency of the P-S data usually is 20 to 25 Hz, whereas it is 30 to 40 Hz for a lot of P-P data. The lower velocities of the shear waves would yield better resolution than the P waves if the frequency content were the same, but since the P-S data lacks the high frequencies, the resolution of the converted-wave data ends up being one-half to two-thirds as good as the P-P data. The difference in frequency content is presumably due to the fact that QS is smaller, in general, than QP, which implies more severe absorption of the shear wave energy. Once again, this is a fundamental fact that we cannot alter in processing, even with inverse-Q filters.
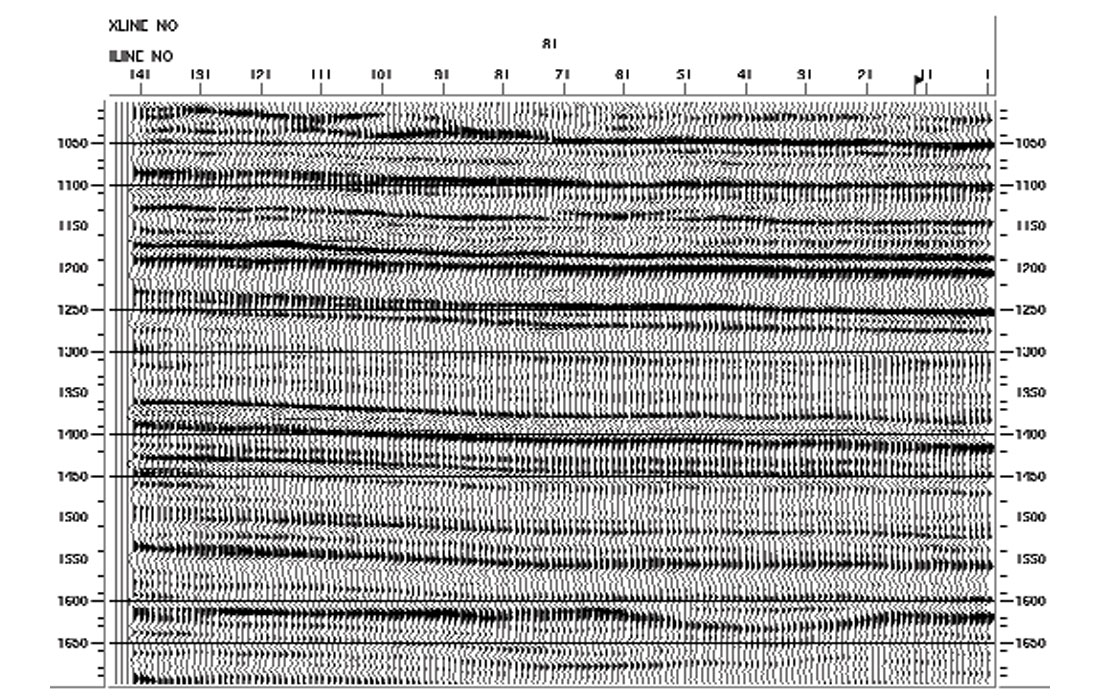
The difference in resolution of the P-P data and the P-S data is obvious by examining the migrated stacks in Figures 3 and 4. The portions of the two stacks that approximately correspond to the same reflectors have been plotted in the two figures. Notice that 1150ms of the P-S stack correlates roughly to just 700ms of the P-P stack, so the shear velocities are roughly half of the P velocities. (If Vp/Vs = 2.0, a P-S reflection arrives 1.5 times later than the P-P reflection). Even at this compressed time scale, however, the converted- wave data still lacks the vertical resolution of the P-P data. This is because the highest frequency in the P-P stack is about 130 Hz, but for the P-S stack the high end is 60 to 75 Hz (depending on how much imagination you have).
Even though the frequency content of the P-S data in Figure 3 is unusually high, the resolution of the converted-wave data is still considerably less than the resolution of the P-P data in Figure 4. This observation about the difference in resolution is so predictable that we know, or should know, that it will be true before the data is even acquired. The only exception might be for an unusually shallow target in the near-surface. So if your zone-of interest is only 20 to 30 ms wide on P-P data, and you want to be able to see three separate reflectors within that zone (such as the triplet of reflectors at about 1250ms in Figure 4), then you should know before you even shoot any 3-C data that those three reflectors will not be clearly separable over a zone of only 30 to 45 ms width on the P-S data (see the smear of reflectors at about 2200ms in Figure 3).
Fortunately, not all methods of interpreting converted-wave data require the exact identification of individual thin horizons on both the P-P and P-S final stacks. For example, the calculation of interval Vp/Vs maps, which has been shown to be a useful diagnostic tool for discriminating between sand and shale in the Blackfoot region of Alberta (Margrave et al., 1998), requires that corresponding horizons above and below the zone-of-interest be picked on the P-P and P-S stacks. Since strong, high amplitude reflectors can be used, the lower resolution of the P-S data ends up not being a critical factor.
Nevertheless, I think that we can point to the lack of good data quality (and resolution) for part of the reason why 3-C data are not yet in the mainstream of exploration. However, I have to agree with Bob Tatham as well. The lack of experience and knowledge of interpreters is a big problem. I have been consistently impressed by the number of interpreters in Calgary who, seemingly out of the blue, have decided to try out a converted-wave seismic program. However, I doubt that this adventurous spirit has always been matched by the knowledge of what to do with this different type of data at the end of the day. This is not meant as a criticism of interpreters because I think that, when it comes to the interpretation of converted-wave data, we are certainly all on a learning curve. There are occasional situations when the interpretation of the P-S data is so simple that anyone can see how useful the P-S data is, such as when imaging through gas clouds in the North Sea (Granli et al., 1999), or when imaging sand channels at the Alba field in the North Sea (MacLeod et al., 1999). However P-S interpretation is rarely so simple.
You just need a close look at Figures 3 and 4 to understand how an interpreter can become bewildered when attempting to jointly interpret the P-P and P-S stacks. The exact correlation of events on the two stacks is certainly not obvious. In general, events correlate relatively well in the bottom half of the two figures, with a bit of stretch and squeeze to compensate for small variations in Vp/Vs. However, there are some large differences in amplitudes and waveforms on many events in the top half of the sections. There are some structural features, such as the synclinal feature in the bottom righthand corner of both figures, that give us assurance that we are in the right ballpark. But the exact correlation of peaks to peaks and troughs to troughs sometimes becomes more of an art than a science.
Even once the decision on how to correlate the P-P and P-S events is made, there are many features in the data that can leave any interpreter bewildered. Why are there lots of small structural features that appear on P-P events that are not present on P-S events, and vice versa? And why are the lateral changes in amplitudes and waveforms sometimes so different? When faced with two such different pictures of the subsurface, with little or no background knowledge or experience, and virtually never any shearwave logs to help explain the differences, the obvious human inclination during the final interpretation must be to fall back on the tried and true P-wave data, and forget about the confusing converted- wave stuff. That is the way that I think it often goes. However, what is really happening is that the shear-waves are reacting to different rock properties than the P-waves, and we often do not yet have enough knowledge or experience to understand what the P-S stack is telling us. This will only come with more time, effort and experience.
What keeps me going through all of the cycles of excitement and disillusionment about converted waves that I have seen through the years is the underlying knowledge that the data cannot lie or deceive. Only people are capable of lying or being deceptive, not seismic data. It may seem at times that the converted-wave data is trying to deceive us because it is different from the P-P data, but the fact that the converted-wave data does not always make sense to us is nobody’s fault but our own. When difficulties in the processing or interpretation occur, we are often inclined to think that the P-P data is right, and the P-S data is somehow wrong. This may not actually be the case, but we think this way because we have been raised on P-wave data, so we have more confidence in what it is telling us. The same level of confidence in the converted-wave data is only going to come with more time and experience.
The exploration community in Calgary has been nibbling at the multicomponent business for more than 15 years now. This may seem like a considerable time, but in terms of the maturity of the technology, it is definitely still early days. The multicomponent work that has been done has been dispersed among so many different companies and people that the knowledge and experience base have not been allowed to build anywhere. The most encouraging sign that I see right now for the future of multicomponent exploration in Canada is that at least a couple of companies are shooting 3-C data with at least some degree of regularity. They are not just shooting a few multicomponent lines, finding that it does not immediately add value, and then walking away. These companies appear to be going to the effort and expense of trying to work through the initial problems in order to build up some sort of knowledge base of people and data examples. The people and companies behind these efforts are the ones who will take multicomponent technology to the next level of maturity in Canada.

Acknowledgements
I would like to thank PanCanadian Petroleum Ltd. for permission to show the data examples.


Join the Conversation
Interested in starting, or contributing to a conversation about an article or issue of the RECORDER? Join our CSEG LinkedIn Group.
Share This Article