A junior oil and gas company was preparing to develop the Cardium sand on their acreage in the Willesden Green area of Alberta. To optimally drain the acreage, horizontal well density and the number of frac stages employed using multi stage fracture stimulation was questioned. To answer this, they contracted Reservoir Imaging Ltd. (Reservoir Imaging) to acquire downhole microseismic (MS) data in a vertical well they drilled near the initial proposed horizontal well. In addition to the MS data it was decided to acquire a VSP survey to refine the velocity model, tie an existing 3D reflection seismic survey and confirm the phase and integrity of the 3D seismic processing.
One of the basic questions that a microseismic survey addresses is the fracture length achieved during a fracture stimulation operation. The ‘first look’ results of the MS survey showed microseismic events were reaching as far as 250 meters from the well bore and up to 250 meters above and 175 meters below the Cardium sand. The question was ‘to what extent were the observed microseismic events linked and stimulated and therefore actually contributing to production’. By analyzing the timing and amplitude of the microseismic events it became apparent that not all events should be used in estimating the stimulated rock volume. By making a series of assumptions and filtering the data, we were able to come up with a more reasonable estimate for stimulated rock volume and thus provide data that would yield an appropriate well density to efficiently drain the reservoir.
Introduction
Microseismic has been a useful tool when it comes to analyzing the effectiveness of hydraulic fracturing. When our client decided to develop a Cardium sandstone reservoir in the Willesden Green area, they felt that a microseismic survey could provide beneficial information with regard to fracture length, width and height of a particular hydraulic fracture stage. As this well completion was to be the first of the development program, the information would be used to determine the well density to efficiently drain the reservoir in addition to the spacing of fracture stages along the lateral.
An issue in the MS community that has caused a disconnect between engineers and geoscientists is the stimulated rock volume (SRV) calculations that come out of MS projects; as companies generally put a disclaimer on the calculated SRV suggesting they are over estimates or an upper limit. Reservoir Imaging worked together with our client to develop a more realistic SRV.
To assure the success of the MS survey, initial modeling suggested moving the first proposed well location closer to the monitor well. A VSP survey was acquired while deploying the microseismic geophones in the monitor well. This survey would be used to integrate the 3D seismic and MS data and refine the velocity model. During the detailed analysis of the microseismic events, our client provided geological input when it was clear that not all events contributed and the initial event volume calculation was over stated and not indicative to an effective SRV. It was not plausible that all the microseismic events located were linked and stimulated. By examining the timing of the microseismic events and the event energy, it was determined that it was appropriate to filter the MS data to get a better solution for effective fracture lengths and a more reasonable estimate of SRV.
Theory and/or Method
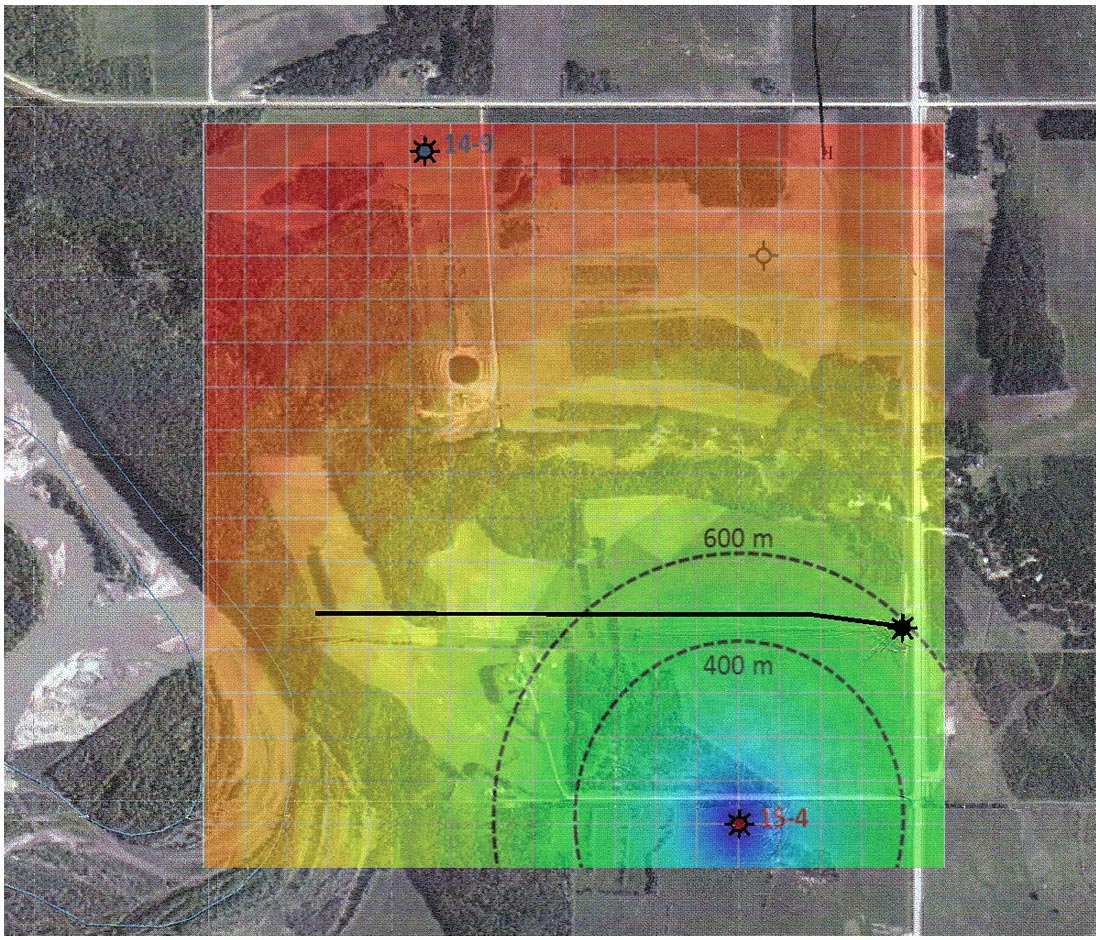
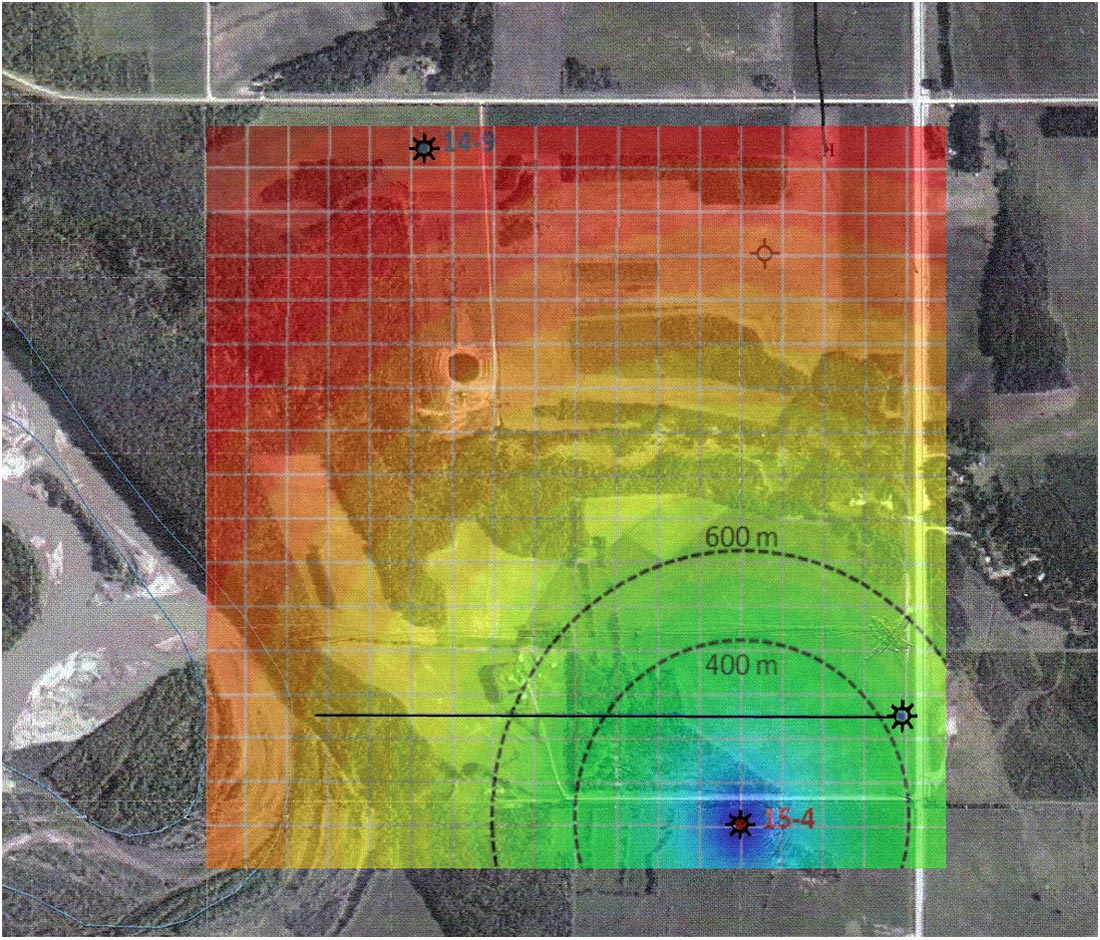
With any microseismic survey, it is important that modeling is done as part of pre-survey planning to ensure project success. Reservoir Imaging’s initial modeling proved useful as it showed that the monitor well and the location of the proposed horizontal development well would not provide optimal results (Figure 1). With that knowledge, our client moved the proposed well trajectory to the south to be closer to the monitor well (Figure 2). It was determined that the optimal detection radius would be 400 meters while larger events may be seen out to 600 meters.
A commonly overlooked benefit of collecting microseismic data is the ability to run an inexpensive VSP in the monitor well as the tools are being deployed or removed. Our client choose to collect a VSP survey in conjunction with the deployment of the geophones into the monitor well. An array of 19 tri-component OYO Geospace DS-150 geophones with a 15 m spacing were used. The VSP provided the information to refine the velocity model and confirm the phase and integrity of the 3D seismic processing. The VSP was also used as a time depth converter, which allowed the microseismic data to be visualized with the 3D surface seismic.
Once the fracture program started, the microseismic data was used to ensure the opening of the sliding sleeve completion system. Any mechanical device can fail, and having visual confirmation that the sleeve opened properly allows for improved decision making when pumping issues arise. During the field recording of the microseismic, it was observed that a high amplitude event was generated at the moment of the ball seat/frac port opening, providing instantaneous confirmation that the well was open to the formation. The signal generated was distinctly different than events generated by the formation, allowing for this confirmation. In one instance the impact of the ball on the frac sleeve created an observed microseismic event that was undetected by the frac crew. When advised the frac crew was able to adjust treatment pressure which allowed the ball to activate the sleeve and allow the fracturing operation to continue.
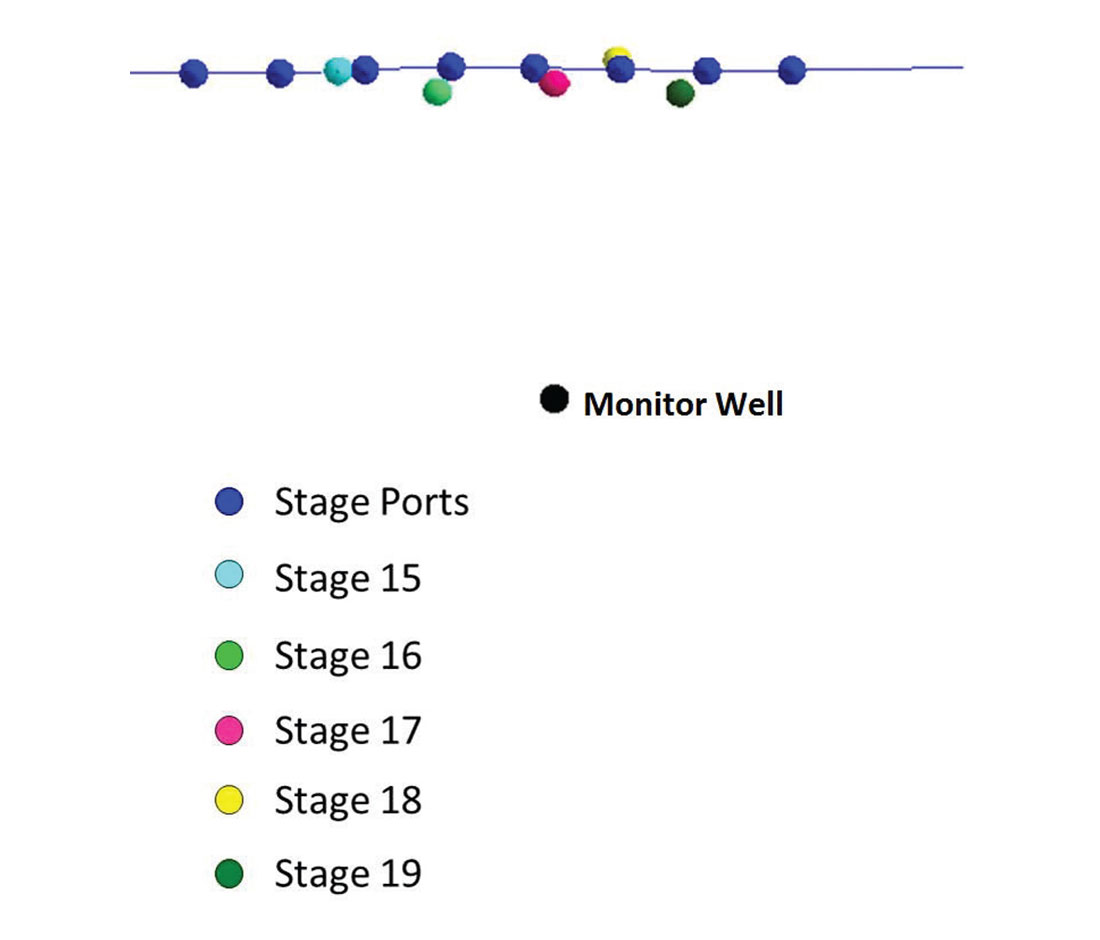
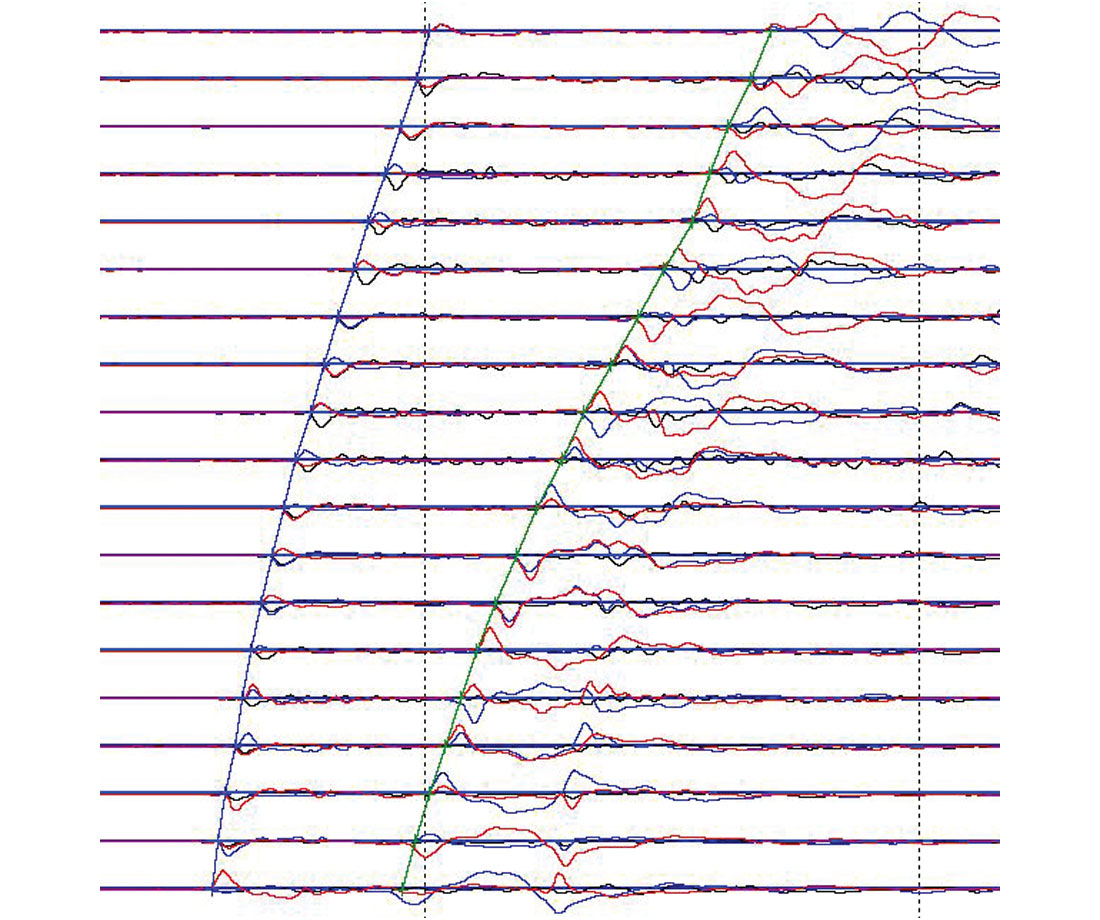
While confirming proper sleeve operation, recording these microseismic events can give insight into the overall accuracy of the data. Knowing the exact location of the frac ports enabled us to verify the accuracy of the velocity model and make adjustments as necessary. Figure 3 shows the stage port location and the corresponding event location for stages 15 through 19. Figure 4 shows an example of a ball seat/frac port opening event where the P and S wave arrivals are clearly seen. Note there is not a consistent offset to the events so the variance in event location was not a function of the velocity model, but rather the frequency of signal and accuracy of the hodogram. The error range for the events is 11.1 meters to 23.4 meters with the average error being 16.6 meters.
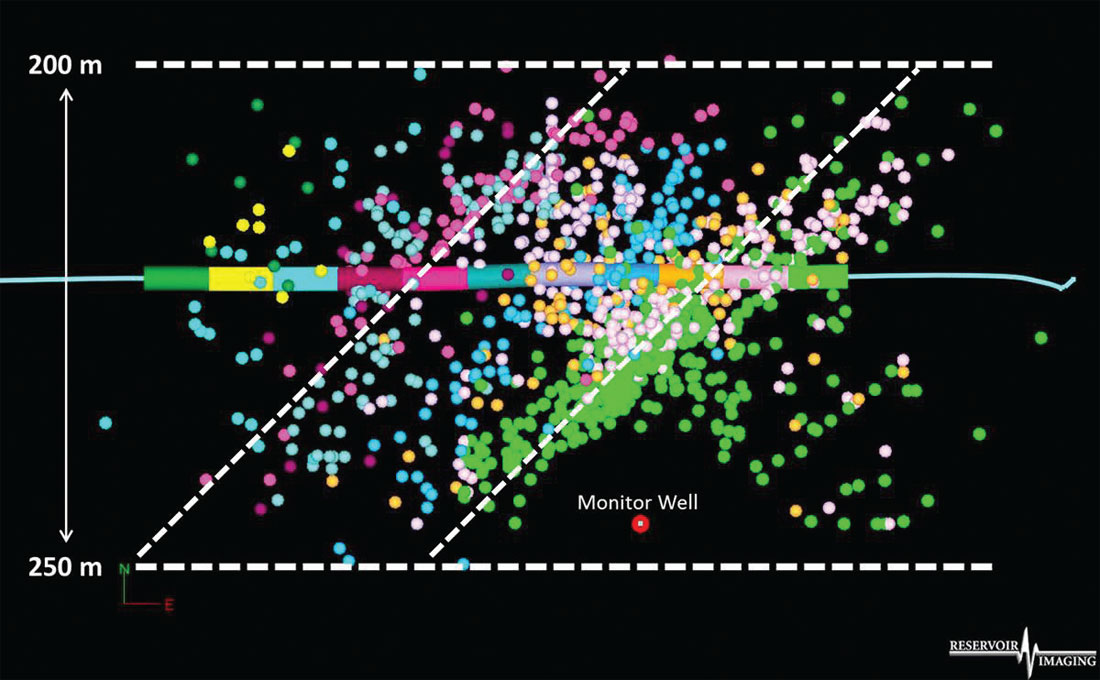
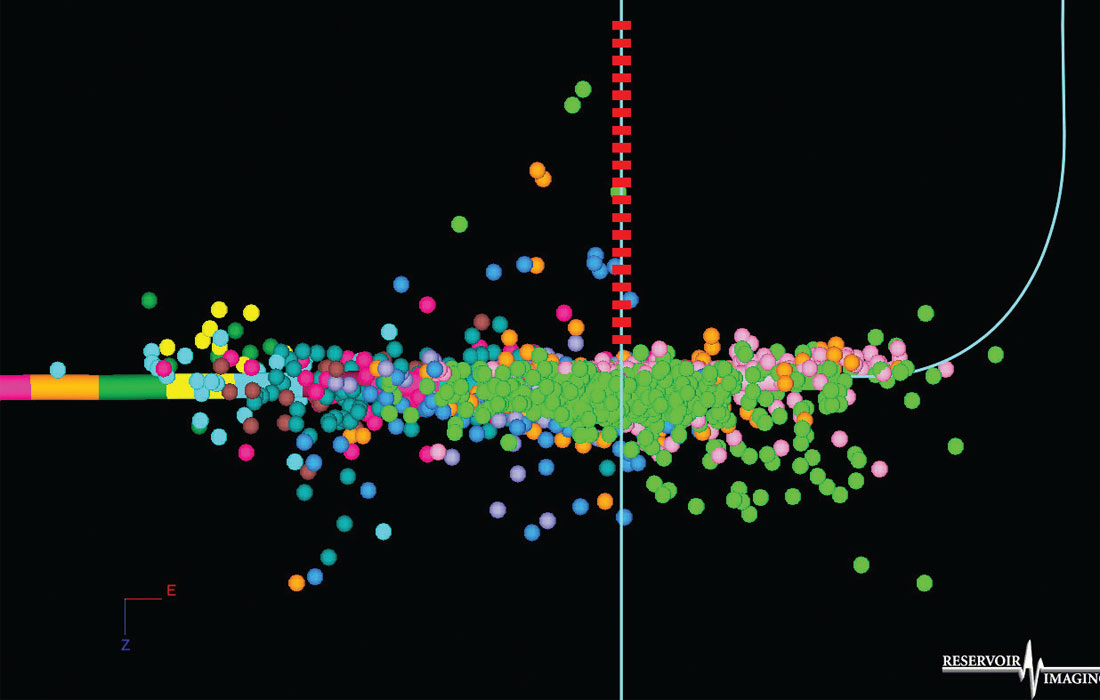
The microseismic results in figure 5 show the stress orientation in the area and the extent of each frac stage. It can be seen there is considerable communication between the stages and as a result our client decided to reduce the number of fracture stages from 20 to 18 in future development wells. The results also showed that the furthest event perpendicular to the treatment well reach out 250 meters to the south and 200 meters to the north. The discrepancy in frac growth to the north can be explained by event detection limits. Figure 6 shows the microseismic results in cross section view and events can be seen up to 250 meters above and 175 meters below the lateral leg.
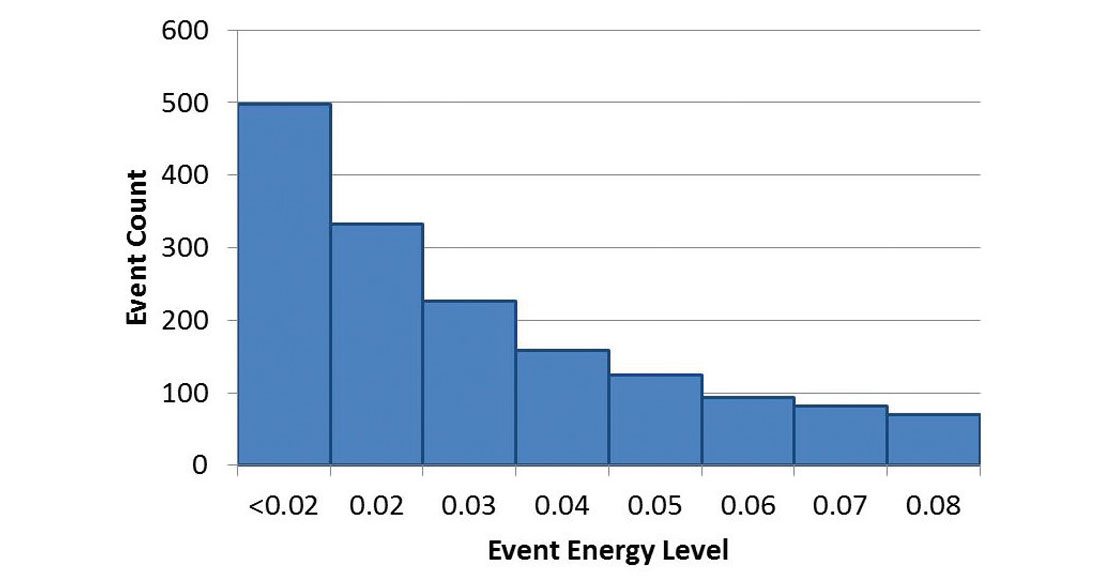
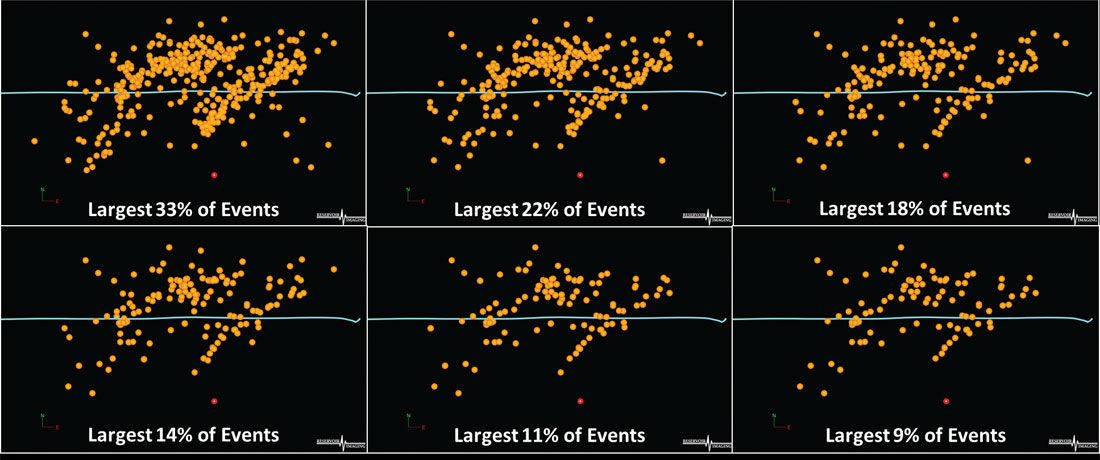
This data suggested that 400 meters between wells would be adequate well spacing, but in calculating a SRV using these limits, an unrealistic value resulted. It was decided that a detailed look at the data was required. In the analysis, four parameters were used to constrain the data in order to predict a more reasonable SRV. The first constraint was related to events that occurred out of zone. It was determined that almost all of the events detected above the zone of interest occurred in the time between stages; when fluid placement had ceased. Our client believed that these events could not be linked to the lower events and concluded that not all the microseismic events relate to fracturing of the reservoir and that microseismic events can be generated by other factors such as “deformation and pore pressure effects” during the fracture stimulation operation, as discussed by Maxwell (2011). Since not all microseismic events should be used, constraining the events to a reasonable distance above and below the reservoir was an acceptable first step. Secondly, the event energy was examined. A typical histogram of event energy versus number of events shows an exponential decline as event energy increases (Figure 7). Generally the large energy events are found near the center of the event clouds indicating the most direct path the fracturing fluid would take from the stage port creating a path of least resistance for proppant flow. Figure 8 shows events relative to energy threshold, as the threshold increases, fewer events are seen and linear trends start to develop from the treatment well. The third constraint was to look at events with an S/P amplitude ratio under 5.5. As the S/P amplitude ratio drops, the likelihood of tensile fractures occurring increases since “tensile opening favors generation of compressional waves” (Maxwell 2011). It is reasonable to assume that tensile fractures create a volumetric change that is more effective at allowing proppant movement into the formation.
Finally, the events that occurred while the pressure was at a maximum were plotted. The large events that occur outside this time frame are less likely to have contributed to proppant flow as “pressure relaxation at the end of an injection will result in predominant closing of the hydraulic fracture” (Maxwell 2011). The extent of the frac growth shown in figures 9 exhibit a different picture than the preliminary results first depicted in figure 5.
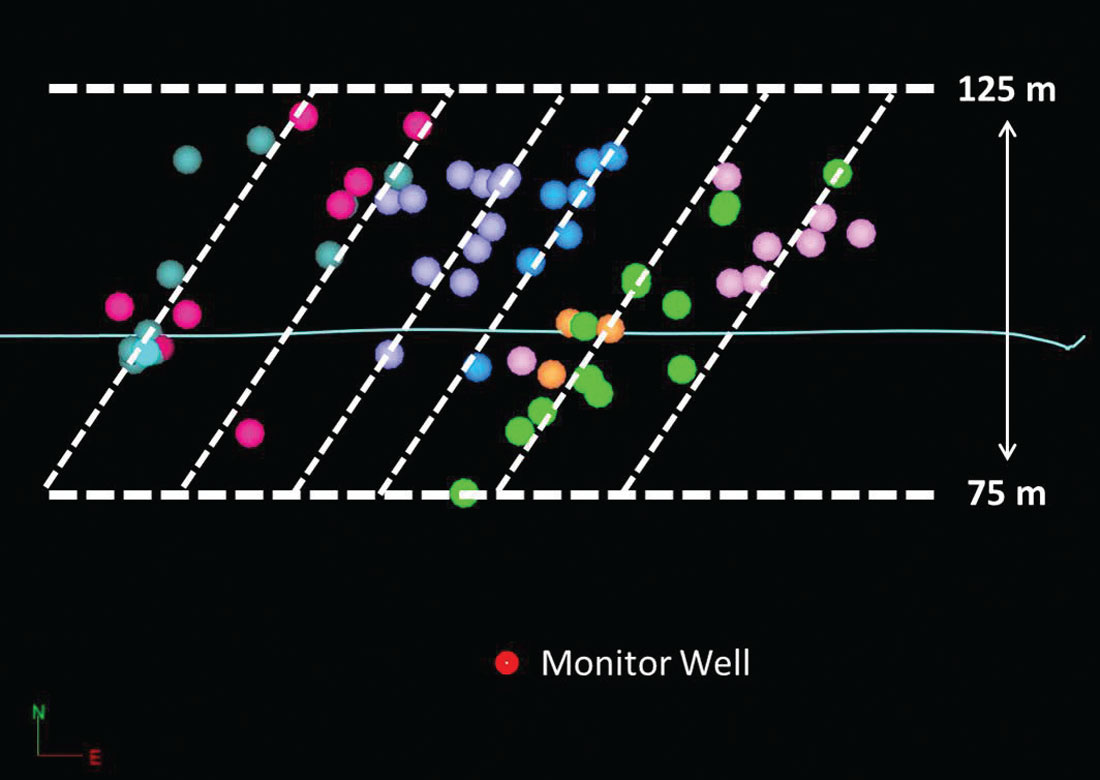
The original data set showed frac lengths extending 200 meters north and 250 meters south of the treatment well. The filtered events now show what might be considered effective fractures extending 125 meters north and 75 meters south. The frac widths still indicate some communication between stages. The majority of the stronger events happen on the north side of the treatment well, which is to be expected since it is the up dip direction of the formation. These results would now suggest drilling more wells per section than the initial results indicated. Continuing this finding onto the width of each frac stage, we can conclude that some overlap between stages is necessary if complete drainage of the formation is to be achieved. That is why the recommendation to reduce the number of stages from 20 to 18 was made. By doing that, our client was still able to recognize a cost savings in the completion program, while ensuring enough overlap to ensure effective fracturing of the formation.
Conclusions
Our client was successful in acquiring a microseismic survey and VSP. By combining the two services only a few hours was added to the overall process which was very cost effective. The VSP data enabled us to refine the velocity model, tie the 3D reflection seismic data and confirm the phase and integrity of the 3D seismic processing. The MS data provided valuable information as to the geometry of the fracture stimulations. Preliminary results showed event clouds overlapping suggesting communication between frac stages and indicated frac lengths of up to 250 meters. But this initial interpretation of the data honored all locatable microseismic events and did not discriminate or differentiate between them, even though it’s been found not all microseismic events relate to fractures. By looking deeper into the MS data, a few observations and assumptions were made that led to a filtering of MS events which made it possible to establish a more reasonable estimate to the actual fracture propagation. This interpretation suggested frac lengths of 125 meters to the north and 75 meters to the south for total frac length of 200 meters, or 44% of the original observation. This meant that the inter-well spacing should be increased to more effectively drain the reservoir, while limiting the stage count to 18 which would optimize the cost/benefit relationship.
Since this initial study was done, our client has drilled a second horizontal well 275 meters south of this initial well. During the treatment of this second well, no pressure changes were detected in the first well. It took 4 days after the frac for the first horizontal to see frac fluid (nitrogen), confirming that there was very little communication between the two fracture networks and that the actual fracture growth is closer to 125 meters than 200+ meters.


Join the Conversation
Interested in starting, or contributing to a conversation about an article or issue of the RECORDER? Join our CSEG LinkedIn Group.
Share This Article