In oil painting restoration, masterpieces dirtied by centuries of grime and smoke are cleaned to reveal the original brilliant image. The recent cleaning and restoration of the frescoes in the Sistine Chapel are a familiar example. Once the unwanted dirt had been removed, the beauty and vibrant colors of the true image was stunning. The splendor of the true image had been there all the time, unseen and obscured by ‘noise’, for years. The restoration renewed the vivid colors of Michelangelo’s work, and, in fact, caused art historians to reconsider their understanding of the master’s use of color.
Interestingly, early restorers attempted to clean the Sistine ceiling with materials ranging from bread to retsina wine. It became apparent that to successfully uncover the original painting, proper cleaning methods would be needed. But just removing the ‘noise’ would not be enough: heavy-handed approaches like scrubbing by brute force or cleaning with solvents could do this but would damage the paint. A method had to be found which could lift the dirt without altering the original image.
How can art restoration inspire seismic data processing?
Seismic data contains both desirable signal and undesirable noise. One of the challenges of seismic data processing is to remove the noise, leaving just the good signal. There are many approaches to doing this; most have shortcomings such as mathematical artifacts that alter or distort the signal, or simply fail to address certain kinds of noise. For example, Radon de-multiple methods transform surface seismic data from time-offset coordinates to zero offset intercept time – slowness coordinates, where various elements of the recorded data, such as signal and noise, may be more easily separated. Unwanted multiple events are isolated in the transform space and reconstructed in the data space using an inverse Radon transform. The reconstructed multiples are then subtracted from the input, leaving, in theory, modeled primaries only.
Non-hyperbolic multiples are problematic for Radon methods
Traditional Radon methods often work well but fail to address situations where the multiple reflection is nonhyperbolic. This happens frequently in marine data where the sea floor has rugged, rapidly changing topography: the time-offset curve of the water bottom multiple reverberation is not hyperbolic. A Radon transform typically assumes that a multiple exhibits a parabolic or hyperbolic t-x curve, and, in addition, assumes that the apex of the curve is at zero offset. Most standard Radon methods cannot handle situations where the multiple reflections do not honor these assumptions.
Limited aperture causes edge effects and near offset leakage for Radon methods
Radon methods are aperture-limited. As noted by Wang (2003), the limited spatial aperture causes edge effects, impairing the separation of primary and multiple reflections in the Radon transform domain (the events do not transform as they should to points in tau-p space, rather, they transform to smeared interfering lines). The limited size of the spatial aperture of a seismic gather affects the ability of Radon transform to separate multiple and primary reflections. With Radon there is near offset leakage of multiple energy.
To accommodate this shortcoming of Radon, adaptive surgical muting or inside mutes have often been used to remove the near offset data. To address spurious random noise, noise burst attenuation programs are also commonly used. This approach - inside mute accompanied by deburst - yields a reasonable looking stack but does not preserve amplitude integrity and, in fact, completely sacrifices near offset information. This may be satisfactory if stack is the required output, but is problematic if further pre-stack processing is desired.
High resolution Radon de-multiple methods attempt to overcome limitations of spatial aperture and spatial sampling by imposing sparseness constraints in the Radon domain. The sparcity constraints, a departure from the conventional least-squares solution, effectively move the transformed energy to where it would be if there were no sampling or aperture limits. Think of it as focusing in tau-p space: the smeared (aliased) lines become points. HR Radon de-multiple has been useful to deal with aliasing on far offset data and to discriminate more precisely between close curvatures.
SRME (Surface-Related Multiple Elimination) is another multiple attenuation tool. We have seen this approach work well, particularly in situations where the surface generating the multiple reflections has moderate structural complexity; complex enough that other de-multiple methods like Radon, tau-p decon and time domain gapped deconvolution fail. However, for multiples from a surface with rapidly changing 3D topography, we have found the SRME method is limited by the assumptions behind the technique, namely: 1) a source for every receiver and vice versa, usually requiring interpolation and extrapolation (potentially introducing aliasing issues which become even more problematic in 3D), and 2) it is difficult for SRME to get the amplitudes correct (iterations of SRME do indeed converge to the response without free-surface multiples when the correct weights are used at each iteration, but not when they are defined from the minimum energy criterion). Picture a multiple from an irregular 3D water bottom. The multiple changes shape, amplitude and position with offset. In fact, at mid and far offsets, the WB multiple no longer aligns with the sea floor topography. It is difficult for SRME methods to accommodate this. HR Radon methods are inefficient in addressing these diffracted multiples with shifted apexes in the cmp gathers.
Spatial filters can be frustrating
For other kinds of coherent noise, such as air-blast, ground-roll noise, or any coherent linear noise, spatial filters such as F-K (frequency-wave number) transforms are commonly used. Many of these techniques do attenuate coherent noise, but leave frustrating mathematical artifacts that alter or distort the signal somewhat.
To address random noise, other methods such as FX Deconvolution have traditionally been used. The F-X prediction filter makes a general signal model assumption: that signal is predictable by convolution filters. The seismic signals in the frequency-offset domain are represented by complex sinusoids in the X-direction, which are then predictable. In comparison, random noise is unpredictable and can be rejected. Care must be taken, especially with dealing with edges, if the amplitude integrity of the signal is to be left intact; something which is important for any subsequent AVO analysis.
The LIFT™ Approach
LIFT is an amplitude-friendly technique to attenuate noise and multiples. LIFT is a significantly different approach to the problem of noise attenuation than what has been done traditionally. The LIFT method was built to attenuate any kind of noise - including multiples - while preserving the AVO integrity of primaries. This is important if one is to carry out amplitude-preserving processing and meaningful AVO analysis, including the possibility of AVO analysis on pre-stack migrated gathers.
LIFT General Methodology
The general method is to simultaneously model signal and coherent noise, and then in a nonlinear adaptive fashion, attenuate noise. Signal and noise can be modeled in a variety of ways, depending on the nature of the problem.
LIFT is not a single module or algorithm, it is an umbrella name for a sequence of a variety of steps. Some of the steps within the LIFT sequence will include traditional ways to describe signal and noise - like FX Decon (for random noise), FK (for linear noise), simulated geophone arrays (for ground roll), Fatti et al.’s AVO Equation (for primaries) or Radon transform (for multiples). The steps chosen will depend on the nature of the particular noise we are addressing.
Data Example: LIFT to Attenuate Multiples
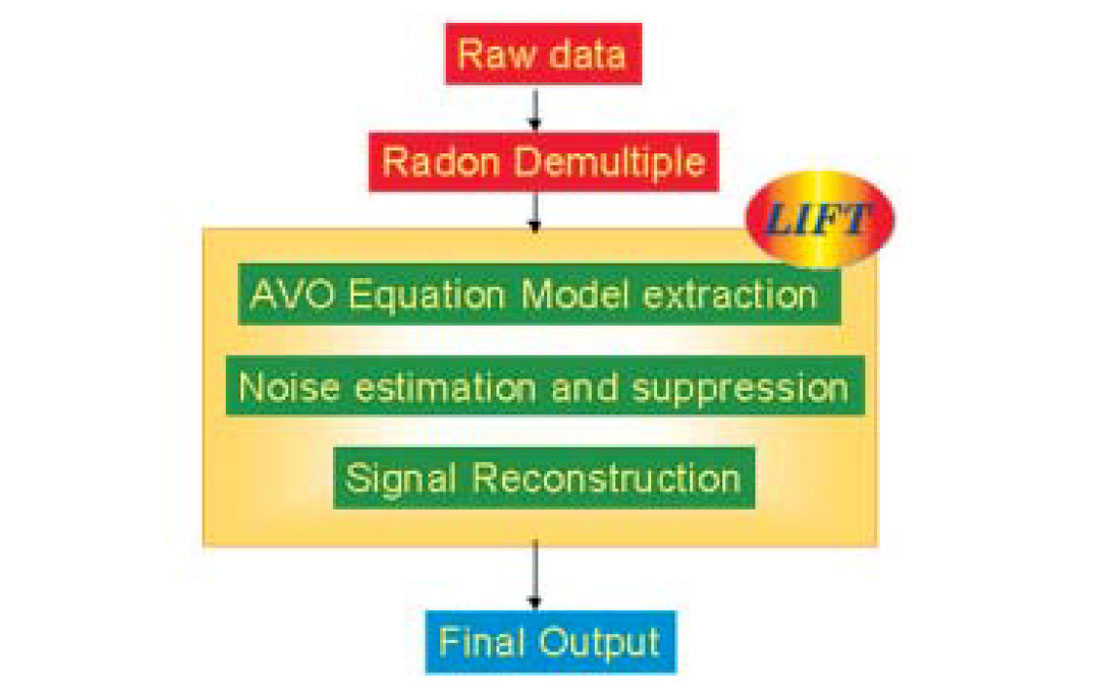
The methodology is first to perform Radon de-multiple as needed, to identify coherent noise and to improve signal-to-noise ratio. Signal can then be modeled in a variety of ways, for example, by an AVO equation. (In a sense, this approach to modeling signal exploits the assumptions of Zoeppritz’s equations: plane waves and reflection between two half-spaces. Due to these assumptions, a Zoeppritz-based AVO inversion will consider multiples and converted waves to be noise and will exclude them in its reconstruction. Voilà, primary signal is modeled.) Then the LIFT sequence estimates and suppresses multiple energy from the original data in an adaptive nonlinear fashion (Figure 1).
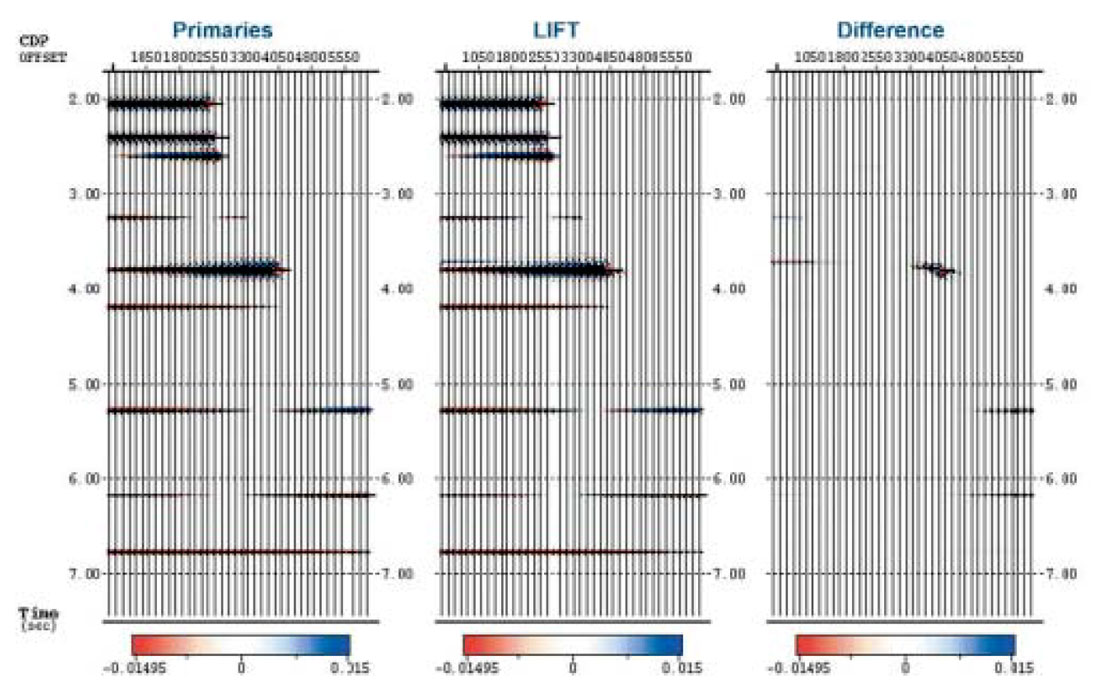
The LIFT Technique for multiple attenuation has been found to work well in both land and marine data. Figure 2 shows an example of multiple attenuation in offshore data.
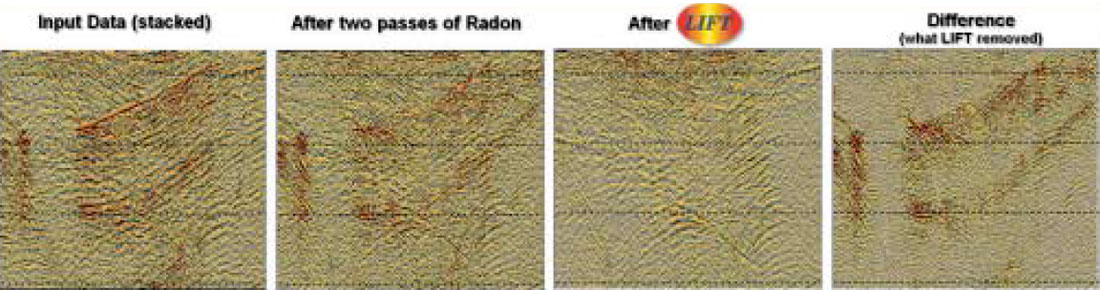
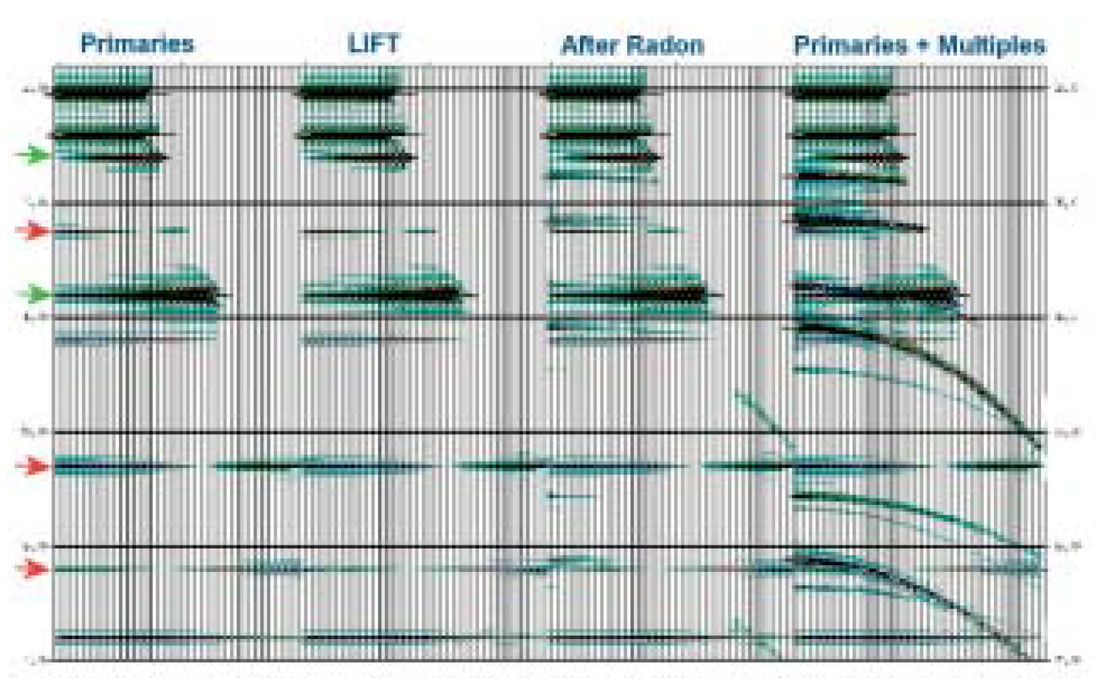
From left to right are zoom displays of the stacks of the input data, the data after Radon de-multiple (to attenuate the water bottom multiple), and after LIFT. One can see that multiple energy from the irregular sea floor is attenuated effectively. The question sometimes arises whether this multiple attenuation scheme will preserve diffractions for pre-stack migration. One can clearly see that diffraction patterns are still present after the LIFT process. In fact, originally noise was sitting on top of the diffraction energy, making it difficult to identify the diffractions.
The right-most panel is the Difference display, (the difference between Radon and LIFT), showing what LIFT removed.
Data Example: LIFT to Attenuate Source-generated Noise
A very successful application of LIFT in land data has been to attenuate difficult source-related noise. A typical LIFT methodology is to address ground-roll noise with array forming - a computer simulation of geophone field arrays. Geophone arrays in the field, spanning dimensions comparable to the dominant wavelength of the noise, have traditionally been used to discriminate against events on the basis of their moveout or apparent wavelength, but long geophone arrays can greatly reduce the frequency content of recorded data. With array forming on the computer, the effective array length can be set differently for each frequency considered. Carrying on with the LIFT sequence, the source-related noise is then estimated and suppressed (Figure 3).
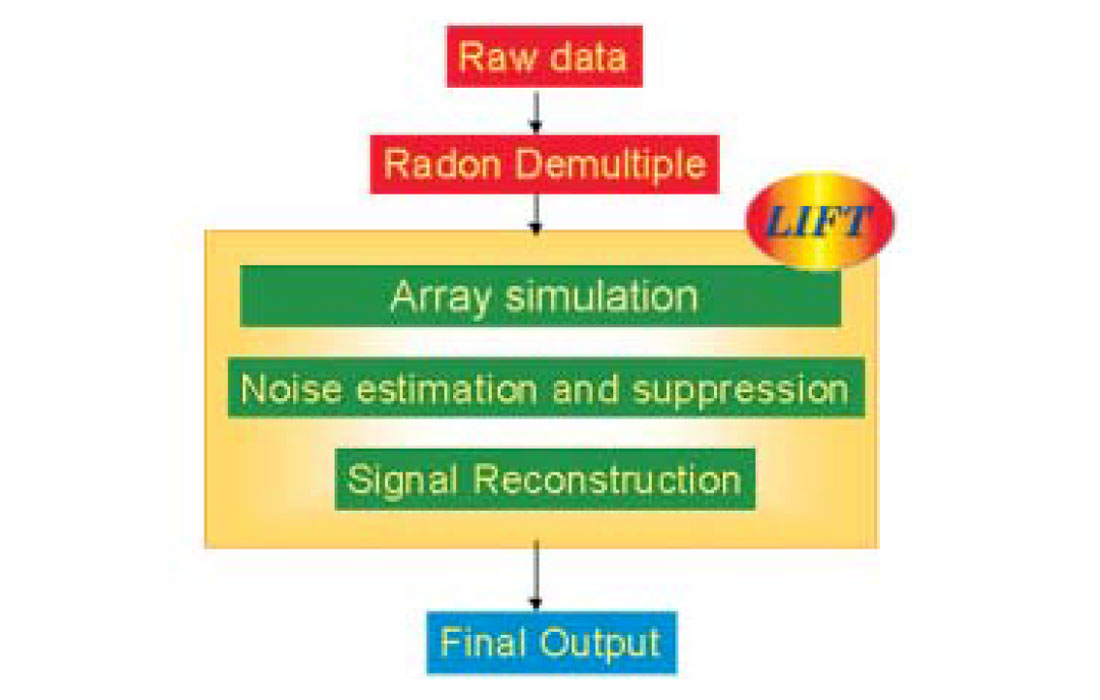
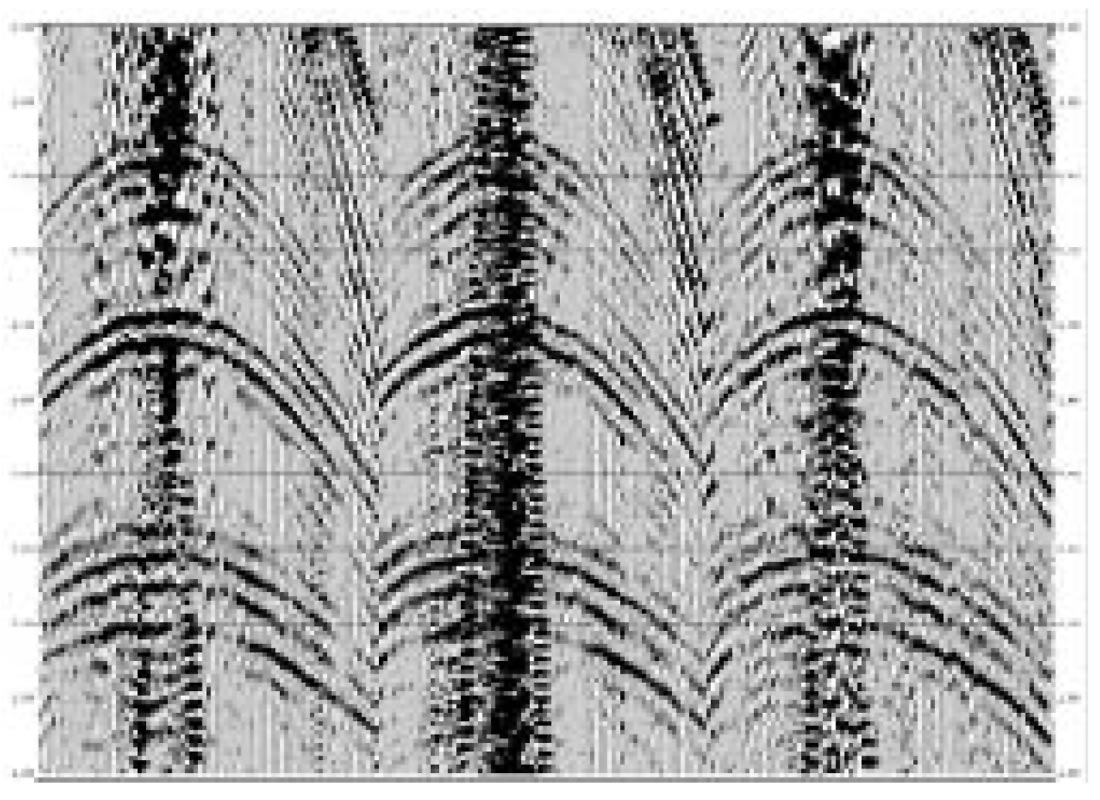
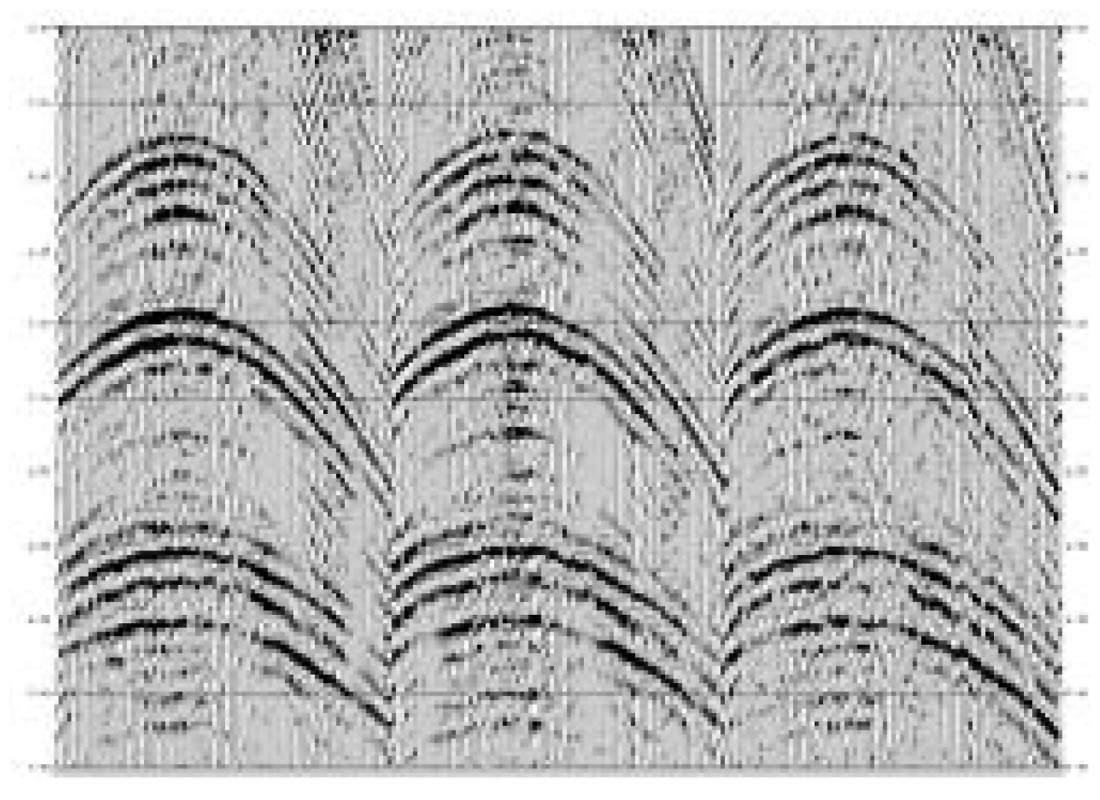
Figure 4 shows a typical Alberta land shot record. Geometric divergence correction is the only process that has been applied. Air blast and ground roll noise are evident. Figure 5 shows the shot record after the LIFT sequence to attenuate source-related noise has been run.
We have also found this technique works well in the challenging Mackenzie Delta area, where the seismic data collected can be affected by permafrost, sea ice, and the deposits of the Mackenzie River itself. Groundroll noise travels fast through the frozen near-surface, and data recorded here often has a very poor signal-to-noise ratio generally. The noise is typically in the same bandwidth as the signal, making it difficult to deal with. Historical approaches like spatial filters perform reasonably but the results suffer from some spatial smearing, and amplitudes of signal are not necessarily preserved. Again, the challenge is to reduce the noise without smearing, distorting, (or creating) signal. The results from the LIFT approach have been welcomed by the client. The approach can be iterative and parameters can be fine-tuned for particular datasets.
How can we know it preserves amplitudes?
Investigation of LIFT’s AVO-friendliness in attenuating multiples
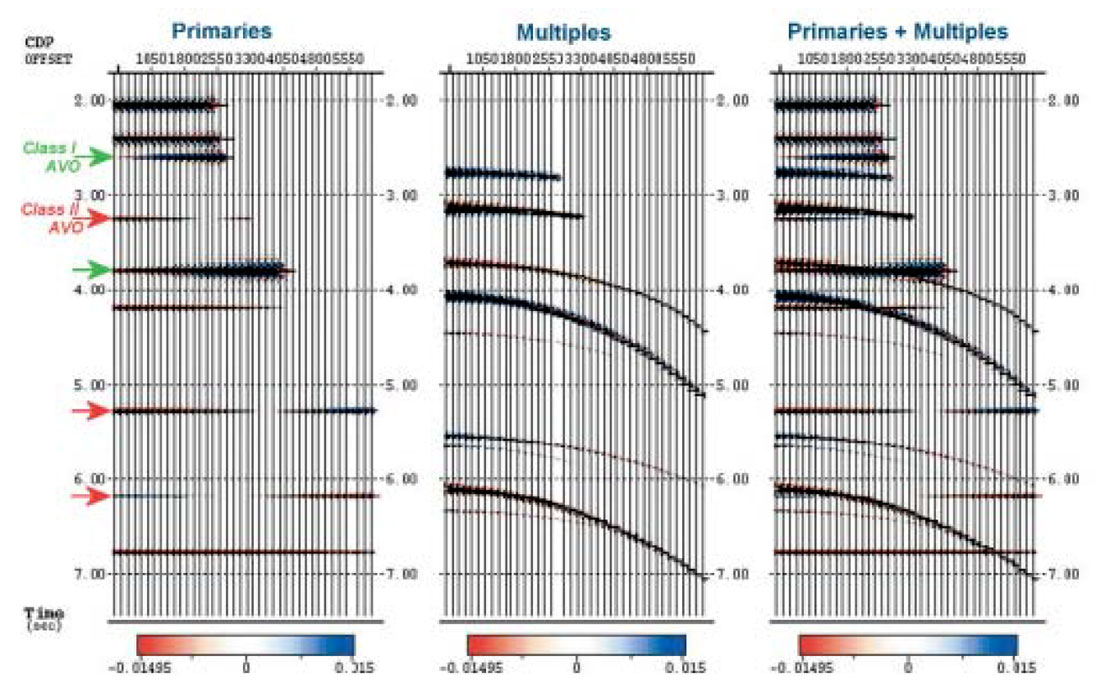
To investigate LIFT’s ability to attenuate multiples and to preserve legitimate amplitude variations of primaries, synthetic pre-stack data was generated from well log data. The synthetic data is a simple convolutional model.
The model is shown in Figure 6 (on page 50). The model includes Class I and Class II AVO reflectors (following Rutherford’s classification, Class I is a gas sand which is higher impedance than the overlying material. Class I AVO is a peak which dims with offset more rapidly than the regional seismic response. Class II is a near-zero impedance contrast gas sand whose reflection amplitude brightens with offset.)
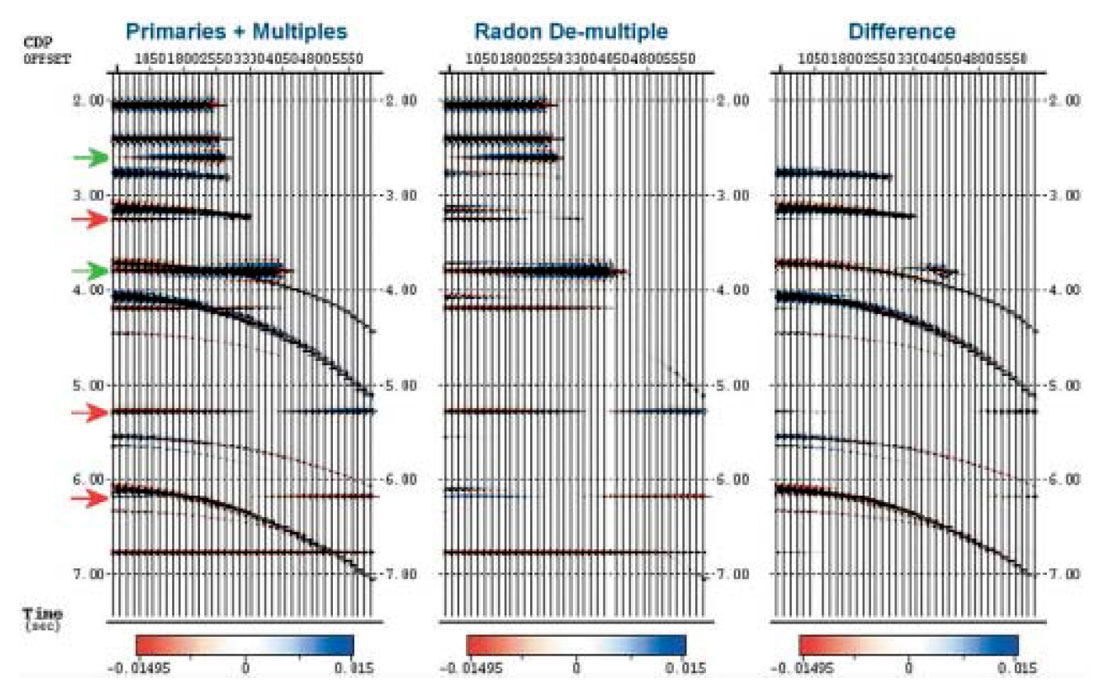
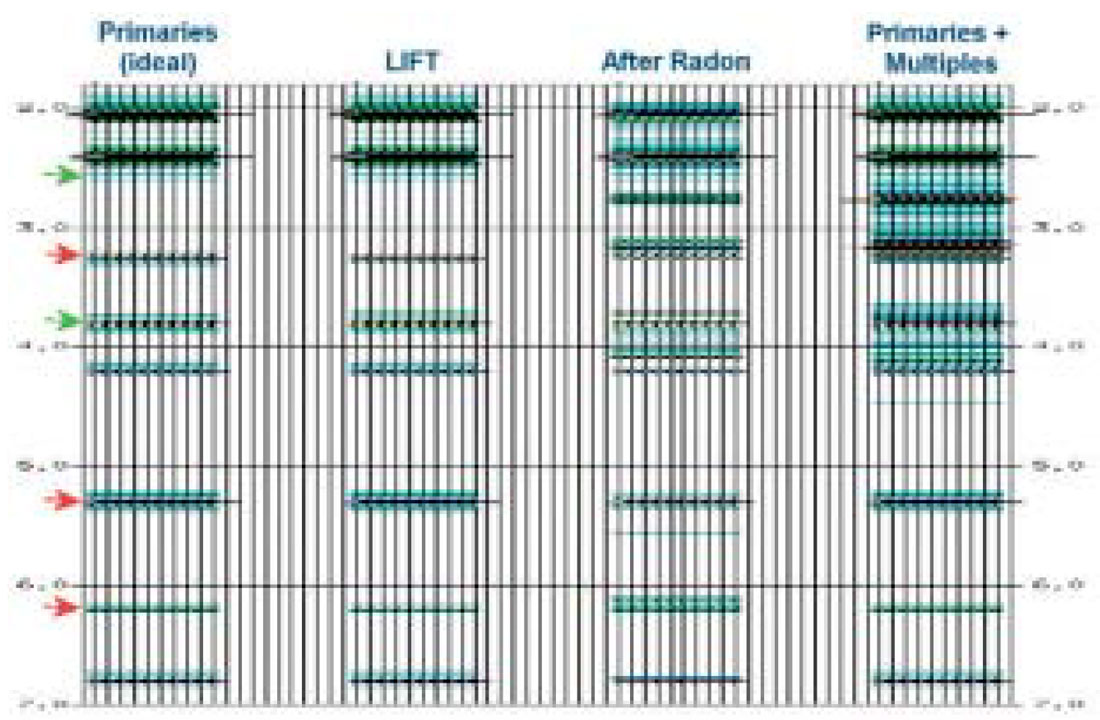
The first step is Radon de-multiple (Figure 7). The Difference display shows that Radon alone does not capture the multiple energy at near offsets, and does not preserve primary amplitudes (note primary energy leakage on the difference display).
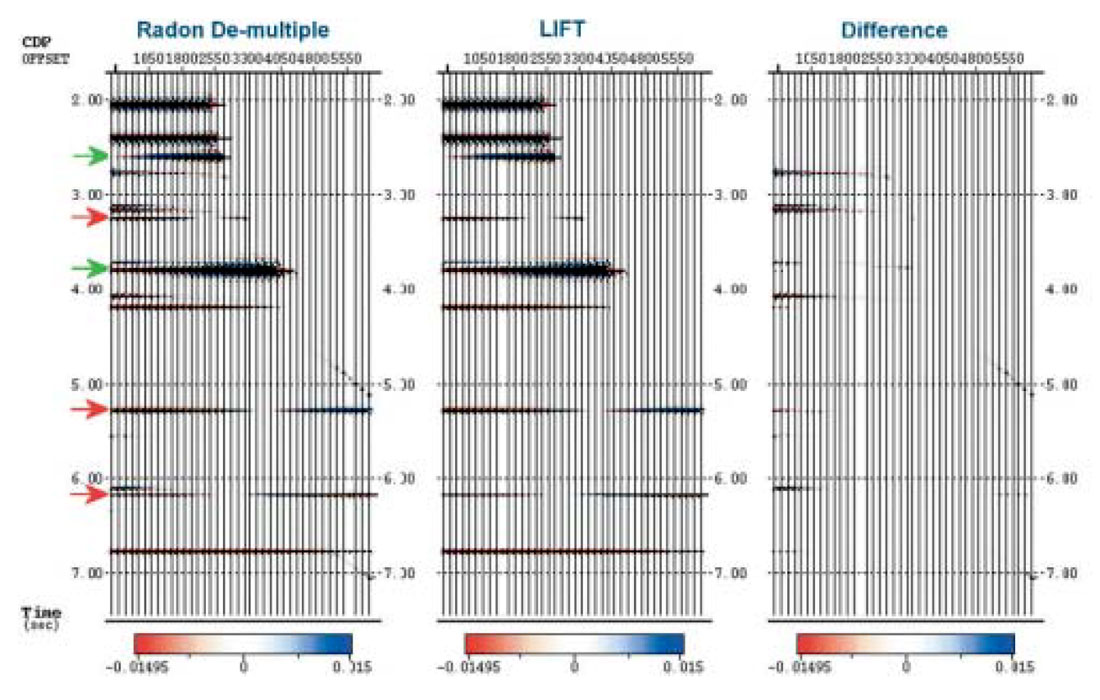
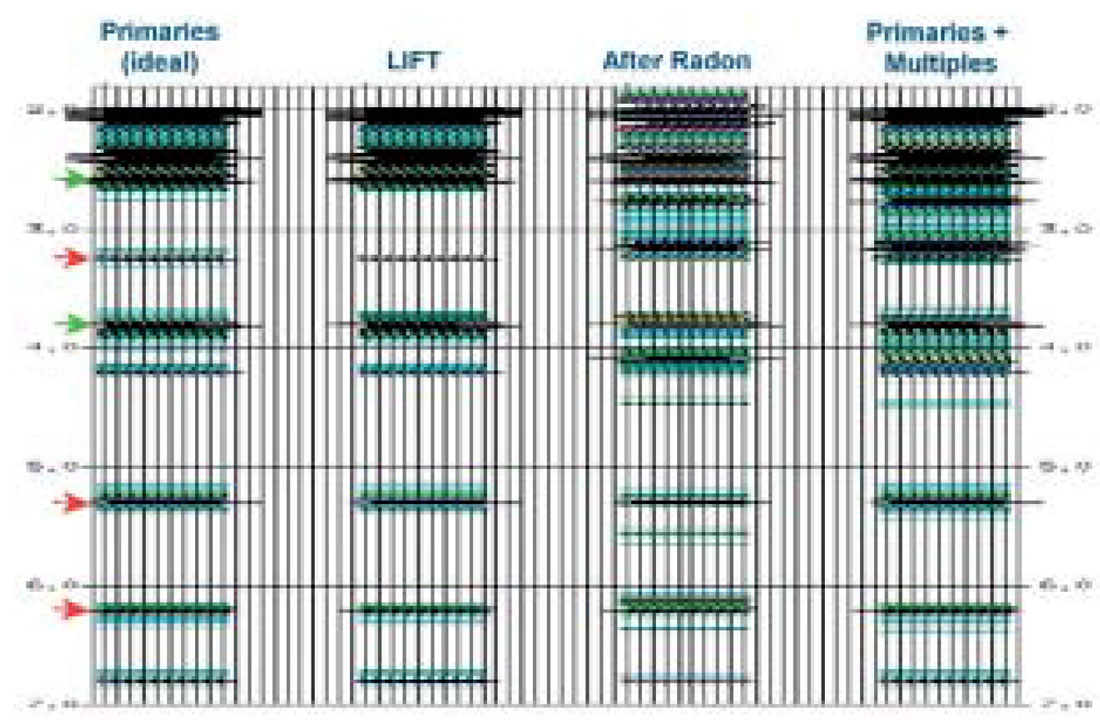
The LIFT technique then effectively removes residual multiple energy that Radon could not attenuate, most notably multiple energy at near offsets. Further, there is very little primary energy leakage (Figure 8).
The ability of the LIFT technique to preserve primary amplitudes is illustrated more clearly on the summary display shown in Figure 9. This display assembles the primaries-only panel and the final LIFT output panel, and shows the difference between the two. The primaries panel is the ideal of what one should be left with if multiples have been removed perfectly. The difference display shows some leakage of primary energy at very far angles (the mute is 45 degrees). Looking back to Figure 7, most of this leakage occurred at the Radon step, suggesting that the Radon parameters be reviewed.
Investigation of LIFT’s implications for quantitative AVO analyses
To investigate the implications for quantitative AVO analyses, Rp and Rs were calculated from the same synthetic pre-stack seismic gather by solving Fatti et al.’s linear approximation of Zoeppritz equations for Rp and Rs (P- and S-impedance reflectivity). Rp and Rs were solved for four different inputs: the primaries-only gather; primaries + multiples gather; the gather after Radon de-multiple, and the LIFT output gather.
Compare the results to those from the primaries-only or ‘ideal’ (Figures 11 and 12). Please note that the Rp and Rs traces have been duplicated ten times for ease of viewing.) Observe that the AVO attributes calculated from the LIFT gather are very close to the values calculated from the primaries-only gather. The reflectivities calculated from the Radon gather and from the raw gather are not very accurate, particularly in the 2.0-4.0 sec zone in this example. Here the t-x curves of the multiples are relatively flat: the multiples look a lot like primaries. The AVO equation was not able to distinguish multiple from primary in this situation. The poor Rp and Rs results calculated from the primaries + multiples gather tell us that something must be done to address multiples prior to AVO analysis. The poor result from the Radon de-multiple tell us that Radon is not sufficient. Application of the LIFT technique enables a more accurate AVO analysis.
Limitations and Weaknesses of the LIFT Technique
Since we need some signal to model, the input to LIFT must have reasonable signal-to-noise ratio. If the S/N is too poor, the LIFT approach will not give any benefit.
Warning: New Techniques May Necessitate a New Look at Interpretations
While restoration of Michelangelos’s frescoes has stirred controversy among art historians (some saying that removing the markings of the passage of time has impoverished the aesthetic experience; others calling it one of the great revelations of our time) it is undeniable that the restoration has transformed the painting into a state substantially different from what was previously known and revered. The editor of The Art Newspaper International, put it this way: “some people liked things to look romantic and old, and can’t cope with the clarity and brilliance of what the Sistine Chapel looks like now it has been cleaned”. The analogy between art and seismic data ends here. Seismic data is not art, and cleaning noise from seismic data should be free of such controversies. Practiced seismic interpreters are not emotionally attached to the aesthetic value of their interpretation. If a multiple is obscuring the real signal, they want to know about it, and they want it to be dealt with properly so they can view the signal, not the previous interpretation of signal that may have been ‘known and revered’.
LIFT is one of those new techniques that may prompt interpretations to be re-evaluated. For example, one may need to (or been thankful to) re-interpret a sub-salt zone after LIFT has attenuated multiples that other methods could not handle. (We know of one such situation, but, as is often the case, the success of the method ironically prevents it from becoming well-known - the interpreter views the technique as a competitive advantage and understandably will not grant permission to show the results.)
We encourage you to give new approaches a try; you might end up seeing seismic in a different way.
A beautiful thing never gives so much pain as does failing to hear and see it.
– Michelangelo

Acknowledgements
The authors wish to thank Yongyi Li for his assistance.


Join the Conversation
Interested in starting, or contributing to a conversation about an article or issue of the RECORDER? Join our CSEG LinkedIn Group.
Share This Article