The Montney formation in British Columbia and Alberta has gained prominence in recent years due to the exploration and production boom which has yielded more than 3.5 bcf/d in production output and in excess of 440 TCF of reserves. It is one of the largest unconventional plays in North America, covering 130,000 km2 with 5600 wells drilled to date. Figure 1 illustrates the Montney reservoir trend and Canbriam’s position in Altares in N.E. British Columbia. Canbriam is a private company currently with 40,000 boe/d producing capacity and a deep inventory of over-pressured, liquids-rich locations with stable, low decline.The map also highlights some of Canbriam’s seismometer and accelerometer arrays in North Altares.
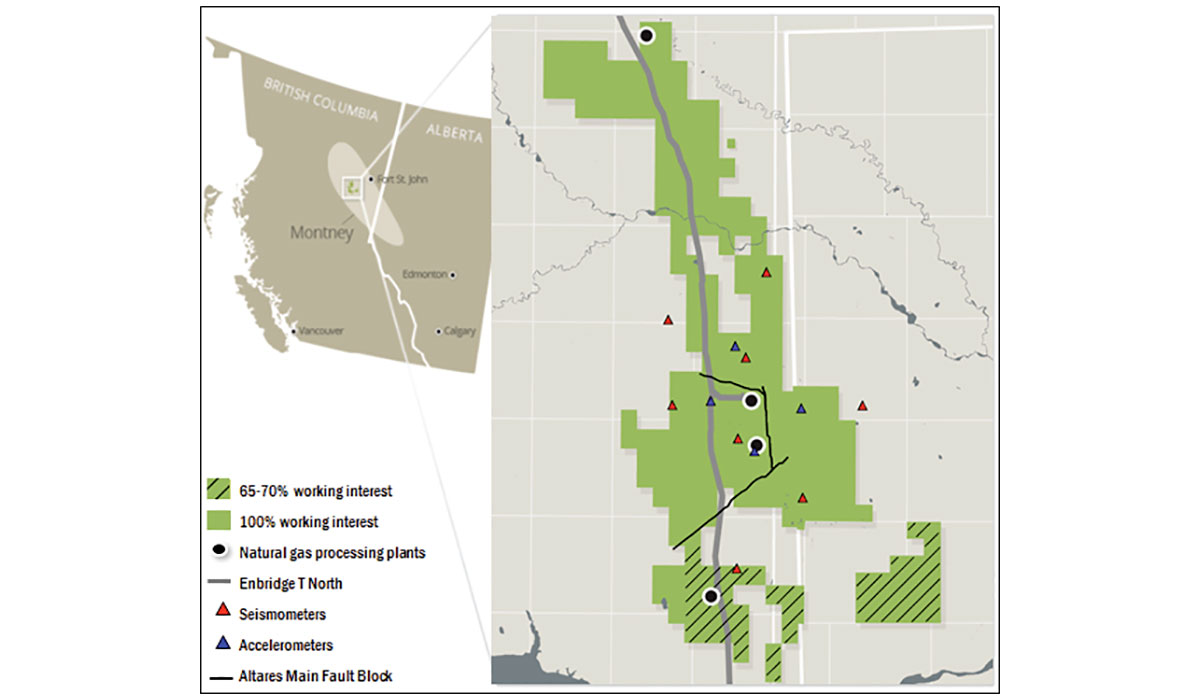
The key to understanding induced seismicity is a thorough understanding of the subsurface. This article describes the multidisciplinary integration at Canbriam which has lead to the creation of an Altares-specific induced seismicity traffic light protocol based on both the seismic event’s magnitude and ground motion recording. The work integrates the subsurface reservoir characterization, including fault/fracture identification, to assist in prediction of induced seismic events during well completions. Operationally, Canbriam has an RTC or ‘request to complete’ process which includes full integration of subsurface and operations. Decisions in these meetings are relayed to the field to ensure any potential risks such as inter-well communication, casing deformation and induced seismicity are well understood.
Introduction
Canbriam has been monitoring induced seismicity since early 2015 with a backbone array of seismometers. Additional accelerometers have been added to better monitor ground motion. The array is real-time capable with Mc <0.5 ML and <500 m hypocentre accuracy. This array, together with some temporary dense arrays, have enabled Canbriam to optimize completions and mitigate induced seismicity in sixty-five wells, having only three pads (two belonging to Canbriam) with frac-related events exceeding 2 ML since array inception in 2015. Of all recorded seismicity in Altares only 0.49% has exceeded 2 ML.
Examples
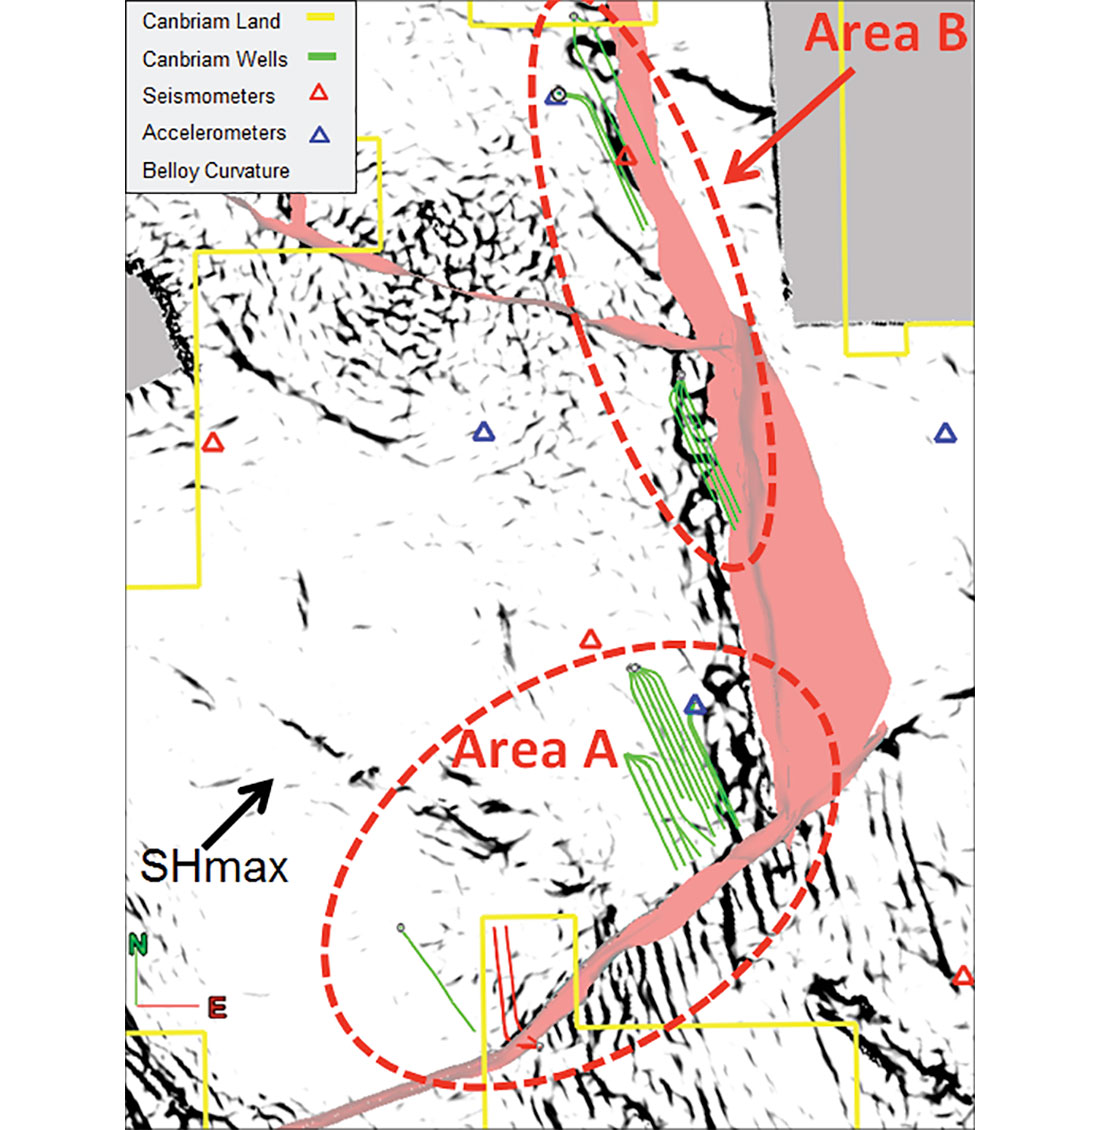
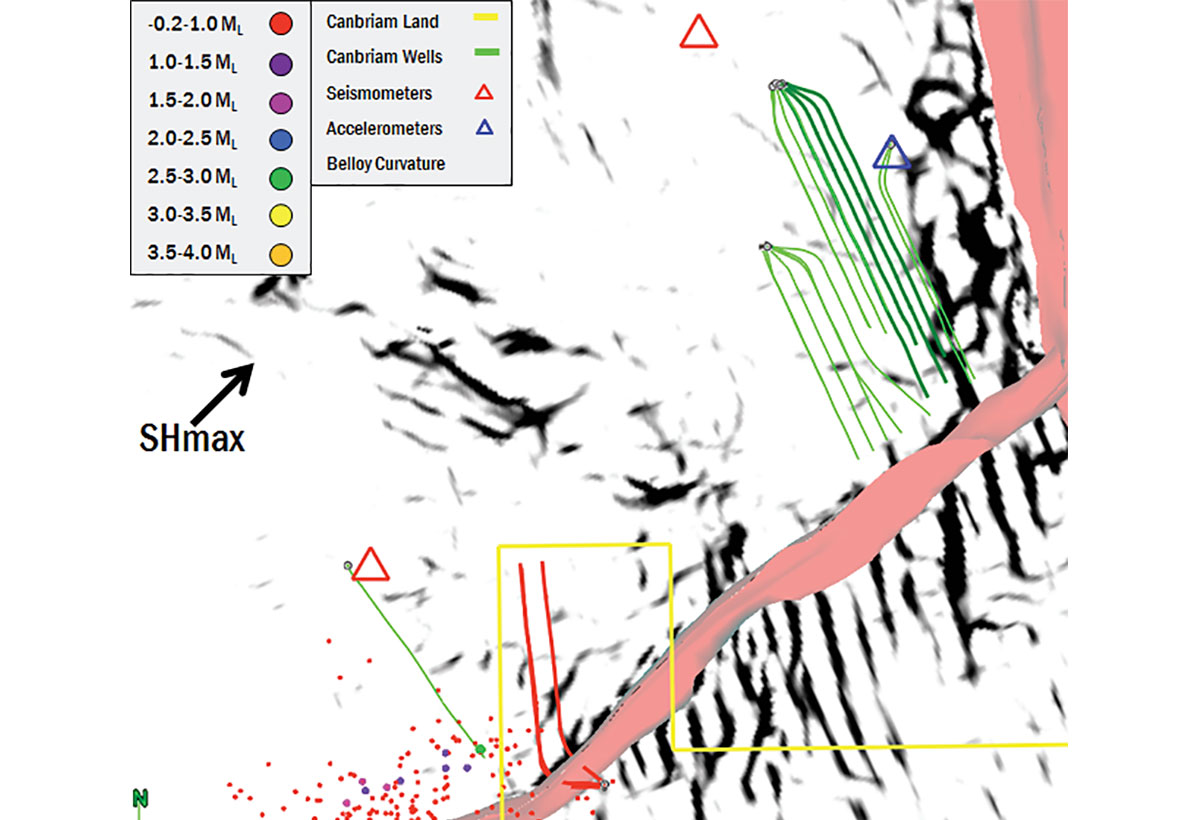
A selection of North Altares Montney completion case studies are presented in this article. These examples illustrate the application of the integrated subsurface work combined with seismic events from the monitoring array to make operational decisions while completing the horizontal wells. Figure 2 illustrates the study areas A & B, in which wells on pads have been completed and which demonstrate the often predictable nature of induced seismicity.
Area A Case Studies
The first examples are from Area A pad wells highlighted on Figure 2. This shows both Canbriam Montney completions in green, as well as completions by another operator in red, all bounded to the south by a large strike-slip fault.
Firstly, Canbriam area A wells, shown in green on Figure 3, were part of a July 2016 Canbriam completion campaign.
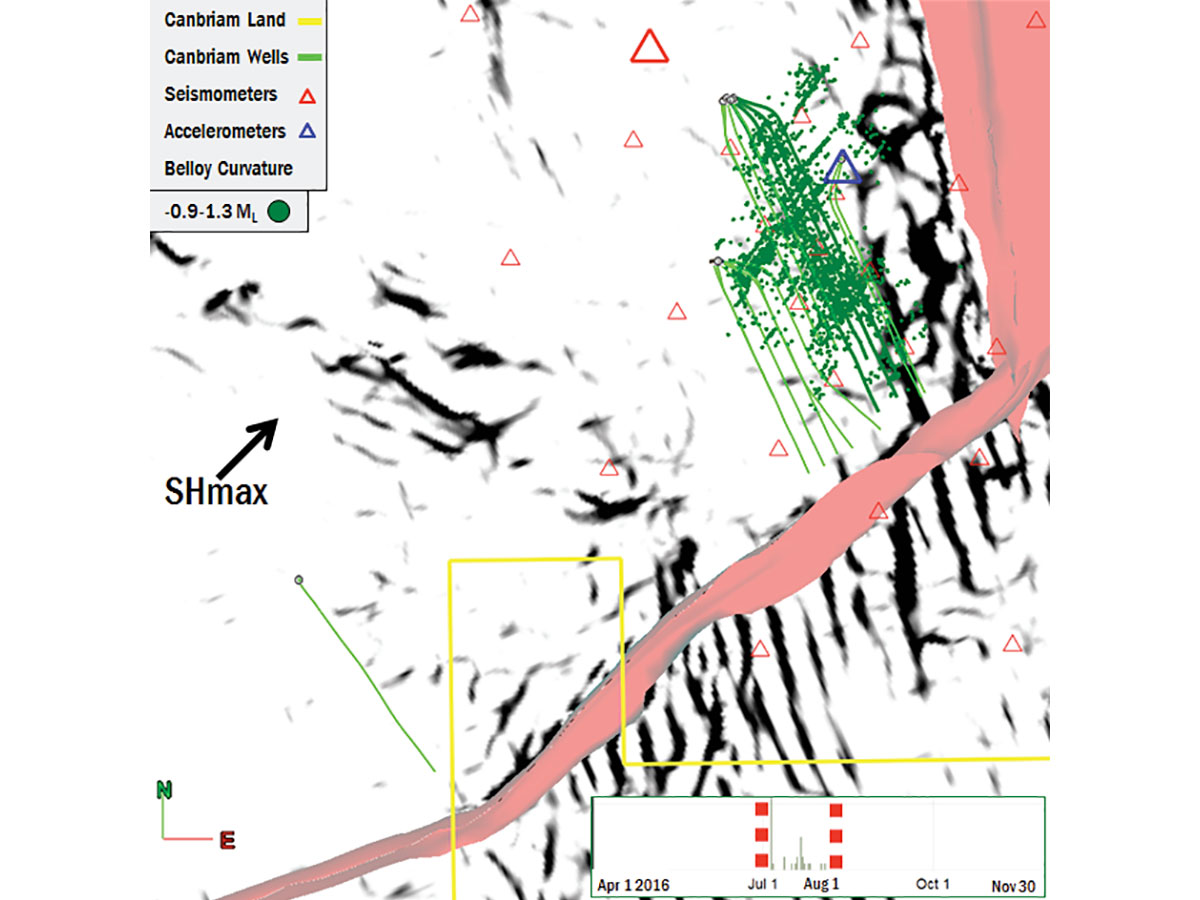
Canbriam drilled and completed seventeen wells in the Montney in area A, with the wellbore toes drilled near to, but never into or across the large strike-slip fault. The minimum buffer distance was approximately 250 m from the expression of the major fault from the 3D seismic. Directionally, the fault is parallel to the maximum horizontal stress direction. There was no recorded seismicity >2 ML during Canbriam completions operations here. Figure 3 highlights an example where we added an additonal 29 surface seismometers to our backbone array. With the added resolution that this gave, we recorded 2556 events from the completion of four wells (dark green) during these July 2016 operations. The events recorded were between -0.9 ML and 1.3 ML with over 90% of the recorded seismicity occuring during the completion stages. Figure 4 displays the calculated b-value of this cluster as 1.94, which suggests the events were related to stimulation and there was little evidence of events being recorded along the faults. The completion timing is shown by the red dashed lines with the event frequency bars displayed in green (inset into Figure 3). It’s clear to see from these completions there was no seismicity occuring after the completion operations on August 1st.
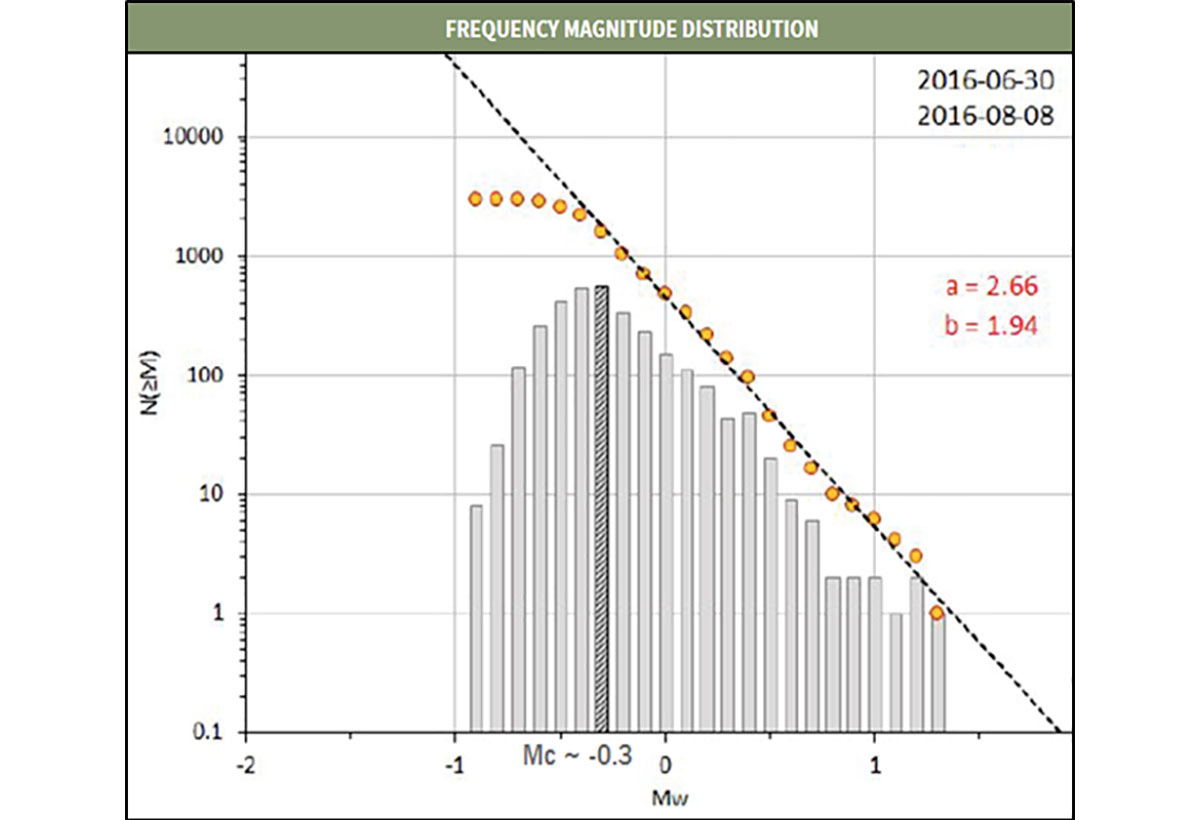
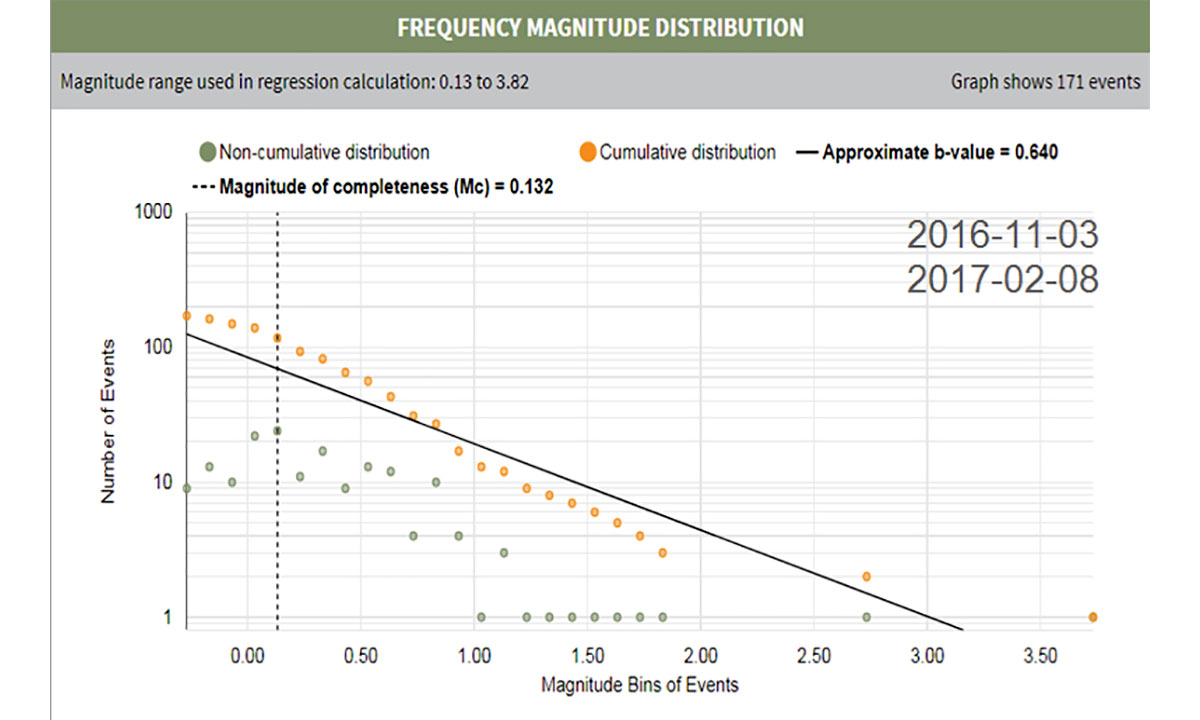
Figure 5 below illustrates the induced seismicity events associated with the completion operations by this operator. Canbriam added an extra seismometer to its backbone array (red triangle) in order to better locate any resulting induced seismicity events resulting from the completions. “Zipper” fracking was used and as the completions neared the heels of the wells, induced seismicity event frequency and magnitude increased rapidly close to the strike-slip fault. Two large events occurred, 2.78 ML and 3.82 ML , at the heel. Post-frack events were observed consistently for more than a month along the strike-slip fault. In addition, work was performed to evaluate the b-value associated with the recorded seismic events. The ‘b’ plot indicated a slope <1, which is likely to be associated with fault movement rather than ‘man-made’ activity, shown in Figure 6.
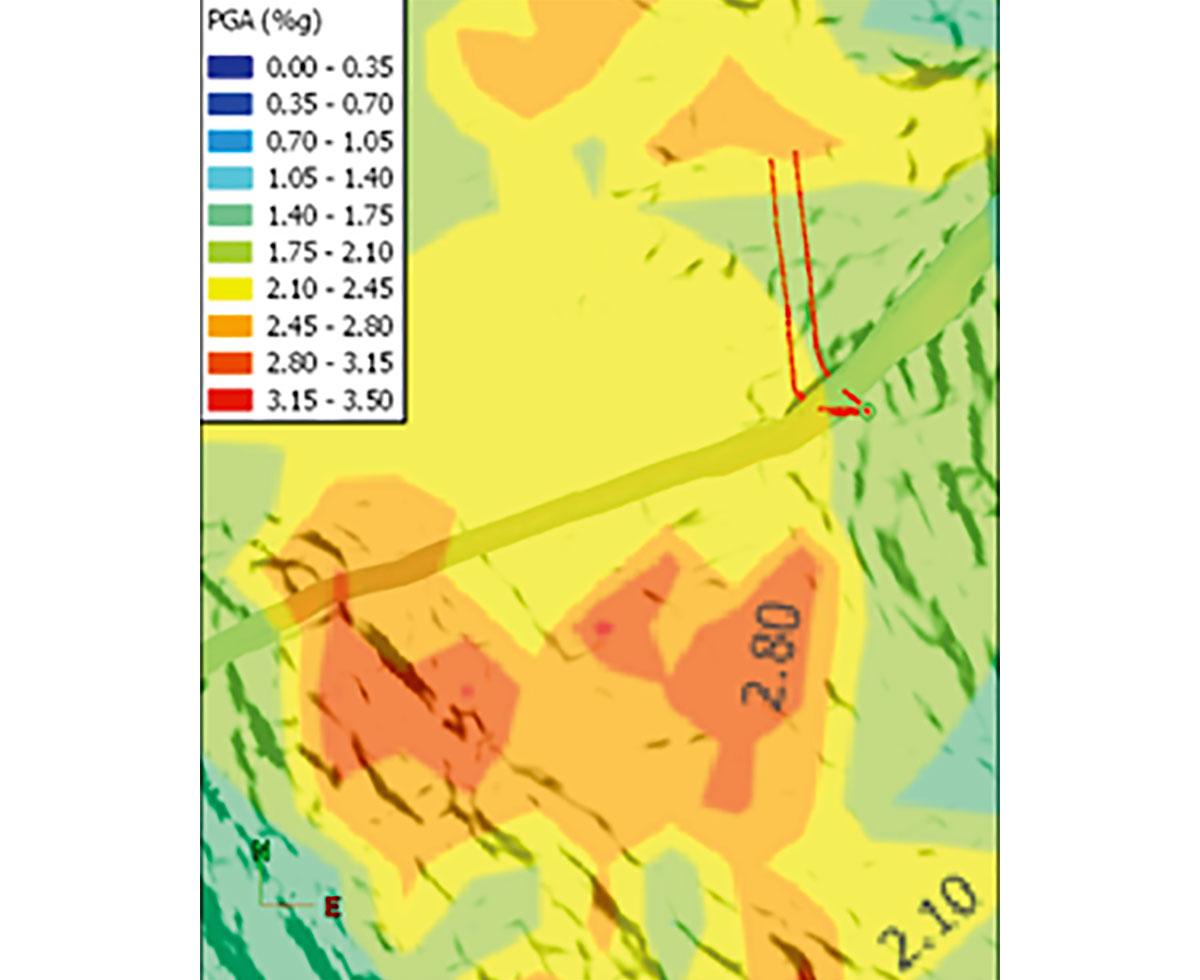
Shake maps were also constructed, post-job, to evaluate the ground motion associated with the largest (3.82 ML) event using an Altares-specific ground motion prediction equation (GMPE) and site amplification map. The surface motion exceeded the BCOGC’s 2017 notification threshold of 2%g peak ground acceleration (PGA). The resulting ‘shake map’ is illustrated in Figure 7.
Area B Case Studies
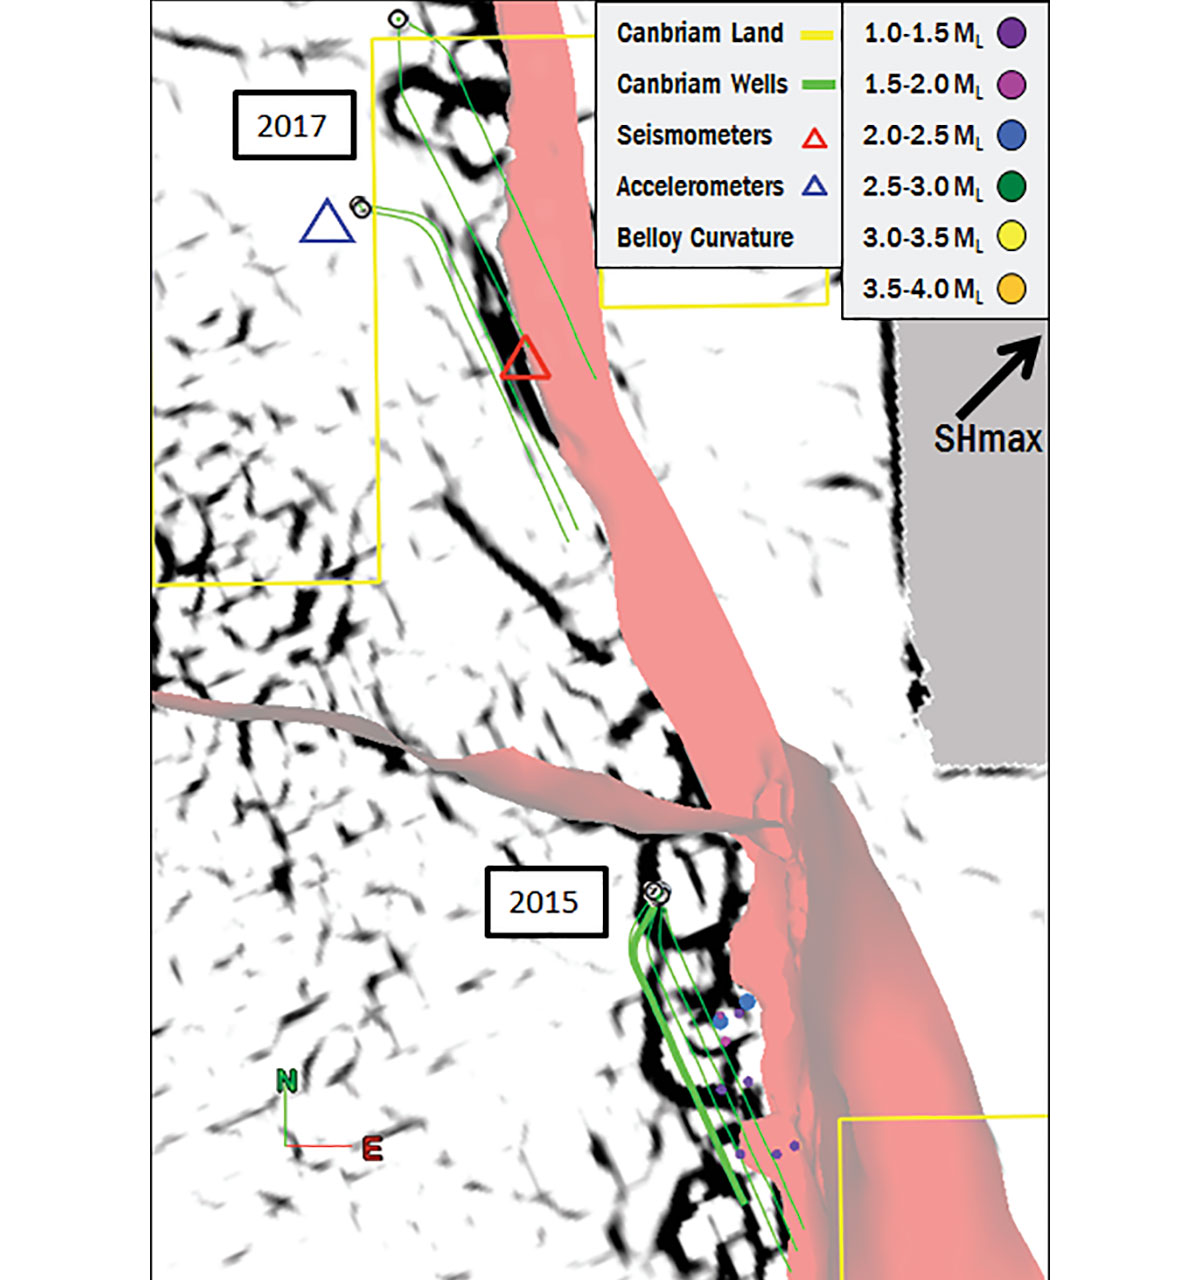
Next, within area B, the completions on two Canbriam pads are detailed; firstly, a pad drilled in 2015 from which there were several learnings and secondly, a pad completed in 2017 to which these learnings were applied. Note that both completion campaigns were discussed in detail at their respective Canbriam RTC meetings prior to the operations commencing. Figure 8 shows the two areas, wells and faults. The wells on both pads are similar in that they were drilled parallel to and >200 m away from a large thrust fault to the East which runs perpendicular to regional maximum horizontal stress. In addition, there is a strike-slip fault trending approximately E-W, giving rise to two compartments in the area.
In 2015 in Area B, Canbriam completed four wells - shown in green on Figure 8 below.
The four ‘plug and perf’ wells completed on the Pad were, in order of timing, a Lower Montney, followed by three Upper Montney wells. During the Lower Montney completion, two seismic events greater than 2.0 ML were observed. This triggered Canbriam’s 2015 internal traffic light protocol (TLP). Near-real time monitoring of events allowed both field and Calgary, when >2.0 ML events were recorded, to immediately reduce treating rate and corresponding pressure on subsequent stages. Note that this TLP has since been modified to be in line with BCOGC requirements for ground motion rather than magnitude. No further events >2.0 ML were observed for the remainder of the Lower Montney completions using the reduced treating rate and pressure. Next, three additional wells were completed in the Upper Montney at ‘normal’ treatment pressure with no events >1.0 ML. This is consistent with the Canbriam model of the Lower Montney being more prone to seeing deeper pre-existing natural fractures, which results in higher levels of induced seismicity.
These larger faults/fractures appear not to propagate higher in the section and tend to die out in the Upper Montney, probably as a result of differing mechanical properties and stresses between the two formations.
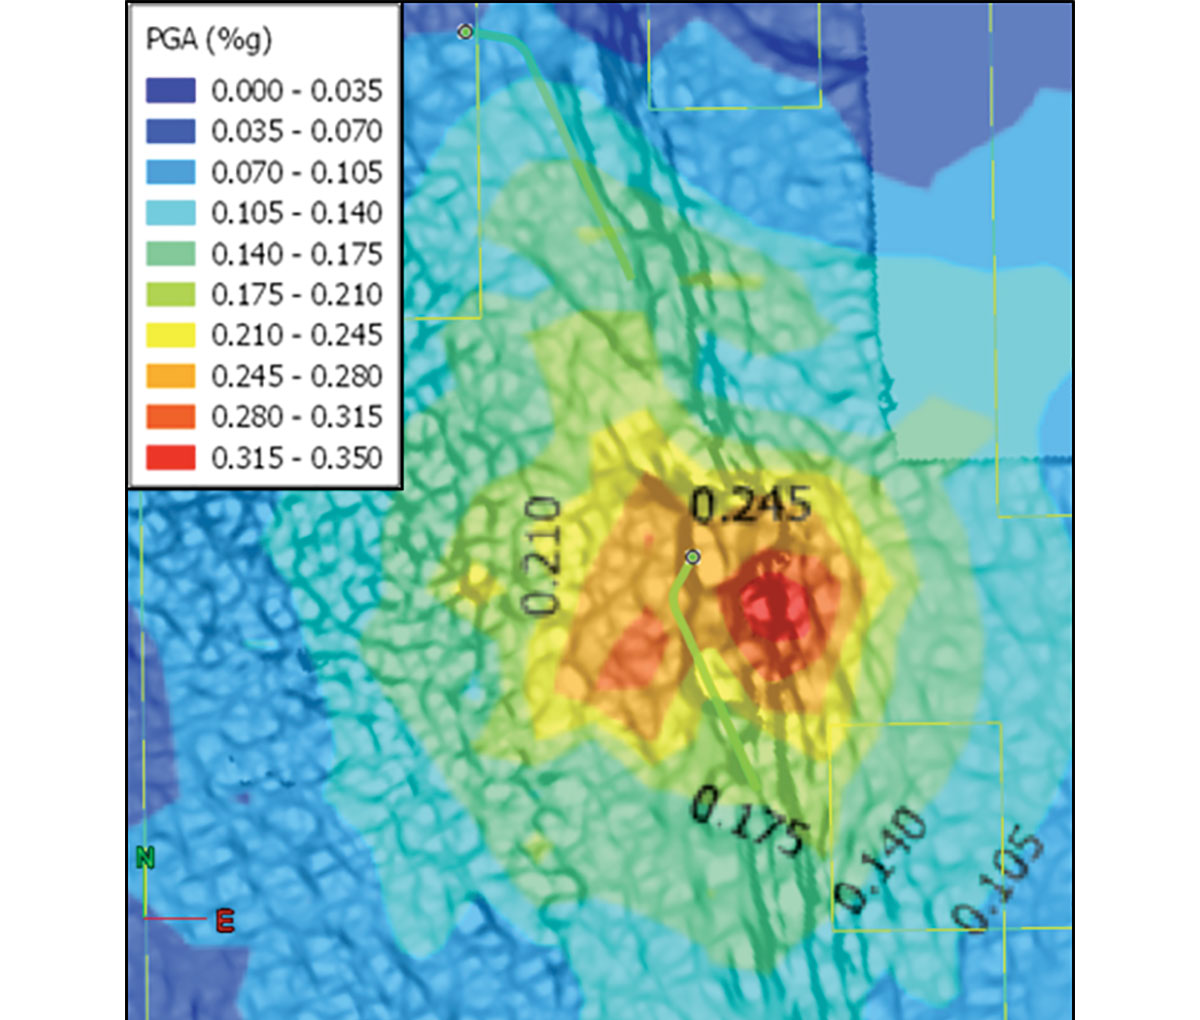
By combining an Altares specific ground motion prediction equation and site amplification map a recorded shakemap of a 2.31 ML event from the Lower Montney completion was created. As displayed on Figure 9 below, the resulting ground motion did not exceed 0.35%g.
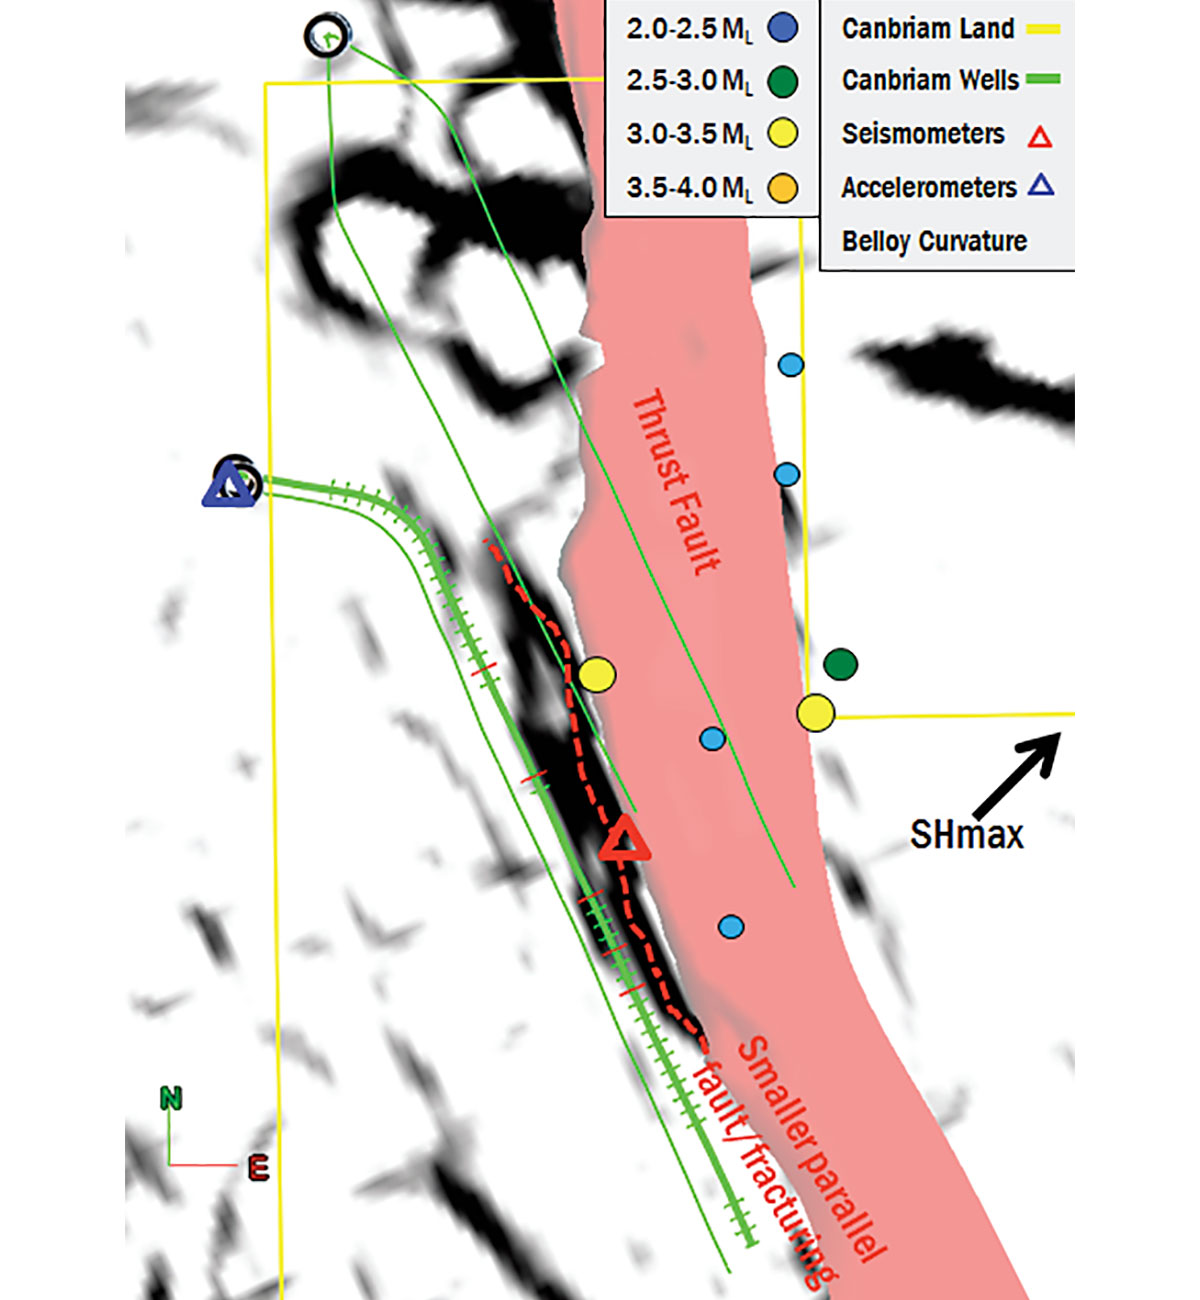
In 2017 in Area B, Canbriam completed 4 wells – shown in green on Figure 10.
The Lower Montney was completed first, followed by three Upper Montney wells. The wells were in a similar position to the previous pad in relation to the large thrust fault. Learnings from the 2015 work were incorporated into the completions planning in Calgary and the field operation. Notably, there was an expectation that completions in the Lower Montney may give rise to larger induced seismic events than those in the Upper Montney, being closer to the deep seated structures with their associated fractures. This and the proximity of the wells to the thrust fault were considered to pose a higher risk of induced seismicity in the pre-job ‘request to complete’ (RTC), where detailed subsurface reservoir characterization is used to plan possible seismicity outcomes.
Note that accelerometers were added in 2016 and ground motion mapping (shake-maps) are implemented routinely using the GMPE and surficial geology maps previously developed using seismometer data from our backbone array and dense arrays during completion activity.
The toe third of the Lower Montney well was completed using sliding sleeves with no induced seismicity >1.0 ML. As the completions moved closer to the smaller fault, shown with the dotted red line in Figure 10, induced seismicity was anticipated as this is likely to be connected to the thrust fault. Without precursor events, a magnitude 3.27 ML event was recorded, shown in yellow on the thrust fault in Figure 10. Once again (first time since 2015), this triggered Canbriam’s traffic light protocol. The BCOGC was notified and pump rate, tonnage and maximum treating pressure were reduced. Following this, another 6 sleeves were completed at the lower rates and continued to see seismicity >2.0 ML. Several sleeves that were closer to the fault were then skipped and four more sleeves were fracked.
During this time, two larger events were seen with magnitudes 2.78 ML and 3.33 ML respectively. Both appeared to be on the thrust fault, shown on Figure 10 with closely spaced green and yellow dots. At this point the frac job was shut down and moved to the first Upper Montney well. This was to allow the increased pressure due to the stimulation in the Lower Montney time to dissipate.
This Upper Montney well was completed in its entirety with no seismic events >1.0 ML.The crew returned to the Lower Montney well and completed it with no events >1.0 ML. Based on recorded surface pressure, the fracture network (natural and stimulated) had bled down to a level that reduced the intensity of subsequent events.
As with Area A, shake maps were produced in Area B for the larger induced seismicity events. The same Altares-specific ground motion prediction equation and site amplification map were used.
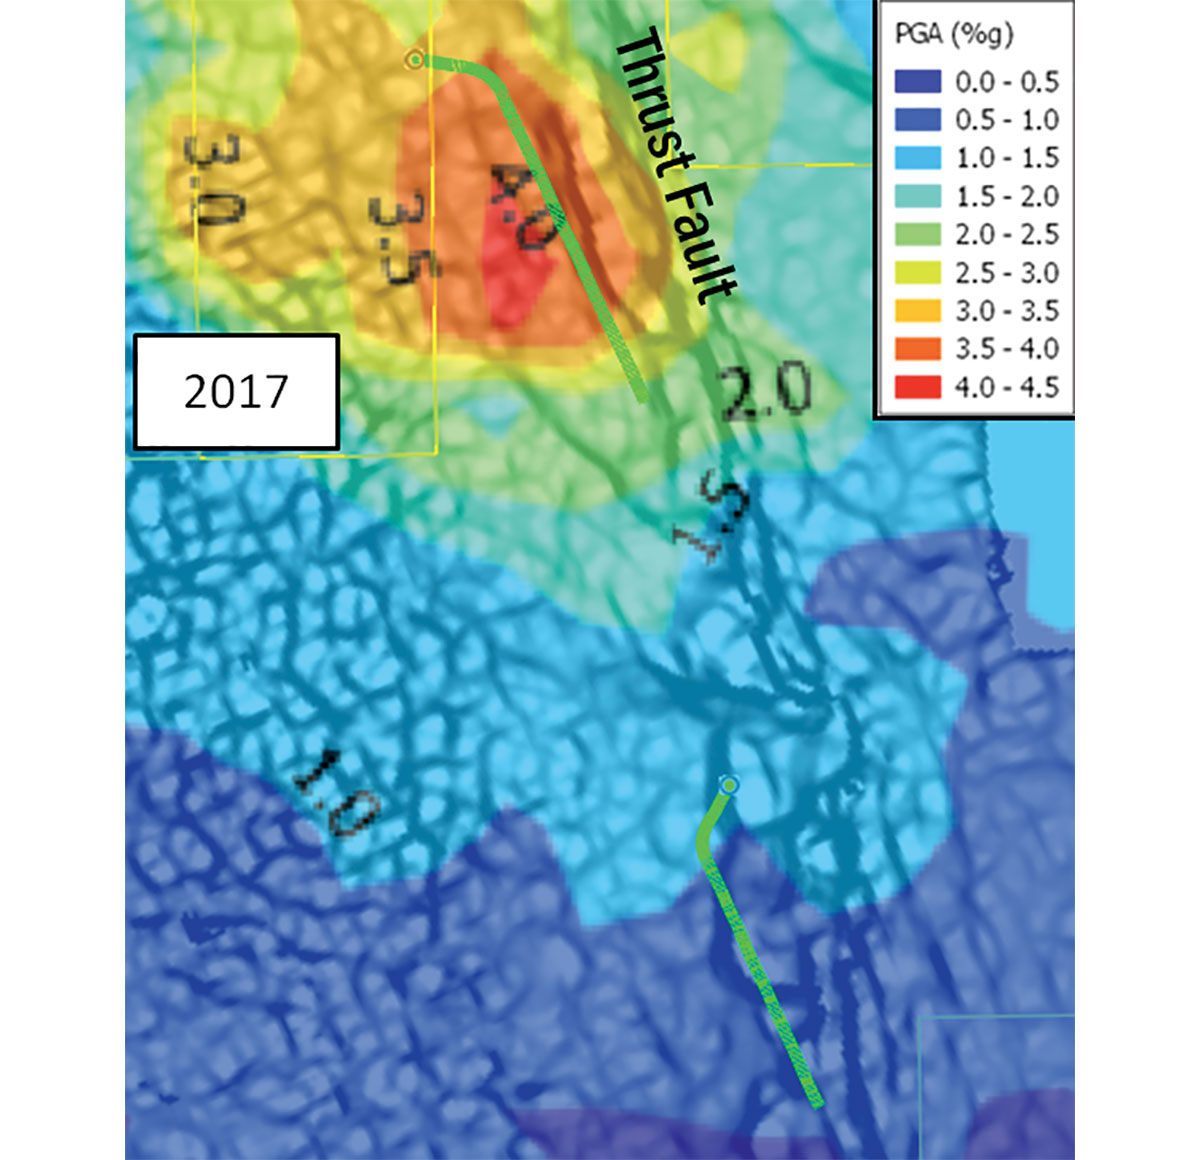
Figure 11 illustrates the shake map for the 3.33 ML event in 2017. This event lead to a peak ground acceleration >2%g, which was the BCOGC notification limit at that time. These shake maps have allowed Canbriam to calibrate induced seismicity in Altares to understand what the ground motion will be corresponding to event magnitude, and thereby produce a more refined TLP. Specifically, by modelling ground motion threshold scenarios (currently based on 2018 BCOGC notification threshold of 0.8%g PGA), Canbriam is able to determine a more accurate corresponding magnitude value to better assess risk.
Ground Motion Based Protocols
The fifth and final case study example is shown in Figure 12 in Area A. Prior to completions, by incorporating our ground motion prediction equation with site amplification map, we can apply a ground motion threshold at the location and depth we are completing wells to more accurately understand the potential magnitudes that would result in unwanted ground motion. With the BCOGC’s updated submission threshold of 0.8%g, we ran a threshold scenario of a 10% probability of exceeding the target ground motion level of 0.8%g. The corresponding magnitude estimate at depth of hydraulic fracturing near the toes of the wellbores (closest to large strike-slip fault) was 2.29 ML. This means that if a 2.29 ML event were to occur, it would exceed 0.8%g 10% of the time.
Prior to completions, this magnitude was flagged as a notification priority in Canbriam’s RTC process. Due to the previous learnings from Area A, we assessed a low risk to this completion as the wellbore toes were deliberately stopped short of the major strike-slip fault, and all four wells were Upper Montney completions.
As predicted, the four Upper Montney wells (dark green on Figure 12) were completed with no events >2 ML and no events that exceeded 0.8%g. This ‘no recorded event’ scenario >2 ML in the Upper Montney is the norm over the Altares field area.
Conclusions
The backbone seismometer and accelerometer array has allowed us to produce robust ‘shake maps’ based upon ground motion.
This in turn, has enabled us to define an Altares-specific ground motion traffic light protocol (TLP), using PGA data which is implemented before completions. This implementation has been discussed for the hydraulic fracture operations shown in Figure 12.
Lower Montney completions can be expected to generate higher magnitude induced seismicity events and should be handled accordingly in pre-completions planning.
The ability to picture the subsurface using the 3D seismic and induced seismicity events recorded from the backbone array gives Canbriam a predictive capability for pre-drill and completions planning. In addition, an understanding of the size of and proximity to the larger faults in the area leads to the technique of pressure dissipation in the Lower Montney. So far, our predictive work has indicated “big faults” can have potentially “big induced seismicity events”.
Finally, it should be noted that 63 out of 65 wells completed by Canbriam exhibited no induced seismicity greater than 2.0 ML and in fact events are usually less than ML=1.0.
This can be attributed in large part to our excellent understanding of the subsurface and close integration with the Operations team.

Acknowledgements
The authors wish to acknowledge Canbriam Energy for permission to show this work. In addition, we would like to thank all the members of the Subsurface and Operations teams for their contribution to this work. Thanks to Seitel for permission to show 3D seismic derivatives. Thanks are due to Nanometrics for backbone array services and ground motion processing.


Join the Conversation
Interested in starting, or contributing to a conversation about an article or issue of the RECORDER? Join our CSEG LinkedIn Group.
Share This Article