Abstract
Magnetic mineral variations can be sensitive indicators of changes in sediment source, transport mechanism, and depositional environment. Applying a number of different magnetic property measurement techniques it is possible to detect magnetic mineral content, composition and grain size changes. The result is a quantitative expression of lithological changes, or magnetostratigraphy. Used in the Athabasca Oil Sands, this approach permits detailed correlation between adjacent cores, identification of depositional sequences, and possible numerical lithology discrimination.
Introduction
The Lower Cretaceous McMurray Formation, which contains most of the bitumen reserves of the Athabasca Oil Sands comprise uncemented quartz sands interbedded with siltstone, shale, and locally ironstones. The depositional environment of the McMurray drainage basin temporally evolved temporally through a series of progressive on-lap sequences from an initial fluvial system, through an estuarine phase, and finally to a fully submerged marine depositional system. During the early stages of the McMurray deposition the sedimentation was associated with meandering fluvial channels that were migrating across a slowly submerging floodplain. A consequence of this complex deposition environment is the juxtaposition of laterally dissimilar lithofacies. Horizontal continuity of lithofacies is limited, and sand body geometries are many and varied. Due to the strong correlation between sand facies and oil grade, developing methods for pre-extraction prediction of sand body geometry has important economic implications.
Pre-extraction approaches involve paleoenvironmental reconstructions, which are commonly based on geological logging of cores, and the use of borehole geophysical techniques. Core-logging techniques require the extraction of coherent cores on a regular grid throughout the proposed extraction area. The geology of each individual core is then mapped in terms of silicate mineral compositional and grain size fluctuations. Sedimentary structures where present are also used to help separate individual lithological units. The most common logging tool is the total gamma probe. Typically, this is used to differentiate between sand and shale rich horizons based on the strong signal associated with the potassium in the shales.
Litho-Magnetostratigraphy
In this note we outline an alternative magnetostratigraphic based approach to lithological unit discrimination. Magnetostratigraphy usually invokes the use of magnetic reversal zones to identify globally synchronous time surfaces. However, over the past few years it has been recognized that the magnetic mineral characteristics of a unit volume of sediment can contain information that directly reflects changes in sediment source provenance, sediment transport mechanisms, the depositional environment, and even the presence of post-depositional fluid alteration. Such litho-magnetostratigraphic studies have been used in a wide range of settings: mapping contaminated sediments in a restricted lake basin (Versteeg et al., 1995); and demonstrating the effect of diurnal wind direction fluctuations on the transport of industrial contaminants (Morris et al., 1995). A more comprehensive explanation of the methods and applications of environmental magnetism studies are given in books published by Thomson and Oldfield (1986), and more recently Evans and Heller (2003). Following a study of 55 samples Ellwood and Pemberton (1984) were the first to recognise that perhaps magneto-stratigraphic methods might offer an “alternative method of correlation and interpretation… to delineate the complex depositional and post-depositional history” of these Oil Sands. Ellwood and Pemberton (1984) further suggested that to use magnetostratigraphic methods “the magnetic properties of oil sand samples must be well understood.”
A geologist logging core is required to answer a number of questions primarily based on their visual qualitative assessment of fluctuations in the silicate minerals in the sediment sample. Generally these questions centre around describing: a) what minerals are present; b) the relative proportion of each of the mineral phases; and c) the average grain size of each mineral. Using a litho-magnetostratigraphy approach one attempts to address these same questions using a series of different magnetic measurements. Magnetic susceptibility is a measure of the ability of a sample to become magnetised in an applied field. Each magnetic susceptibility measurement reflects the summation of contributions from variations of three characteristics of the magnetic mineral content of the sediment sample: a) mineral composition, b) mineral content, and c) mineral grain size. The primary contribution to any magnetic susceptibility observation in sediments is dominated by the presence of ferromagnetic minerals such as magnetite, hematite, and pyrrhotite. Of all these, magnetite has the strongest magnetisation value per unit volume. Paramagnetic minerals, such as some clays and chlorites, while having a much lower per unit volume response are often present at a higher concentration. Detailed studies of different magnetic mineral grain size fractions have shown that magnetite grains with a grain size of around 50 microns have a bulk magnetic susceptibility that may be up to 1.5 times the susceptibility of <10 micron magnetite. However, it is definitely variations in magnetic mineral content that dominate the susceptibility signal.
Studies of magnetic susceptibility variations in material varying from altered Archean granites to lake sediments have shown that bulk susceptibility values conform to log-normal population distributions (Lapointe et al., 1985). In cases where there is a sufficiently large observational base and where there are discrete populations (as opposed to broad overlapping populations) it is possible to estimate the bounds between individual populations using probability plots. Using only susceptibility measurements it is not possible to estimate the relative impact of the three variable parameters. To derive this information additional measurements are required. A number of approaches are possible. Ellwood and Pemberton (1984) emphasised the use of anisotropic magnetic susceptibility (magnetic fabric) measurements. Other possible approaches include saturation remanence (Isothermal Remanence measurements) : applying a strong DC field and then measuring the resulting remanence signature will help to highlight compositional differences. If only magnetic mineral content varies then a plot of susceptibility versus saturation remanence should define a simple straight line. For the ferromagnetic mineral contribution it is possible to separate magnetite from hematite contributions by using a procedure based on the contrasting coercivity properties of these minerals. Anhysteretic remanence (ARM) is the magnetisation acquired by a sample when exposed to a constant DC magnetic field in the presence of a decaying AC magnetic field. As shown by King et al., (1982), the ARM signal bears a relationship to fluctuations in magnetic mineral grain size.
A combination of these various observations therefore could potentially provide a magnetic based method for differentiating lithologies on the basis of changes in magnetic mineral content, magnetic mineral composition, and magnetic mineral grain size. In this note we use this magnetic approach to address three questions:
- Is it possible to use this approach to establish detailed lithological correlations between adjacent boreholes?
- Does the magnetic method provide signatures diagnostic of specific sedimentary processes, like gamma and resistivity?
- Is it possible to use this approach to quantitatively identify specific lithologic types?
Data Source
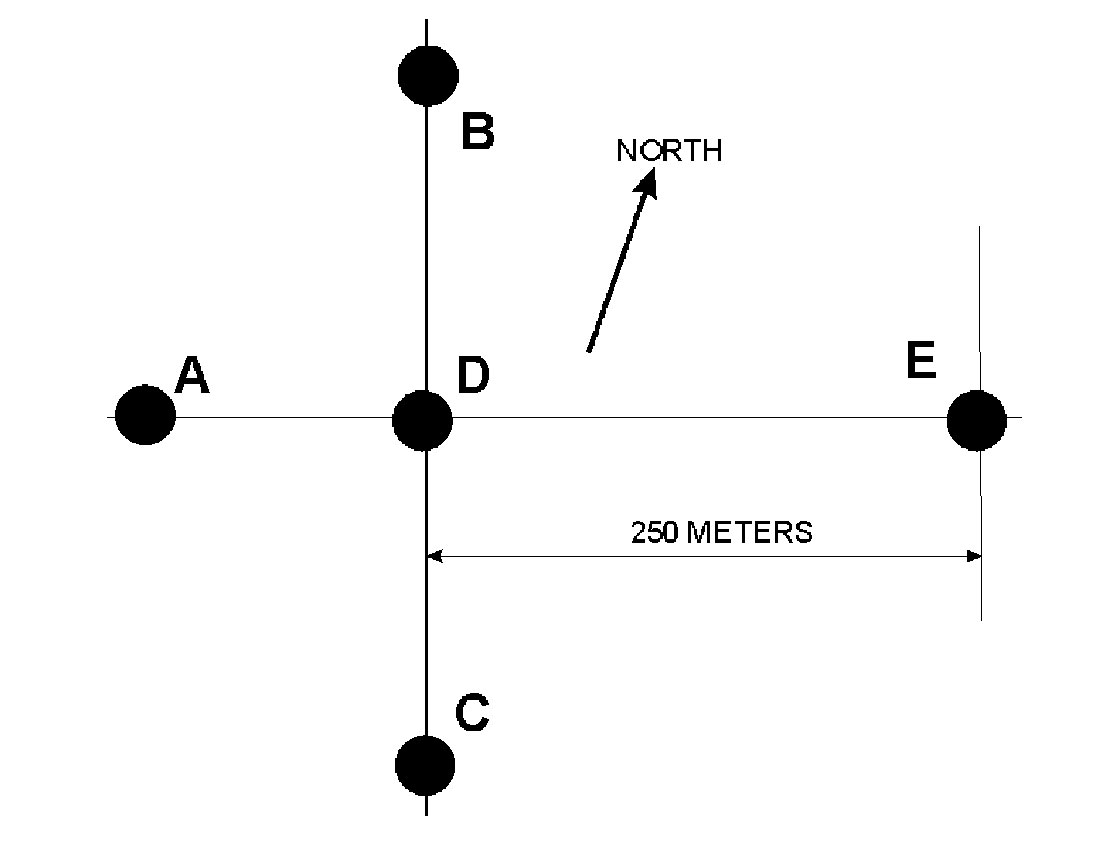
The results presented in this note are based on a study of five adjacent cores from the Athabasca oil sands (Figure 1). The maximum spacing between boreholes is 260m. Two types of measurement were performed on the core. Firstly, each of the five cores was logged at a 10cm increment using a Bartington MS2 susceptibility meter with the C (core logging) sensor coil. Secondly, to complete the additional measurements we extracted transverse samples from the core using a simple hydraulic press. A total of 500 samples were extracted from the five cores, corresponding to samples at approximately 40cm intervals along each core. Subsequently the saturation remanence, coercivity, and anhysteretic remanence of each sample was measured using a combination of Molspin spinner magnetometer, Schonstedt AF demagnetiser, and ASC pulse magnetiser.
Results
Correlation
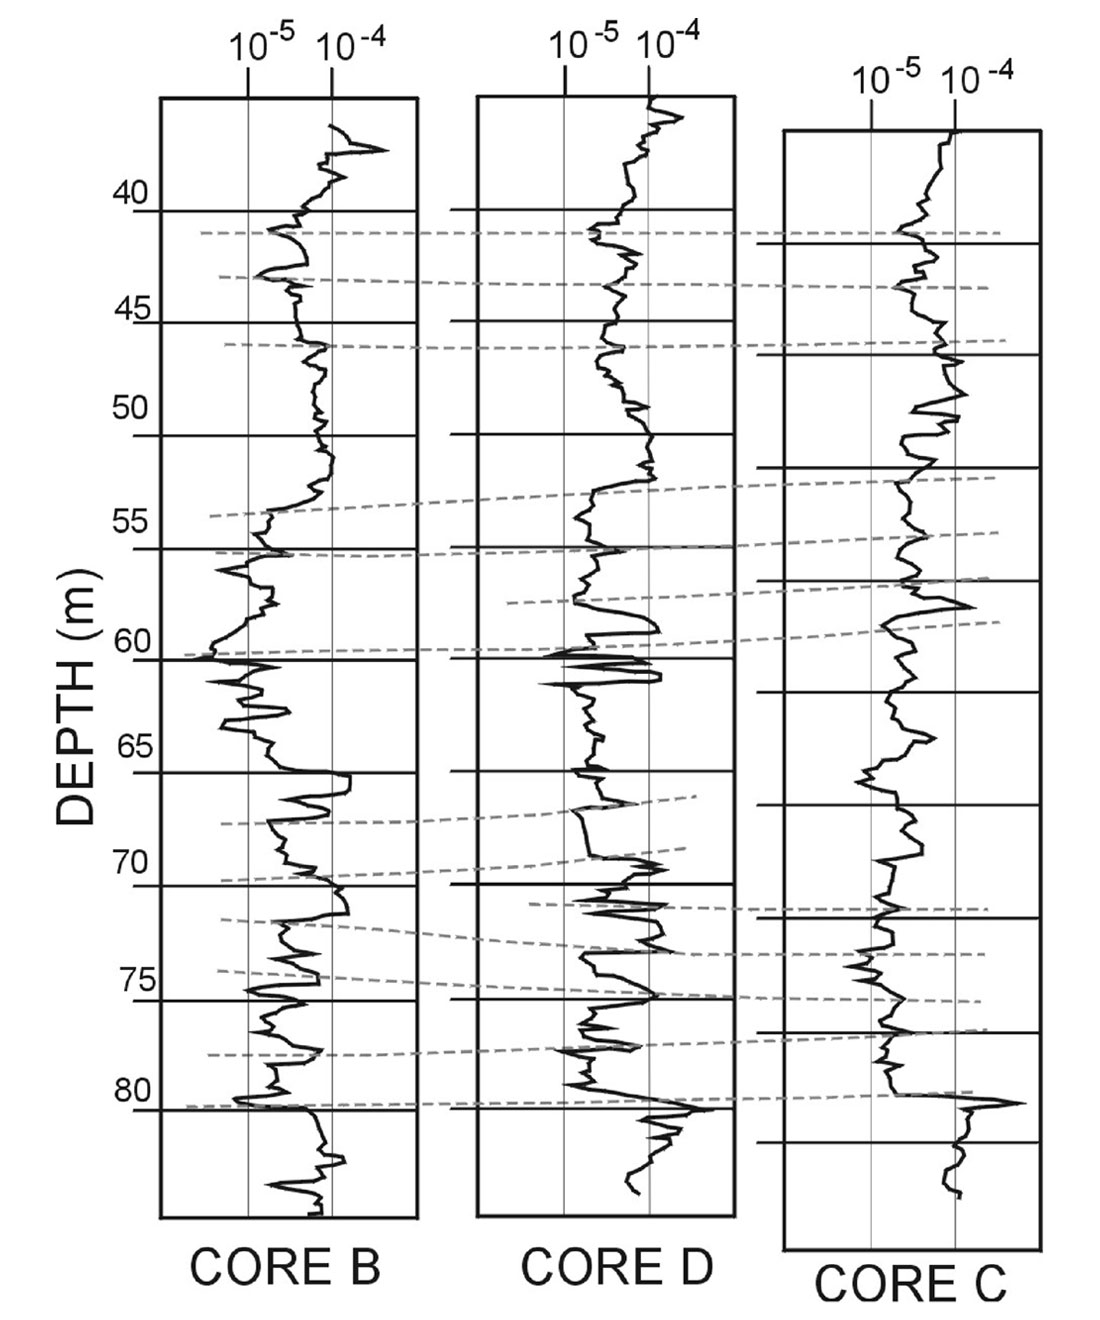
After depth shifting each log for topographic height differences between each borehole, detailed correlations between the core logs are readily apparent (Figure 2). The susceptibility low around 40m was used as the horizontal reference surface for the three logs. The high susceptibility horizon at the base of each of the cores corresponds to the moderately magnetic Devonian carbonate sequence which forms the base of the Clearwater Formation. All of the borehole logs show a systematic increase in susceptibility towards the top of the basal Devonian carbonate sequence. This possibly reflects the effects of pre- McMurray surficial weathering of the carbonate. In this section there appears to be little if any topography on the Devonian unconformity surface. In the lower section of the McMurray it is possible to correlate susceptibility peaks between the three holes. In the fluvial section of the McMurray between 60 and 75m depth, the full complexity of establishing correlations between closely adjacent boreholes becomes readily apparent. It is possible to identify sequential correlations which dip in opposing directions (Figure 2). In some cases it is not possible to correlate between all three holes, which suggests a possible lateral truncation. The onset of estuarine to marine sedimentation in the upper section of the McMurray above 55m, is marked by a sharp increase in susceptibility and the correlations that extend across all three boreholes. Integrating results from the two orthogonal profiles could be used to compute a three dimensional model of meander geometry.
Sedimentary sequences
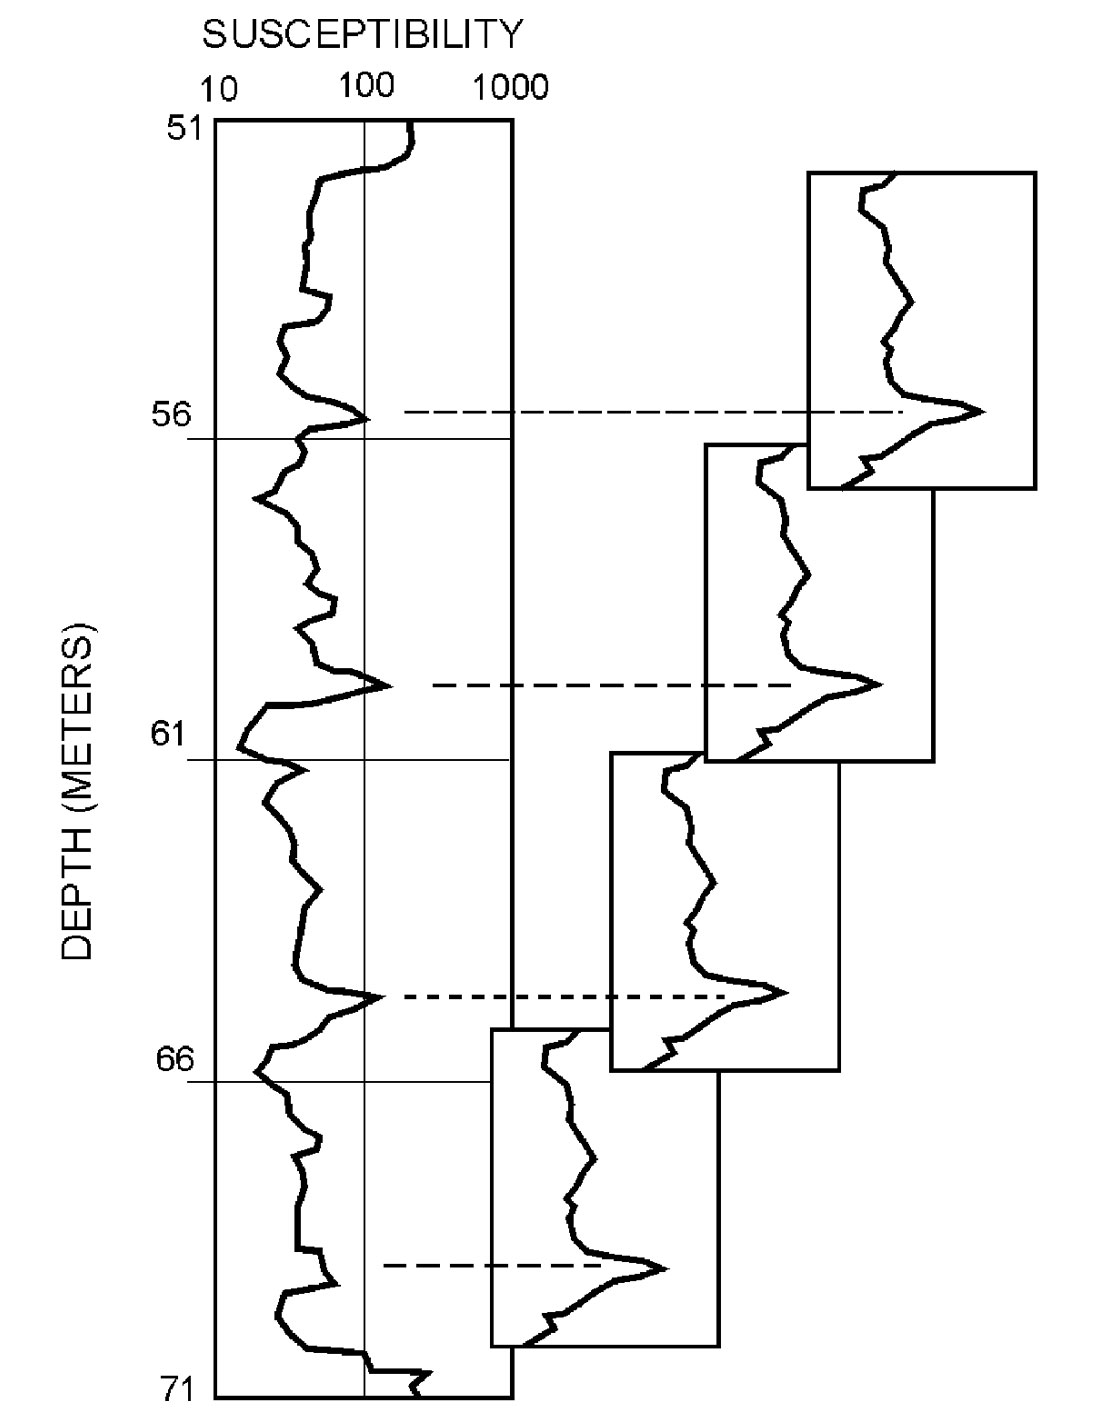
Numerous facies models studies have documented characteristic gamma and resistivity responses that one should expect in the presence of specific sedimentary cycles. For example, a fining-upward sequence generally has a bell shaped morphology corresponding to the incremental decrease in sand content with decreasing depth. It is believed that the McMurray Formation contains a number of channel sequences. Since the temporal evolution of each channel sequence will follow a progression as each meander wanders across the floodplain, one should expect a repetitive physical property pattern. Detailed examination of the susceptibility log from borehole A suggests the presence of four distinct channel sequences. Using data from the depth interval 61 to 65m as a type section, Figure 3 demonstrates the presence of four distinct repeats of the same susceptibility pattern. This suggests at least four distinct periods with channel systems migrating across the fluvial plane prior to flooding.
Lithological discrimination
Generally individual lithological facies are identified on the basis of silicate mineral grain size distribution and the presence of sedimentary structures. Typically in the lower fluvial section of the McMurray Formation the primary contrasts are between the sands and gravels associated with the channel fills versus silts and sandy clays associated with the overbank and marsh deposits. As the water depth increased into the middle McMurray, sedimentation became more typical of an estuarine system. Differentiating between sand flats and channel complexes involves careful attention to the presence (or absence) of pebbles, and the presence (or absence) of ripple structures versus cross-bedding.
An additional factor impacting on any possible magnetic signature associated with the different sedimentary environments is tied to the degree of anoxia developed in the marshes and clay rich phases. Studies of recent lake systems have documented the genesis of magnetite and greigite rich sediments in areas of advanced anoxia.
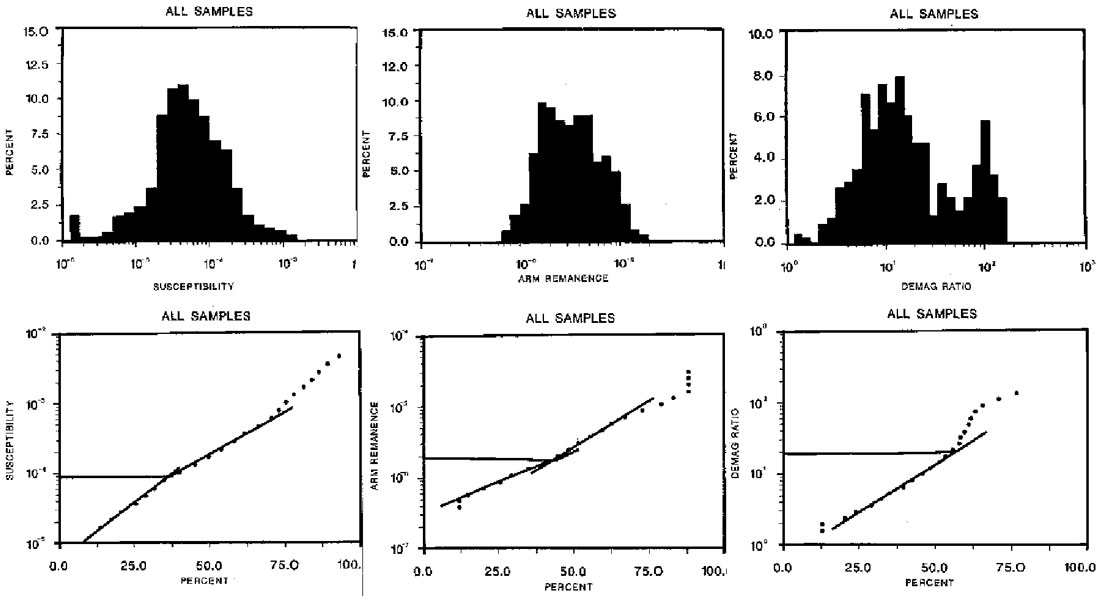
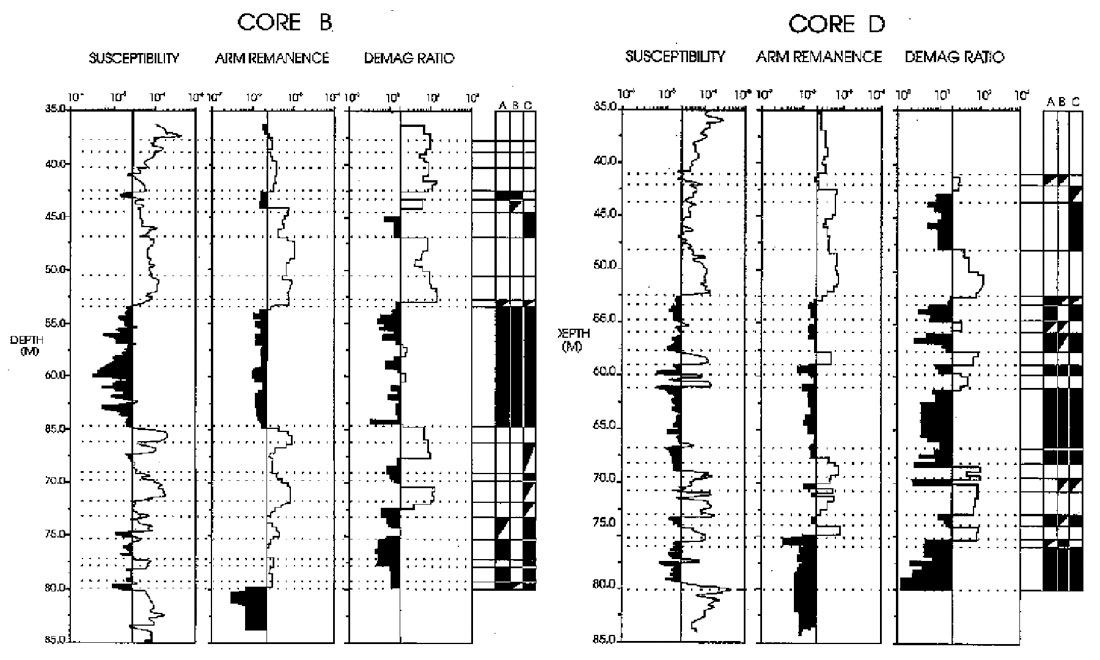
Three magnetic parameters (susceptibility, ARM remanence and demagnetisation ratio) were measured for each core sequence. Examining the log-normal distribution for each of these parameters indicates that it is possible to locate a distinct change in slope of the cumulative percentage for each of the parameters (Figure 4). Accepting that each slope break identifies the bounds of an individual population one can use these points as threshold values to test if the magnetic data is capable of quantitatively separating individual lithological phases. We have chosen to address this issue using a simple bar-code style approach. An individual bar for each parameter is assigned to either black or white depending on whether the parameter value at that point is less than, or greater than the threshold value. Where the magnetic data is equally above and below the threshold value a diagonal marker is used. Lithological subdivisions as identified by geologists who have logged the core are marked by the dotted horizontal lines in Figure 5. Perhaps most astounding about this approach is the close agreement between the boundaries defined geologically and those mapped by this magnetic parameter approach. There are two predominant patterns in the lower fluvial McMurray sequence. Sands associated with the channels typically are associated with three solid bars indicating low magnetic mineral content and coarser mineral grain size. The overbank horizons in contrast have three white bars suggesting a higher percentage of fine grained magnetic minerals possibly arising from paramagnetic minerals associated with the clays. The middle estuarine McMurray sequence has a higher percentage of units characterised by three white bars in keeping with the expected increased sand content of this zone (Figure 5).
Conclusions
As demonstrated by researchers looking at modern (Recent) sedimentary sequences it is possible to use magnetic property studies to provide quantitative correlations between boreholes. By determining the relative contributions of mineral content, grain size and composition fluctuations to the magnetic signal it is possible to differentiate lithologies. Locally it is possible to identify repetitive susceptibility signals indicative of a multiple fluvial channel system. While tools are readily available for obtaining magnetic susceptibility logs on either boreholes or borecore, remotely detecting magnetic mineral grain size and compositional changes will require development of a new generation of borehole probes.


Join the Conversation
Interested in starting, or contributing to a conversation about an article or issue of the RECORDER? Join our CSEG LinkedIn Group.
Share This Article