While mentoring at Nexen, I put together a set of key AVO papers to help geophysicists understand the basics and key concepts of AVO. Now, as an Associate Editor for the RECORDER, I would like to pass along this information to all of you. All the references are listed in the References section at the end, with links to the papers and books, which are functional as of publication in September 2021.
During the 1970s, seismic data acquisition and processing improved substantially to the point where amplitude “bright spots” could be used as a “DHI”, a Direct Hydrocarbon Indicator, e.g., Levin et al. (1976). Using amplitude bright spots was a big breakthrough that continues to be used to this day, but bright spots don’t always indicate hydrocarbons, especially in a geologically complex basin like the WCSB (Western Canadian Sedimentary Basin), where they can indicate coals or other lithology changes.
AVO (Amplitude Variation with Offset) was first introduced to us by Bill Ostrander of Chevron as a better explanation of these bright spots, as he found a correlation between them and “abnormally low Poisson’s ratios” (Ostrander, 1984). Ostrander showed that a significant change in Poisson’s ratio across an interface could produce changes in the P-wave refection coefficient with varying angles of incidence. This observation allowed interpreters to better understand, and therefore have a better success rate, when prospecting for gas sands. Chevron, and probably others, had likely been using this screening technique prior to its original publication in 1982. When I first came into the industry in 1983 as an intern in Gulf Canada’s Special Projects group, one of my colleagues was looking into bright spots, likely examining this technique.
Shuey (1985) introduced the most popular AVO equation. A few other authors, e.g., Koefoed (1962) and Wiggins et al. (1984) had published AVO equations before, but AVO took off after Shuey’s equation was published.
Note that everything that we are talking about is technically AVA, Amplitude Variation with Angle, rather than AVO, Amplitude Variation with Offset. “Due to its physical origin, AVO can also be known as amplitude versus angle (AVA), but AVO is the more commonly used term because the offset is what a geophysicist can vary in order to change the angle of incidence.” (Wikipedia). Most AVO equations have a sin2 θ term in them, where θ should be the average of the angles of incidence and transmission (Aki and Richards, 2009), but is most often misidentified as the angle of incidence.
The next important development was Castagna et al. (1985) publishing the Mudrock Line. This is a relationship between P- and S-wave velocities that allows further, improved simplification of AVO equations, and is the basis for the “Fluid Factor” (Gidlow et al., 1992, republished by Fatti et al., 1994).
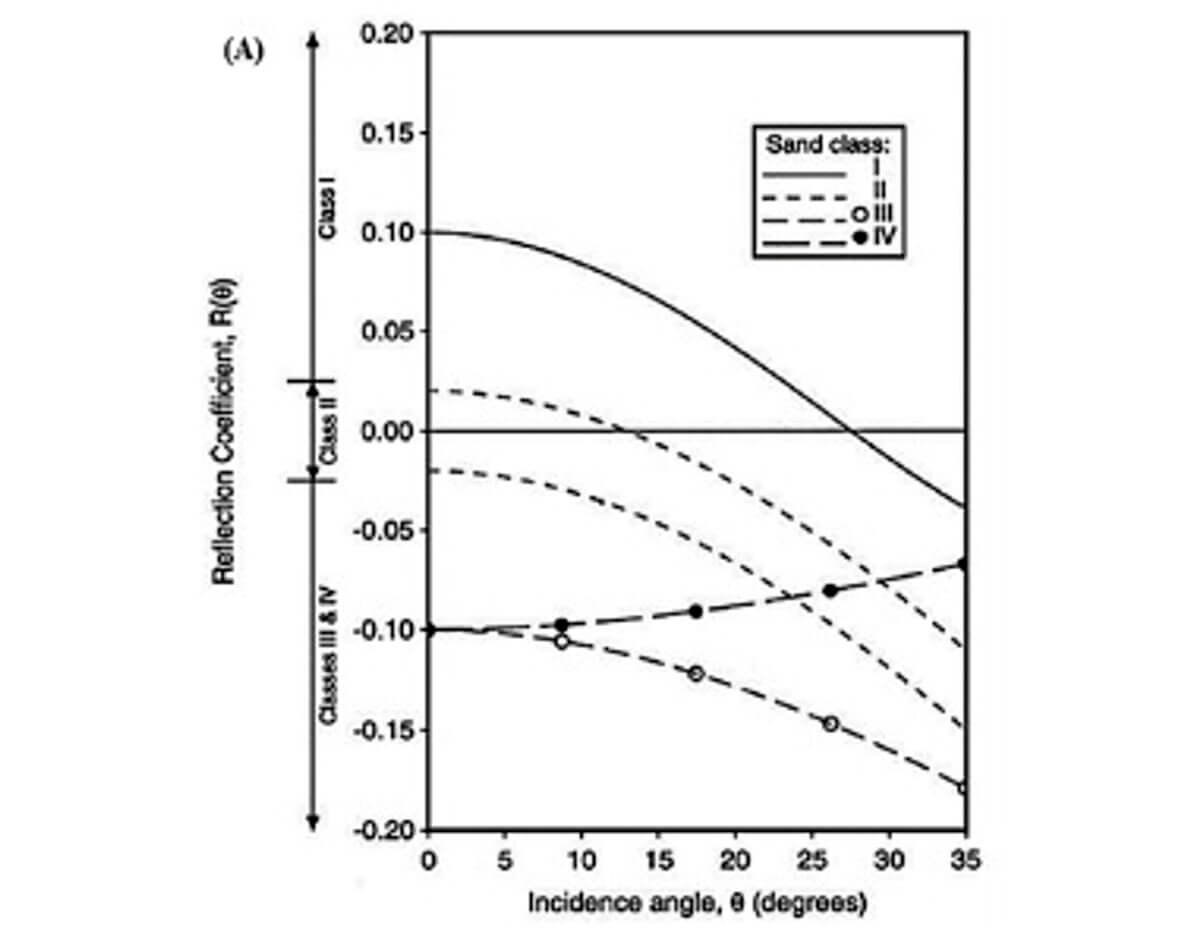
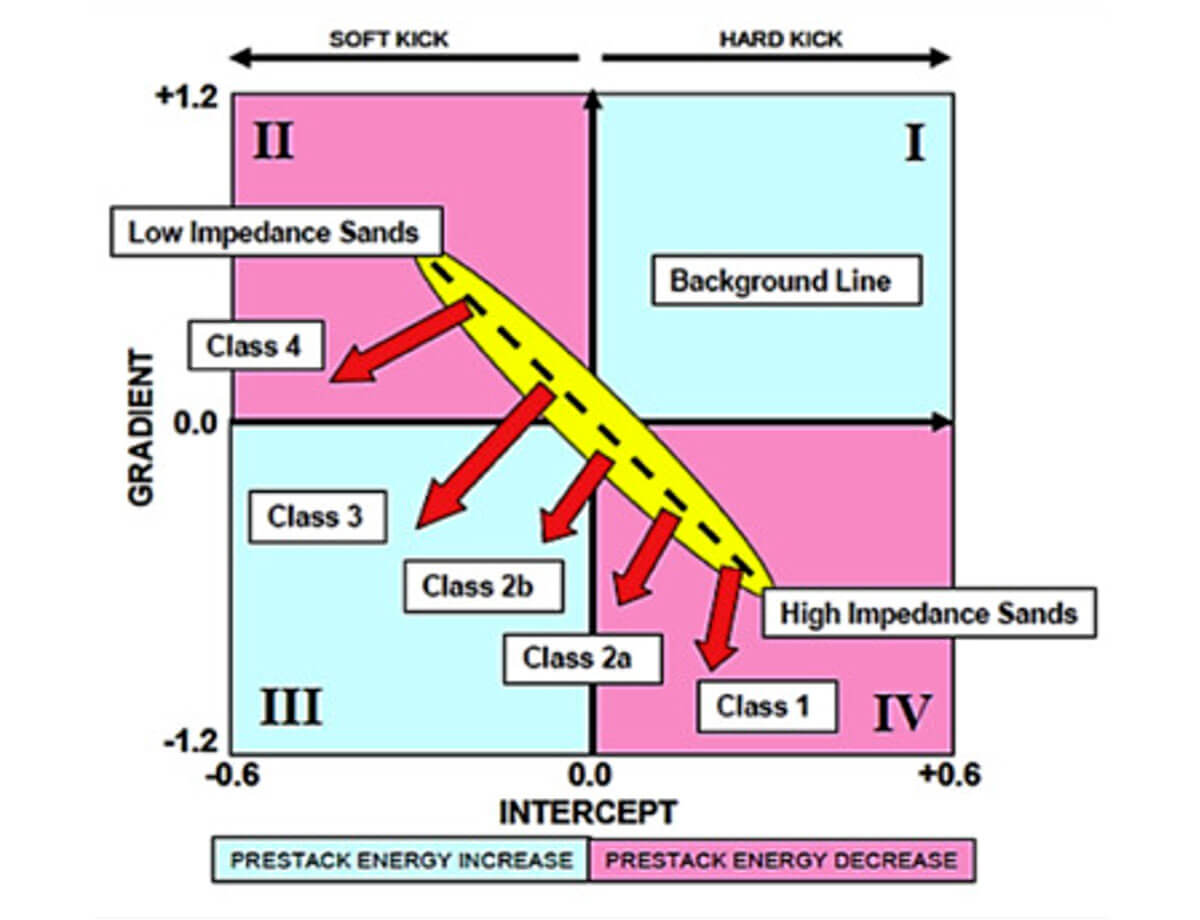
Rutherford and Williams (1989) came up with what is now the most commonly used AVO classification technique: AVO classes 1, 2, and 3 (Fig. 1). Castagna and Smith (1994) added class 4. The classification is based on the boundary between shale overlying a sandstone reservoir containing light hydrocarbons. The classes are defined by their intercept and slope. The intercept is the normal incidence reflection coefficient, and the gradient is the slope of the line relative to sin2 θ. The sign and magnitude of the gradient and intercept are transferred to the crossplot in Figure 2 to help with interpretation. Note that, for all classes except class 4, the gradient is negative. Class 4 is defined by a positive, or, more often, a near-zero gradient.

The Mudrock Line is represented by the yellow zone in Figure 2. It corresponds to the response on this boundary that would be observed without hydrocarbons. Note that most of the areas in the yellow zone have an AVO gradient. Therefore, the presence of hydrocarbons is more accurately described in AVO as a deviation from the Mudrock Line. Note also that a zero gradient is a strong indicator of hydrocarbons, except for very small intercepts. Everything has an AVO gradient. This last observation should induce interpreters to always include at least a cursory look at the AVO properties, and it is why AVO has been so successful and why so many AVO experts work in the Western Canadian Sedimentary Basin (WCSB), even though many of its rocks are pretty hard.

Following on these concepts, Smith and Gidlow (1987) came up with the “Fluid Factor”. The Fluid Factor that Gidlow et al. (1992) published turns out to be a rotation of Figure 2 so that the Mudrock Line becomes an axis. Deviations from the Mudrock Line, as indicated by the red arrows on Figure 2, are then Fluid Factor anomalies, which can be related one to another. However, if you do the math on the Fluid Factor rotation, you’ll find that it can be considered a reflectivity of the Vp/Vs ratio. If you do the math, calling g = Vp/Vs, the Fluid factor is approximately g/g, which is the reflectivity of the Vp/Vs ratio. Therefore, I think of the Fluid Factor as the Vp/Vs ratio reflectivity, and that helps me get away from just using the “Fluid Factor” only for fluids. For example, I know that coal has a relatively high Vp/Vs ratio, so I can identify coal using the Fluid Factor, except that a coal anomaly will have a positive Fluid Factor, whereas a gas sand will have a negative Fluid Factor. In the WCSB, the Fluid Factor, and other AVO attributes, are often used to help identify lithology rather than just as a DHI. This has meant that AVO is used, technically, much more broadly in the WCSB than in many other basins.
Goodway et al. (1997) came up with the concept of Lambda-Rho and Mu-Rho, or LMR for Lambda-Mu-Rho. Lambda is closely related to a rock’s compressibility and therefore reacts to its fluid content and porosity. Mu is the shear modulus, which does not see fluids, but only the rock, and Rho is density, which is closely related to porosity. These attributes work very well for interpretation purposes. Gray and Andersen (2001) show how Lambda-Rho and Mu-Rho can be used for interpretation. I have always used Mu-Rho and Lambda-Rho in my own interpretations. The reason that I like Lambda-Rho and Mu-Rho for interpretation is because they are almost independent with respect to lithology and fluid. I usually start with Mu-Rho because it distinguishes lithologies, most importantly sand vs. shale. Shales have a low Mu-Rho because their layered texture makes them more likely to shear than sandstones with their grainy texture. Once you’ve figured out that you have a sand, then you can use Lambda-Rho to assist in the interpretation of the fluid in the sand. There are many other things you can do with Lambda-Rho and Mu-Rho, as many authors have shown. In particular, Canadian authors have used LMR for carbonates, oil sands, and unconventional reservoirs, as well as DHIs. I particularly like the work of Pelletier and Gunderson (2005) and Goodway (2001), and if you want a full explanation of how to interpret using AVO, use Avseth et al.’s (2005) book on Quantitative Seismic Interpretation. To fully understand the petrophysics behind all of this, I recommend Mavko et al.’s (2009) Rock Physics Handbook.
Another popular method is the extended elastic impedance of Whitcombe et al. (2002). This took Connolly’s elastic impedance and made it more interpretable by introducing the χ (chi) angle between the intercept and the elastic impedance. The χ (chi) angle allows the rotation of the elastic impedance results into other spaces, such as LMR, but, more commonly, fluid vs. lithology. The great advantage of elastic impedance is that it works well with two angle stacks - a near and a far is often all we have to assess AVO. If this is the case, then extended elastic impedance is one of the easiest tools to use to get into an understandable AVO space.
In conclusion, I hope that these papers can help you understand AVO and how and where to use it. Everywhere! I enjoyed writing this, as it evolved into a brief history of AVO. I hope that you now have the tools you need to start using AVO, and a better idea of the value that AVO can bring in geophysical interpretations. I’ve found that LMR and similar methods allow us to communicate better with our peers in Petrophysics, Engineering, and Geology because we are starting to talk their language by using terms like Poisson’s ratio, shear, and compressibility. If you want to know more, I know that all of the authors of these papers, many of whom I have met, are very willing to discuss these ideas with you, and have a whole bunch of other papers that talk about these methods.


Join the Conversation
Interested in starting, or contributing to a conversation about an article or issue of the RECORDER? Join our CSEG LinkedIn Group.
Share This Article