Summary
First arrival traveltimes from a multi-offset vertical seismic profile (VSP) in the Alberta Basin were modelled to determine the Thomsen anisotropic parameters of clastic Mesozoic rocks. The solution was found to be non-unique. Traveltime data were modelled successfully using either a geologically determined or arbitrarily divided horizontally stratified earth. Anisotropy was found to average approximately 18%.
Introduction
First arrival traveltimes from a multi-offset Western Canada Basin VSP were numerically modelled to estimate the Thomsen (1986) anisotropic parameters, ε and δ, given by:

The parameter ε describes the relationship between the bedding perpendicular velocity, V0, and the bedding parallel velocity, V90, whereas δ describes the shape of the wavefront between the slow (V0) and fast (V90) directions, (δ = ε describes an elliptical wavefront, δ ≠ ε indicates departure from ellipticity). Knowledge of anisotropic parameters is required for correct time-depth conversion, including depth migration, and to correctly position targets (Vestrum et al., 1999). Isaac and Lawton (1999) and Kirtland Grech et al. (1999) use physical modelling to demonstrate the lateral mispositioning error involved when isotropic processing code is used to image structures under dipping anisotropic overburden.
It is of interest to parameterise the anisotropy of flat-lying strata in the Plains, since those same rocks are involved in Foothills structures.
Data
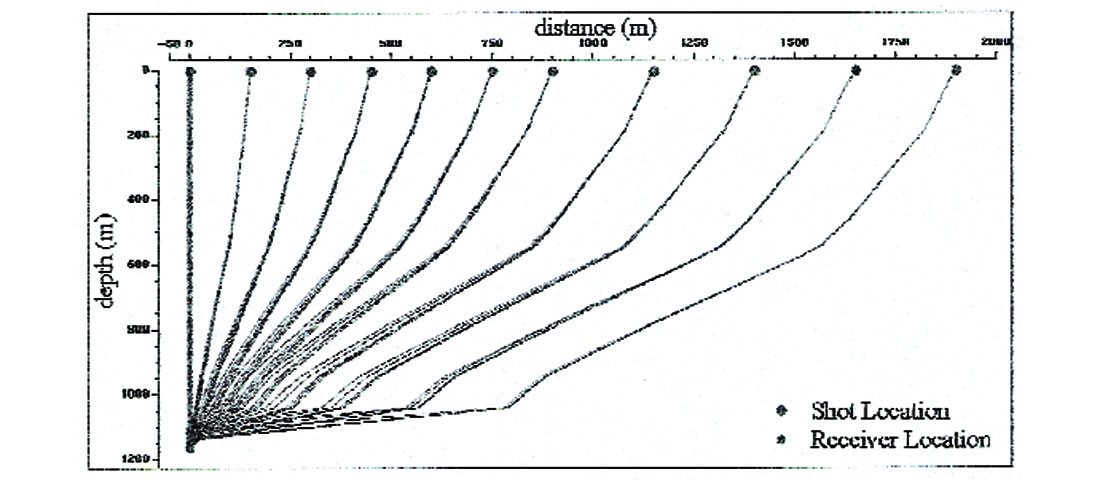
The VSP survey was recorded in southern Alberta and contained shot offsets ranging from 0 m to 1900 m, and receiver depths ranging from 150 m to 1162 m down the well (Figure 1). For the full offset range (0 m to 1900 m) receivers were located only over depths from 1102 m to 1162 m at 15 m intervals. For the shot at 600+m offset, additional receivers were located at 15+m intervals from 700+m to 1210+m. All receiver data were used in this study (Figure 1).
First break traveltimes were picked for comparison with numerically modelled first arrival traveltimes. Traveltime picks were made to the nearest 0.5 ms and velocities were rounded to the nearest integer value. Numerical data were computed using an anisotropic raytracer developed by Leslie and Lawton (1999a). The method used involved creating a layered model and assigning values of V0, ε and δ to these layers, and then iteratively changing ε and δ until a satisfactory match was made between the observed and computed data (usually +/- 5 ms). Bedding perpendicular interval velocities (V0) were assigned on the basis of check shot traveltimes, from a zero-offset shot.
Results
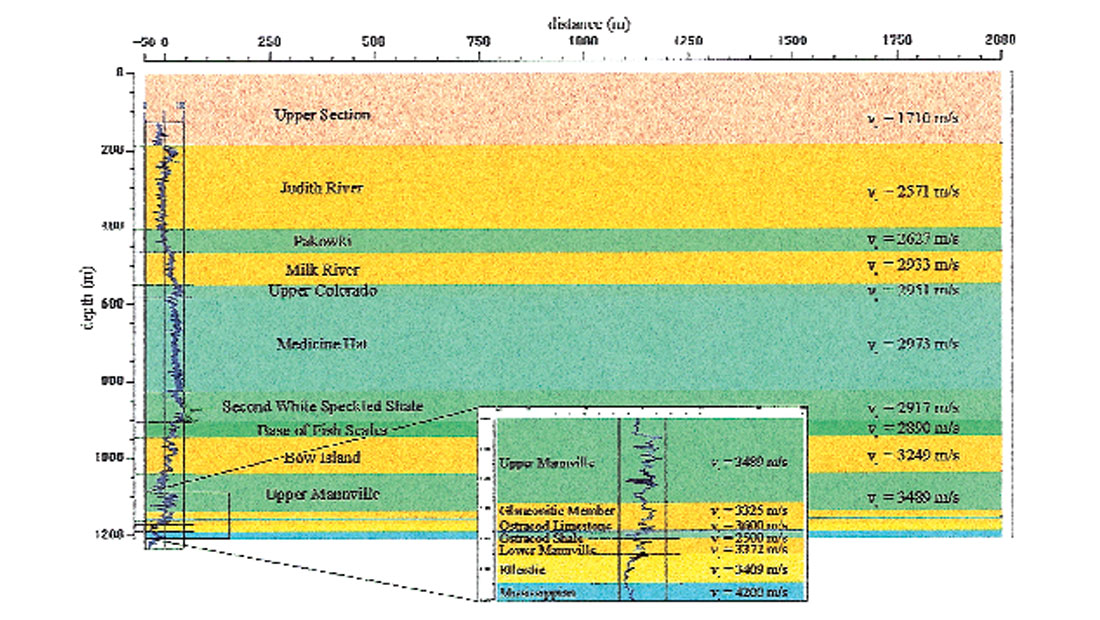
The VSP well intersected Cretaceous strata from Brazeau through Mannville Groups (Figure 2). Interpretation of 3+D seismic data and well tops information over the survey area indicated that the strata were flat-lying, continuous and had little variation in boundary depths. Consequently, a 1.5+D model was deemed appropriate. Formation tops data were superimposed on the gamma ray log from the VSP well and used to define the geologic boundaries within the model (Figure 2).
Initially an isotropic solution, ε = 0, δ = 0, was tested but could not be found to match the observed traveltimes. Global anisotropic parameters were determined by setting the anisotropic parameters within all units to be equal. This assisted in constraining the parameters when more complex combinations were modelled. Anisotropic parameters ranging from 0.150 to 0.300 were tested iteratively and those that achieved an acceptable match between observed and computed traveltimes included ε = 0.185, δ = 0.175 and ε = 0.200 and δ = 0.150, indicating that the solution is non-unique.
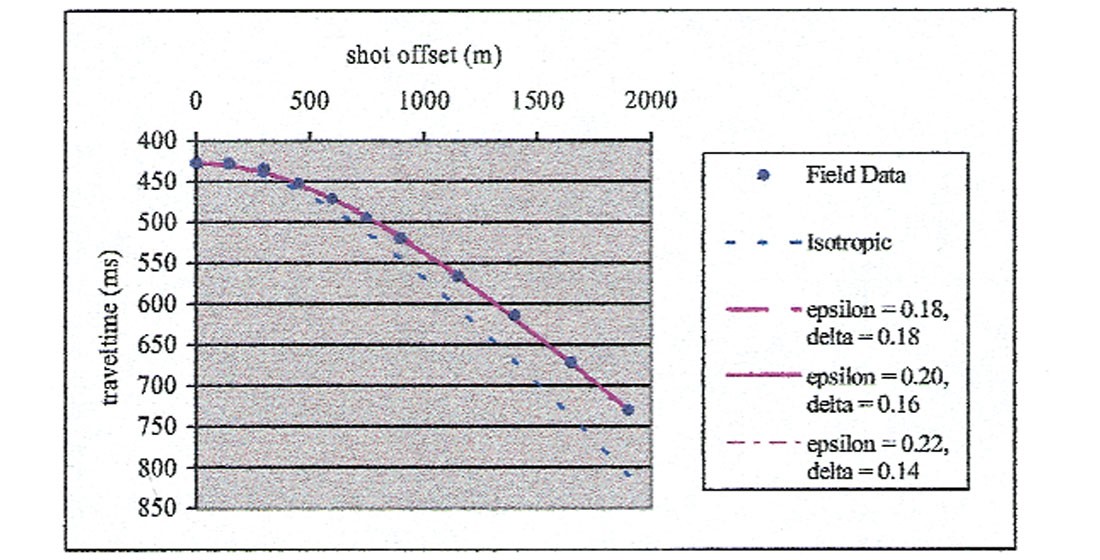
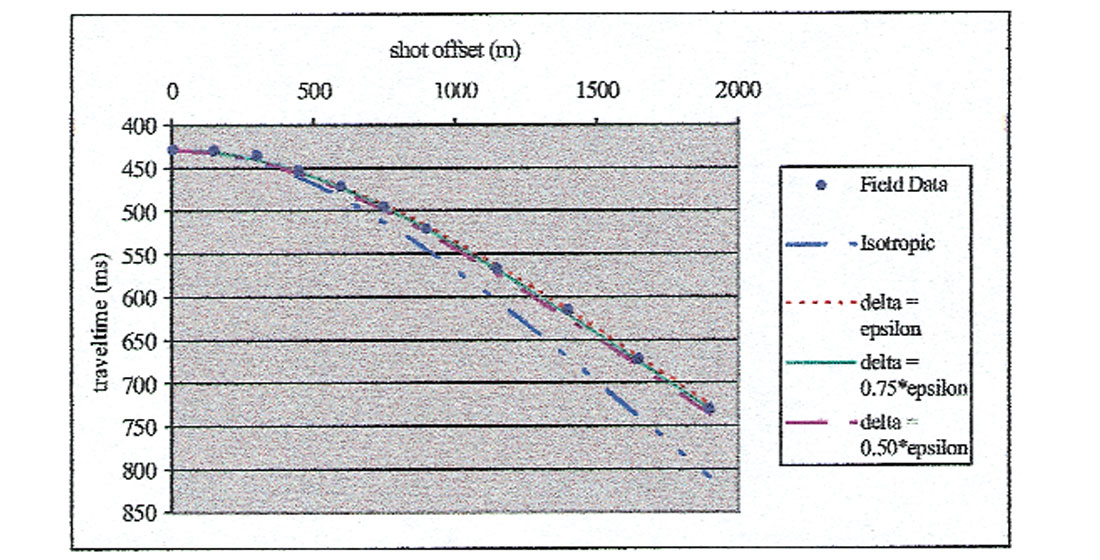
A numerical model with layers of 10 m thickness was also developed. Global anisotropic parameters for this model were determined to be ε = 0.20 +/- 0.02, δ = 0.16 -/+ 0.02, as shown by the common receiver plots (Figure 3). Since shale-dominated strata are known to exhibit higher anisotropy than sand-dominated strata (e.g. Leslie and Lawton, 1999b), this model was altered, with ε and δ scaled as a linear function of the gamma log count. A sand-shale cutoff of 85 counts per second was used. This approach was successful, and modelling anisotropic parameters as a function of gamma count matched the field data well (Figure 4). Many functions fit the data equally well, some examples being ε = 0.0 - 0.1, where λ = 0.0 - 85; ε = 0.1 - 0.50 where λ = 85 - 150; and ε = 0.50 where λ > 150, δ = ε * (0.75 +/- 0.25).
Conclusions
The VSP traveltime data were modelled successfully using a multi-layered model. Regardless of the method used to define the layering, the traveltime data could not be modelled using isotropic velocities. Anisotropic solutions were shown to be nonunique, although all determined solutions indicate that the clastic rocks in the Alberta Basin possess significant anisotropy in the range of 16 - 20%.


Join the Conversation
Interested in starting, or contributing to a conversation about an article or issue of the RECORDER? Join our CSEG LinkedIn Group.
Share This Article