Summary
The oil bearing lenticular multilayered reservoir sands in the South Umm Gudair Field is embedded in the thick Ratawi Shale Member. They are sedimented as thin tidal bars anastomosed with distributary and tidal channels deposited under pro-deltaic to delta front environment.
The petrophysical properties estimated from well data with sequential Gaussian simulation could not resolve the problem of identification of thin reservoir sands because of the lack of spatial variability within wells. The seismic attributes such as coherency, spectral decomposition, first and second order amplitude, phase and frequency attempted individually within interpreted seismic horizons could not detect these thin sands. The gross picture of the channel/bar system was evolved with simulation of net to gross of reservoir sands identified in 35 drilled wells for Upper sequences (4a,4b,4c) and Lower sequences (2a,2b), within Ratawi Shale and Ratawi Limestone of Cretaceous Age. The neural network technique was applied to estimate Vclay and effective porosity integrating well information and 3D multi-attributes between seismically mapped horizons to delineate this complex reservoir sand channels/bars. This method is more efficient than conventional estimation with the ability to build a non-linear relationship between seismic traces and target porosity and Vcl logs for interpolation. The sum of amplitude slice derived between sequence Top and base tracked on depth converted estimated Vclay along inlines and crosslines provided the envisaged pattern of distributary channels.
This paper presents an integrated approach to delineate complex reservoir channels/bars to plan for side-tracking of existing wells and drilling appraisal & delineation wells.
Introduction
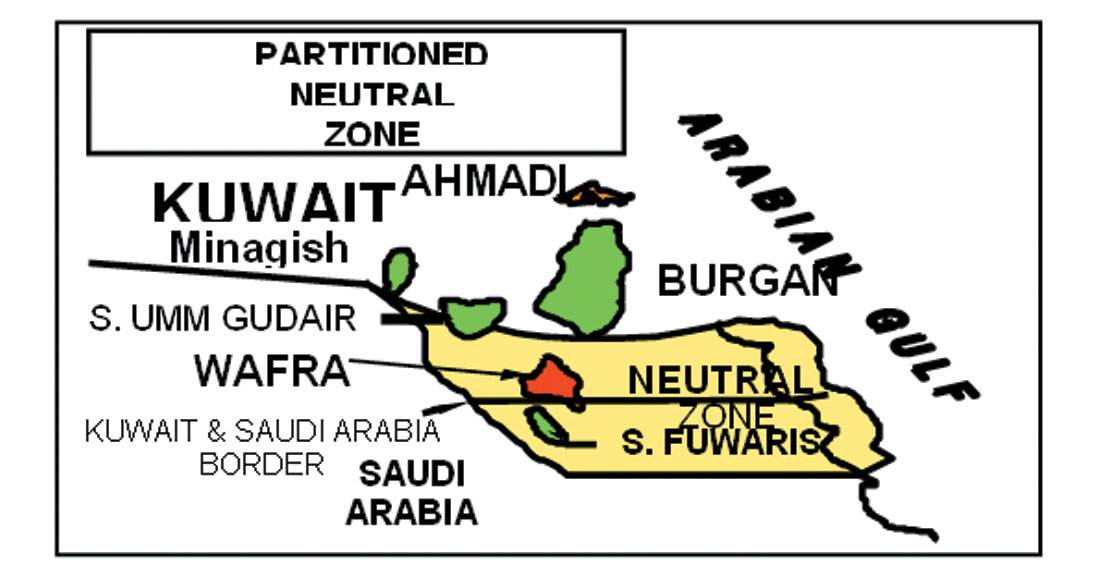
The South Umm Gudair Field, located at north-western corner in the Partitioned Neutral Zone is (Figure 1) jointly operated by Saudi Arabian Texaco and Kuwait Gulf Oil Company.
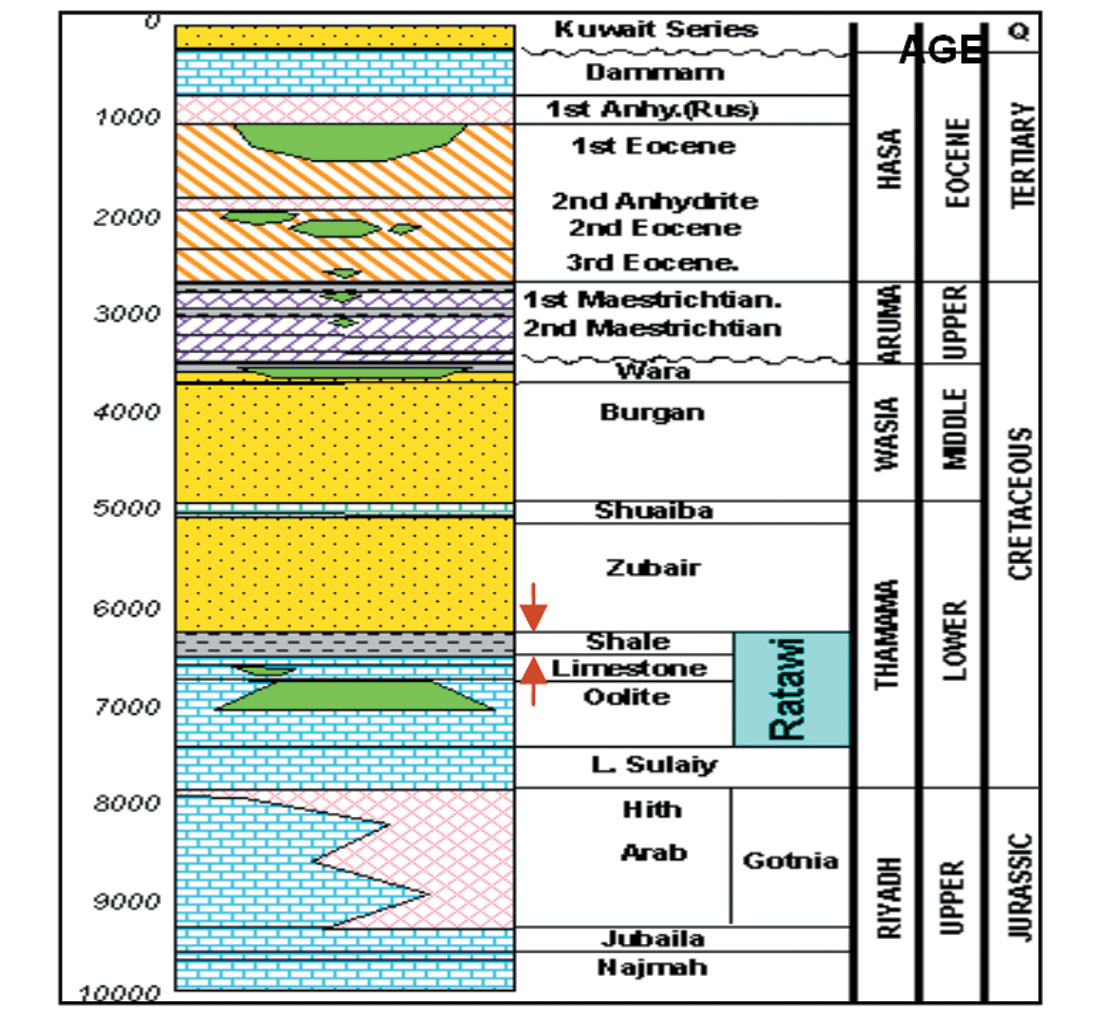
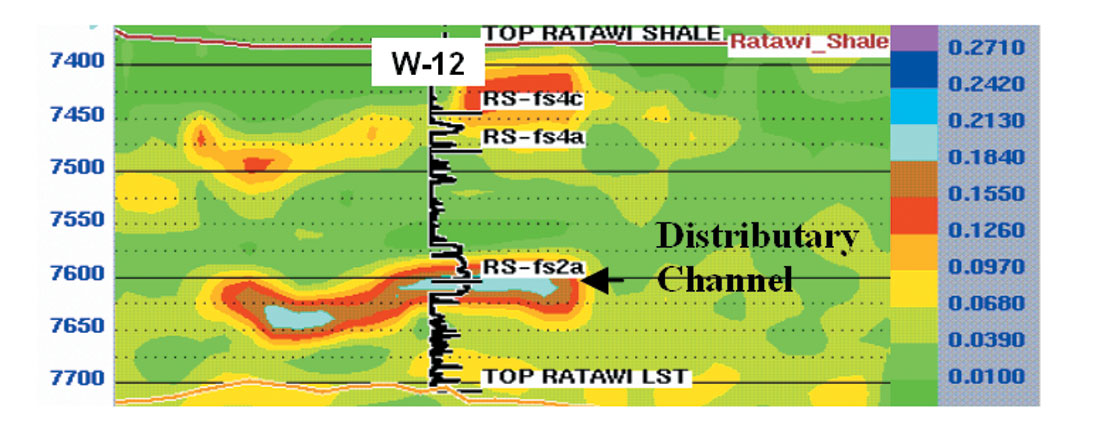
The oil accumulation in interbedded sands within the Ratawi Shale Member (Figure 2) has been confirmed in a few wells.
The multiattribute transforms coupled with neural network technique were used to model high porosity reservoir sands and vclay integrating impedance derived with sparse spike technique from seismic data. Lithofacies, effective porosity, Vcl simulated using Sequential Gaussian with well data confirmed wide occurrences of reservoir sands in upper sequences as delineated with neural network technique.
Reservoir layering and correlation
The representative wells over the structure were correlated to identify different layers with sequential sedimentology approach.
Structural and Stratigraphic Framework
The Ratawi Shale Formation and associated sands are of deltaic origin. They are stacked as concentric belts of deltaic facies at the edge of a delta plain and delta front, with important variations in location of the distributary channels.
Reservoir units
The reservoir units, stratigraphic intervals bounded by two geological markers were classified as sequences: 2a, 2b, 3a, 3b, 4a, 4b, 4c etc. through analysis of channels and bars in key wells.
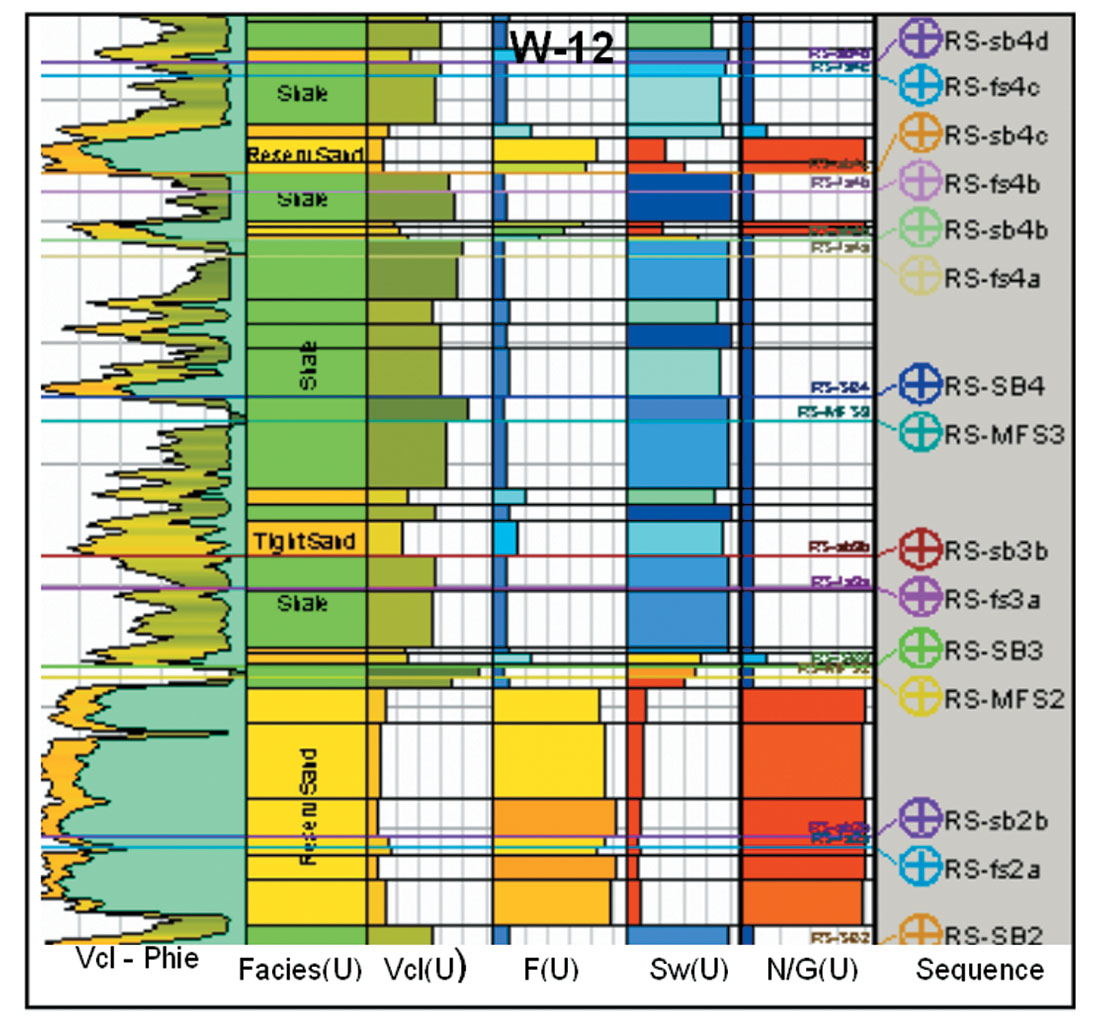
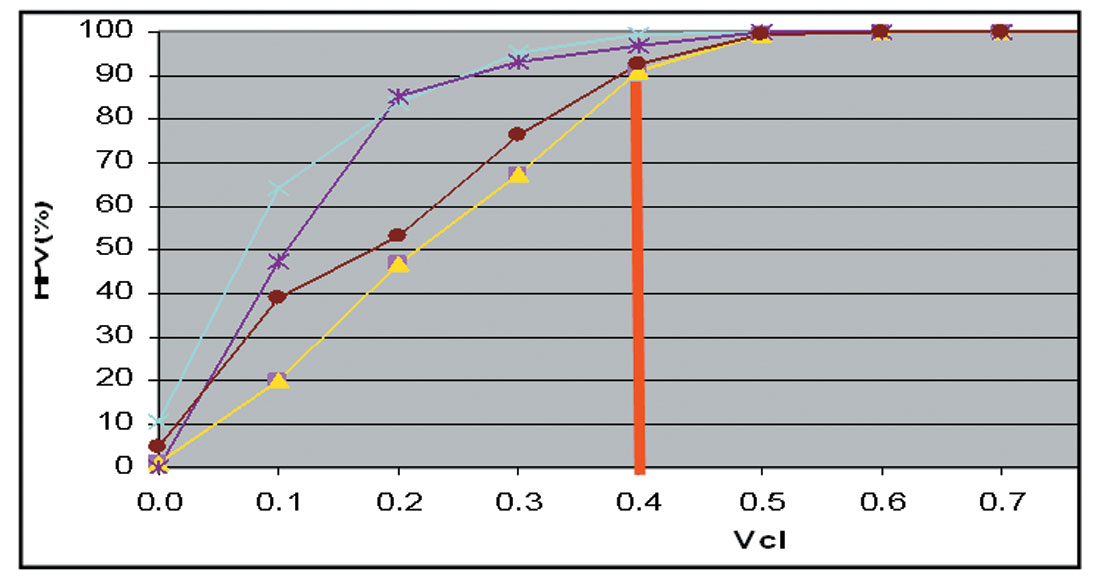
Porosity and Vshale computation
Density and Neutron logs were processed to determine effective porosity and Vclay for 40 wells (Figure 3).The Cross-plot of Hydrocarbon Pore Volume (HPV) vs Vclay for key wells (Figure 4) could discriminate reservoir sands (Phie > 10%, Vcl< 40%) and tight sands with range Phie < 10% , Vcl > 40%.
Methodology
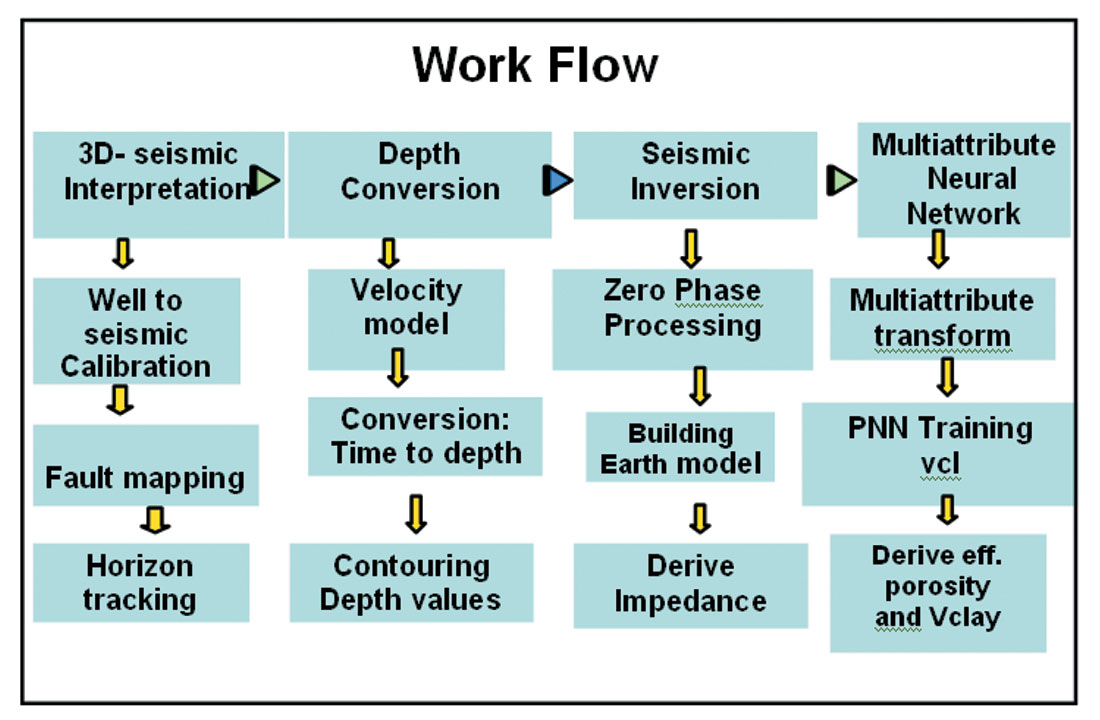
Time migrated processed 155 sq. km 3D seismic data was interpreted to delineate these lenticular reservoir sands embedded in shale with multiattributes using a Neural Network technique in the following scheme (Table-I).
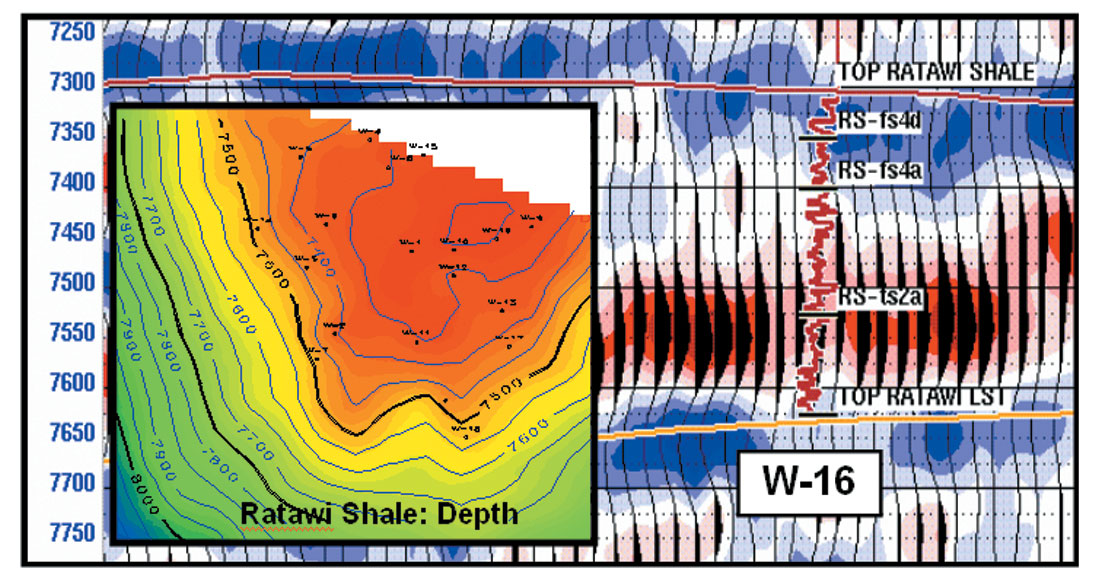
The geological markers of existing key wells were calibrated on seismic data to identify seismic horizons which were tracked for the entire area for Top Ratawi Shale and Top Ratawi Limestone. The stacking velocity was modelled constraining on seismic horizons tied on well markers to convert time domain seismic into depth ( Figure 5).
Inversion process
An initial acoustic impedance model for seismic inversion was created with integration of picked horizons, extracted wavelets and correlated P-wave with seismic data processed to minimum phase. The impedance volume was derived with sparse spike inversion method.
Multi-attribute analysis
The Vcl logs within Ratawi Shale and Ratawi Limestone for 35 wells were integrated with extracted seismic traces and impedance curves on well locations. The combinations of 20 attributes were selected on the basis of error factors and correlations between actual and predicted Vcl (Figure 6).
Figure 6: Crossplot between actual vs predicted Vclay using 20 seismic attributes showing correlation coefficient
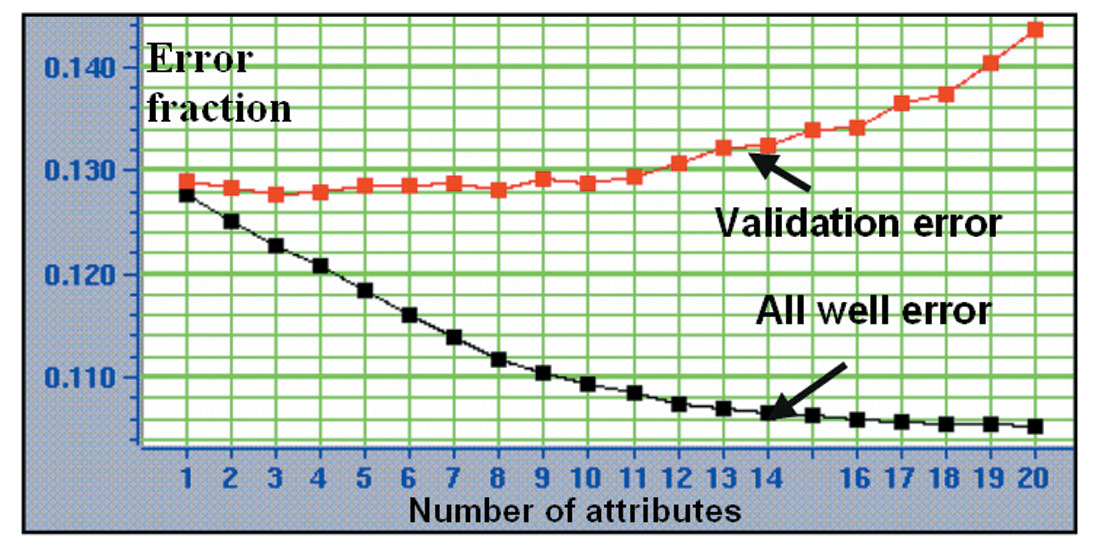
The decreasing error shows that the expected prediction error decreases with increasing number of attributes (Figure 7) and addition of more attributes is similar to fitting higher order polynomial to a set of points.
Neural Network Training
The neural network was trained with W-3, W-4, W-5, W-6, W-7, W- 8, W-9, W-10, W-11, W-12, W-13, W-14, W-15 and W-19, optimized iteratively through process of elimination with 20 attributes and 83% correlation coefficient was achieved. The neural network could not provide stable solutions for 6 and 10 attributes.
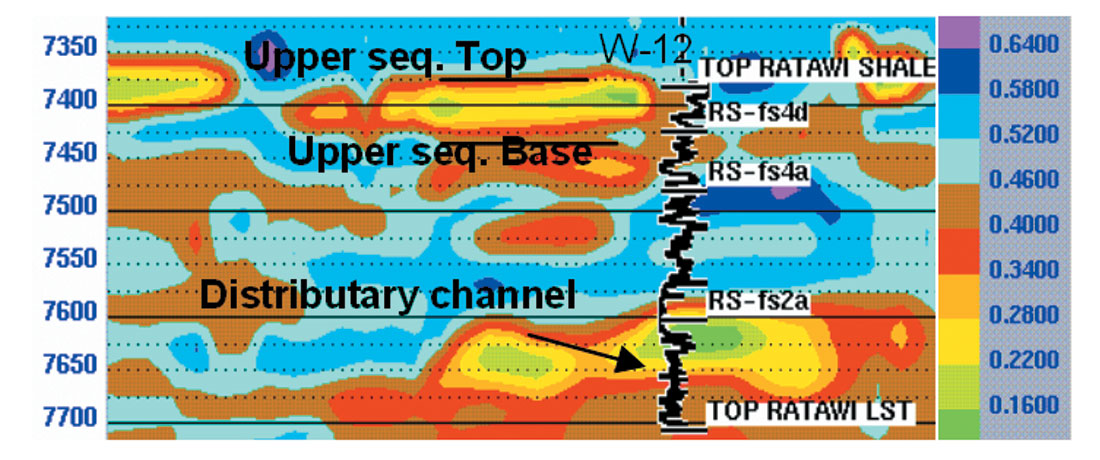
The process was run on the entire 3D seismic data using this trained Network and Vcl cube (Figure 8) was generated. Similar process was repeated with effective porosity (Figure 9) and the result was found to be in tune with each other as validated on drilled wells. The Vcl and porosity volumes in time was converted into depth to track the Top and base of Upper sequences 4a, 4b, 4c.
The individual reservoir sands viz. 2a, 2b, 4a, 4b, 4c are below seismic resolution. This study has proved however that the lower reservoir sands consisting of sequences (2a & 2b) and upper sequence (4a, 4b & 4c) when coupled together are seismically detectable.
Facies modelling
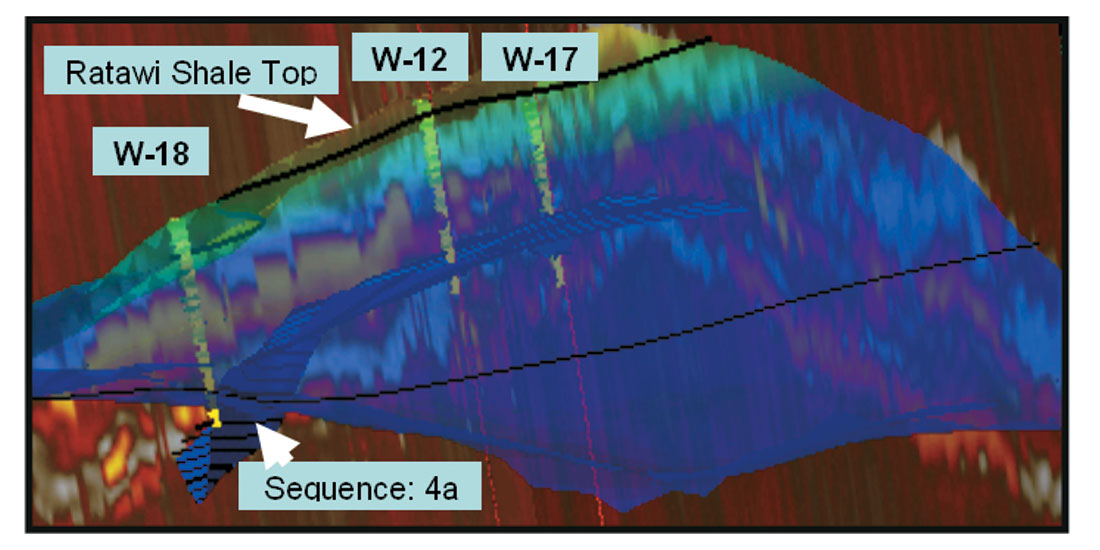
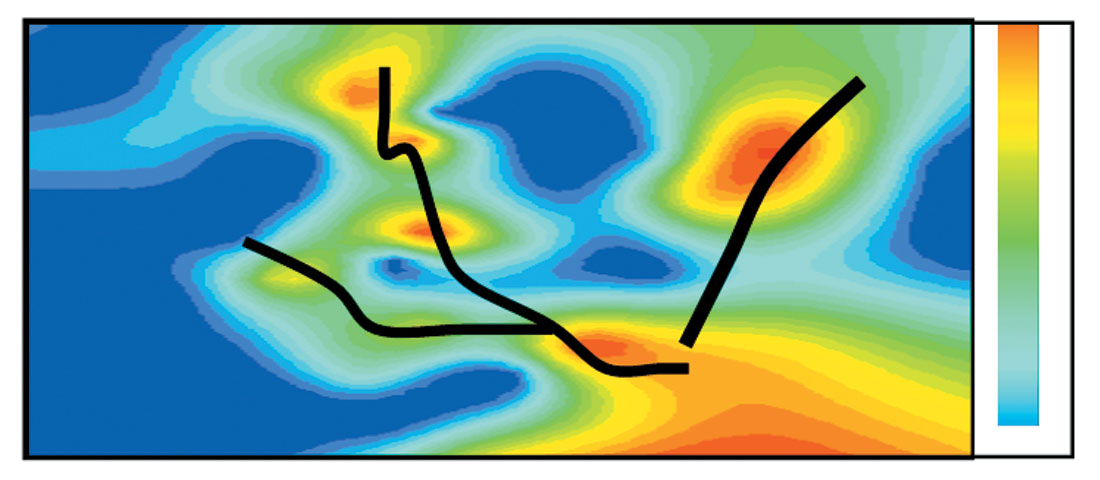
Three lithofacies were selected based on log interpretation curves and cut-offs (Vcl < 0.4 & Φ > 0.1 ) and simulated using Sequential Gaussian. Vclay and effective porosity volumes derived using well data shows widespread development of Sequence-4a & 4b. The net to gross of reservoir sands along top of sequences 2a (Figure 11) and 4a, 4b , 4c (Figure 12) from the simulated volume provided the gross picture of channel/bar system.
Mapping sandbody System
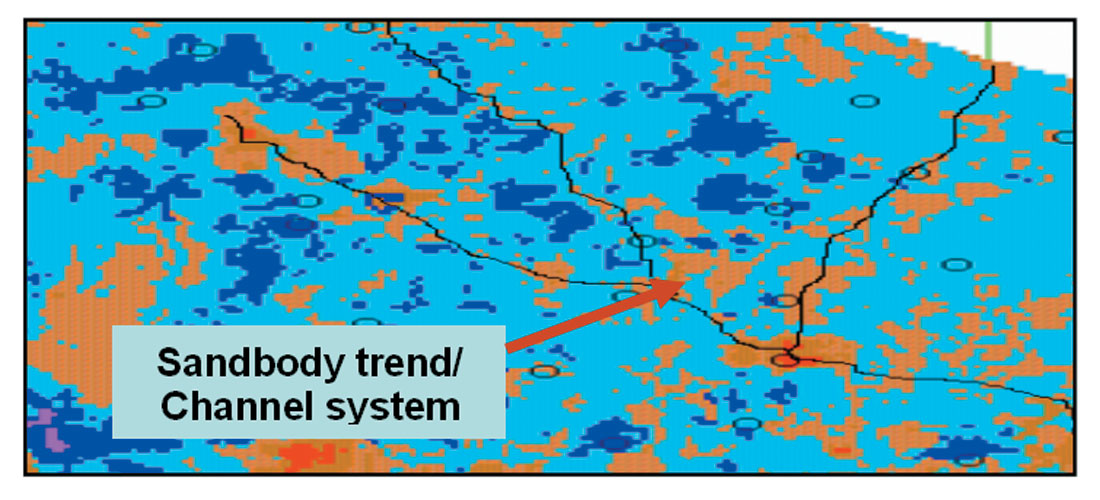
The thickness slice from depth domain Vclay volume with reference to W-12 Sequence-2a to 100 ft below provided the localized nature of sandbody trend (Figure 13).
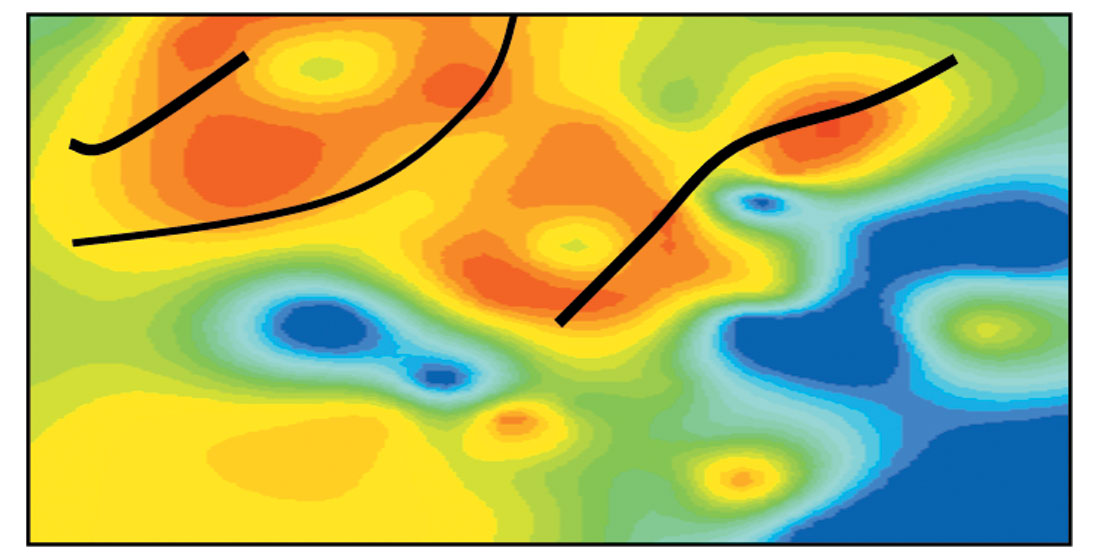
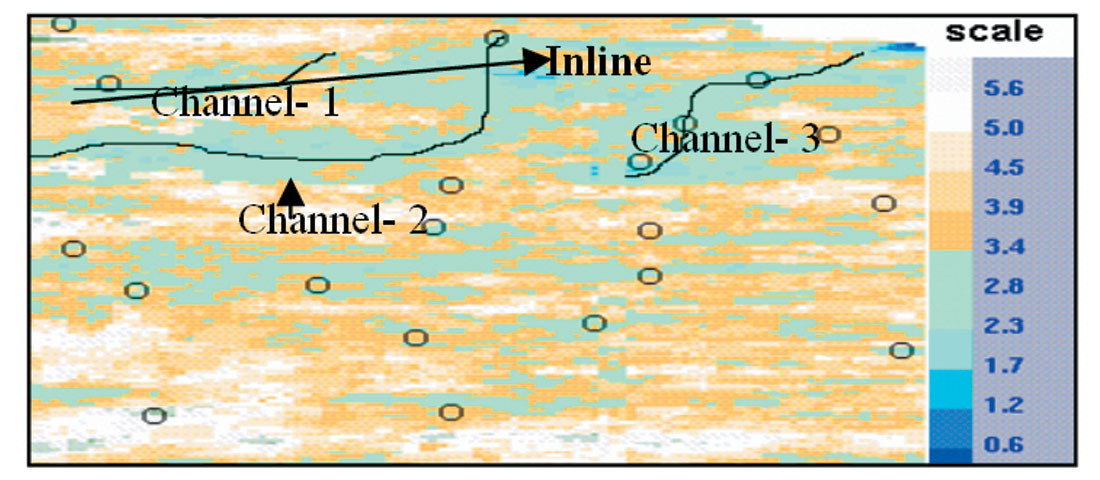
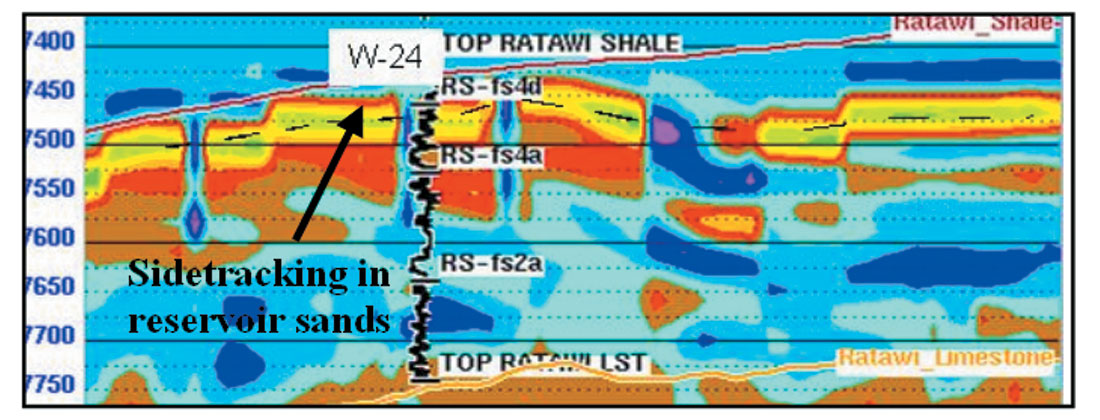
The Top Upper sequence 4c and Base-4a were tracked in this Vclay integrating on drilled wells. The sum of stacked Vclay within Top and Base (Figure 14) provided the lineament of channel/bar system in upper sequence which are in conformity to well derived Net to gross for the upper sequence 4b. An arbitrary line drawn across channel-2 shows the predominance of upper sequence sands along this trend (Figure 15).
Conclusions
- The Vclay and effective porosity volumes estimated using neural network has been confirmed by drilled wells.
- The upper sequence sands 4a & 4b are widespread, whereas lower sequence sands 2a & 2b are localized.
- The reservoir sandbody system delineated on the basis of neural network technique provides the trend of deposition.
- This integrated approach has identified the complex reservoir sand channel/bar system which may guide to plan horizontal well drilling, appraisal & sidetracking of existing wells in sequences 2a, 2b, 4a and 4b.

Acknowledgements
We thank Kuwait Oil Ministry and Kuwait Gulf Oil Company to provide permission for the publication of this paper. We would like to recognize management and support staff Field Development Department, Wafra for their significant direct or indirect contribution to this paper.


Join the Conversation
Interested in starting, or contributing to a conversation about an article or issue of the RECORDER? Join our CSEG LinkedIn Group.
Share This Article