Summary
Results from the worlds largest 3D four component OBC seismic survey will be presented. Located in the West Cameron area, offshore Gulf of Mexico, the survey operation totaled over 1000 square kilometers and covered more than 46 OCS blocks. The area contains numerous gas invaded zones and shallow gas anomalies that disturb the image on conventional 3D seismic, which only records compressional data. Converted shear wave data allows images to be obtained that are unobstructed by the gas and/or fluids. This reduces the risk for interpretation and subsequent appraisal and development drilling in complex areas which are clearly petroleum rich. In addition, rock properties can be uniquely determined from the compressional and shear data, allowing for improved reservoir characterization and lithologic prediction.
Data acquisition and processing of multicomponent 3D datasets involves both similarities and differences when compared to conventional techniques. Processing for the compressional data is the same as for a conventional OBC survey, however, asymmetric raypaths for the converted waves and the resultant effects on fold-offset- azimuth distribution, binning and velocity determination require radically different processing methodologies. These issues together with methods for determining the optimal parameters of the Vp/Vs ratio (γ) will be discussed. Finally, images from both the compressional (P and Z components summed) and converted shear waves will be shown to illuminate details that were not present on previous 3D datasets.
Introduction
Multicomponent 3D surveys have become one of the leading areas where state of the art technology is being applied to areas where the exploitation potential has not been fulfilled due to difficulties in obtaining an interpretable seismic image (MacLeod et al 1999, Rognoe et al 1999). In areas where conventional datasets suffer from poor data quality due to the presence of gas and/or fluids in the pore spaces, it has been shown that ocean-bottom acquired multicomponent surveys have improved images (Thomsen, et al 1997, Granli et al 1999). For marine surveys where the energy source is towed just below the sea surface, the initial downgoing wave is always compressional and mode conversion to shear waves takes place at reflector boundaries (Thomsen 1999). For clarification, this paper will describe compression as P-P waves and converted shear as P-S waves, indicating one mode conversion. The primary difference between the two is that the shear waves are unaffected by the presence of gas or fluids and only detect lithologic variations. The resultant converted shear seismic image, therefore, contains interpretable reflectors that were not present on the compressional data.
Acquisition
Over a six-month period from December 1999 until May 2000 a large multicomponent seismic survey was acquired in the West Cameron area, Gulf of Mexico. This was the first commercial application of a new ocean bottom cable and sensor package designed specifically for multicomponent applications. Cables were deployed under tension and the no-slack design with 50-meter group intervals helped improve the correspondence between preplotted and actual location. Receiver positioning was confirmed using both a high frequency acoustic method and a first break based technique.
The survey was acquired using swath style acquisition comprised of 102 swaths in 9 overlapping zones for a total of 18,700 CMP kilometers and 930 square kilometers of full fold coverage. The area included numerous platforms and subsurface obstructions requiring extensive planning, especially to ensure sufficient fold of coverage for both the compression and shear data. Commercial ship traffic caused both noise problems and an operational hazard for vessel maneuvers.
Processing
Both field processing and conventional shore-based processing were utilized in this survey. In order to ascertain data quality and permit preliminary evaluation of the imaging results, displays ranging from shot records to 3D inlines, crosslines and timeslices were created onboard using optimized processing parameters that were determined from a 2D test line that was acquired and processed previously. The shot records with the navigation merged were then brought onshore and proceeded through a complete isotropic processing sequence at Schlumberger’s Houston office. This included creation of both a P-P wave data volume by combining the hydrophone and geophone using a non-linear summation technique (Moldoveanu, 1996) and a radial and transverse volume from the P-S data recorded on the two horizontal geophones. Deliverables include pre stack migrated gathers and migrated volumes for both P-P and P-S wave modes.
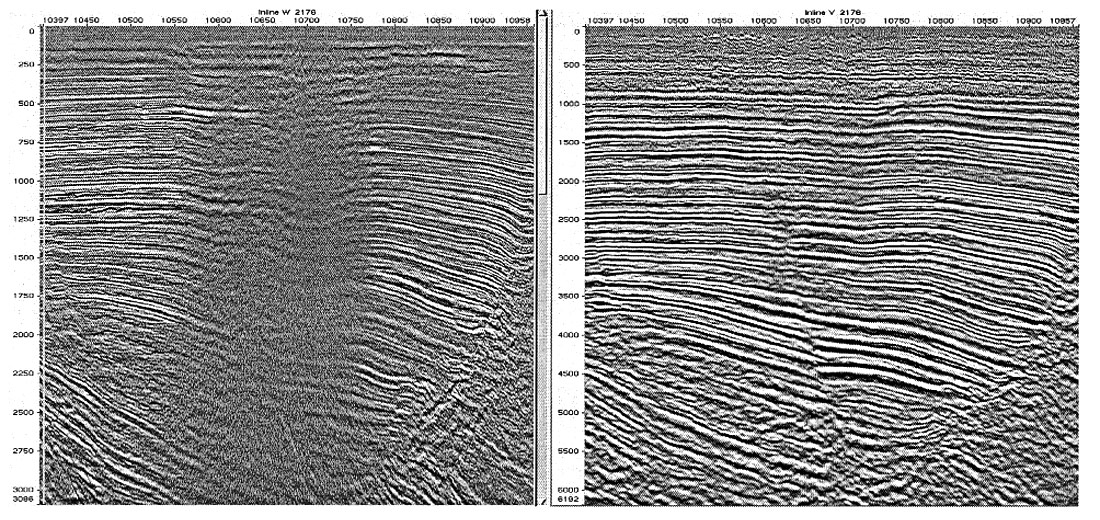
P-P Section (left), P-S Section (Radial) (right).
The large size of the survey resulted in several modifications to the basic P-S converted wave processing sequence (Brzostowski et al 1999, McHugo et al 1999). Resolution of the receiver statics and determination of the appropriate binning Vp/Vs ratio (γVTI) as discussed in Thomsen, 1999 proved to be challenging given the volume of data. We were frequently evaluating the length of the error bar, then iterating to achieve a result which would accomplish our primary objective: imaging through the gas areas. A demonstration of the spectacular results can be seen in comparisons between the compressive and radial shear data volumes. Figure 1 is an inline from a portion of the survey where the P-P image, shown on the left, is distorted by the presence of a large gas cloud. The equivalent section from the P-S volume shows the dramatic increase in reflection events, and hence the interpretability of the data. Figure 2 is a crossline that transects the same gas cloud and shows a similar high quality image that can now be used to reduce the risk for further exploration. There are multiple areas throughout the survey where this level of improvement can be demonstrated by comparing timeslices through the two data volumes (Figure 3). Post stack versus pre stack migrated results for both P-P and P-S waves will be compared to identify improvements in data quality with the added benefit of providing gathers suitable for AVO analysis.
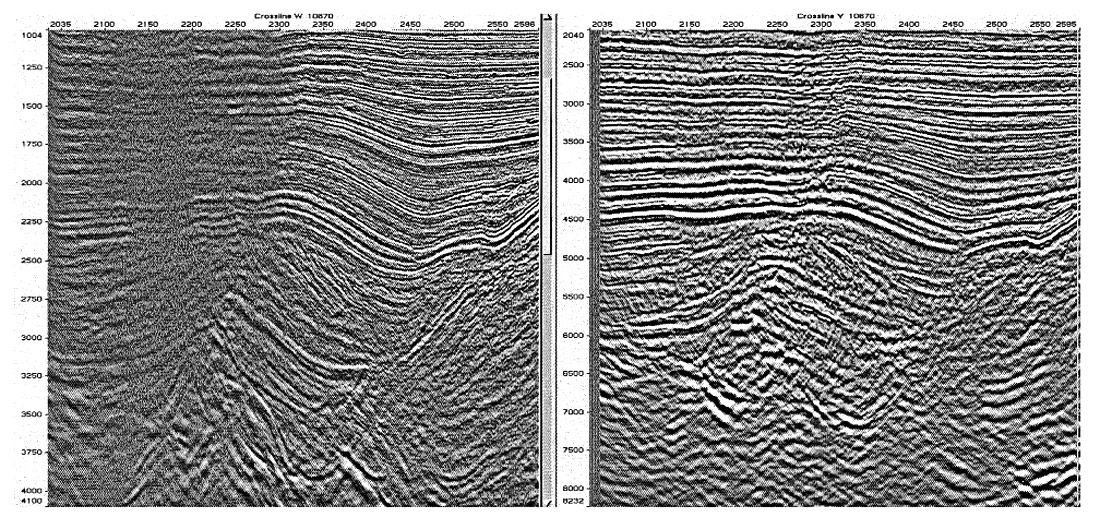
P-P Section (left), P-S Section (Radial) (right).
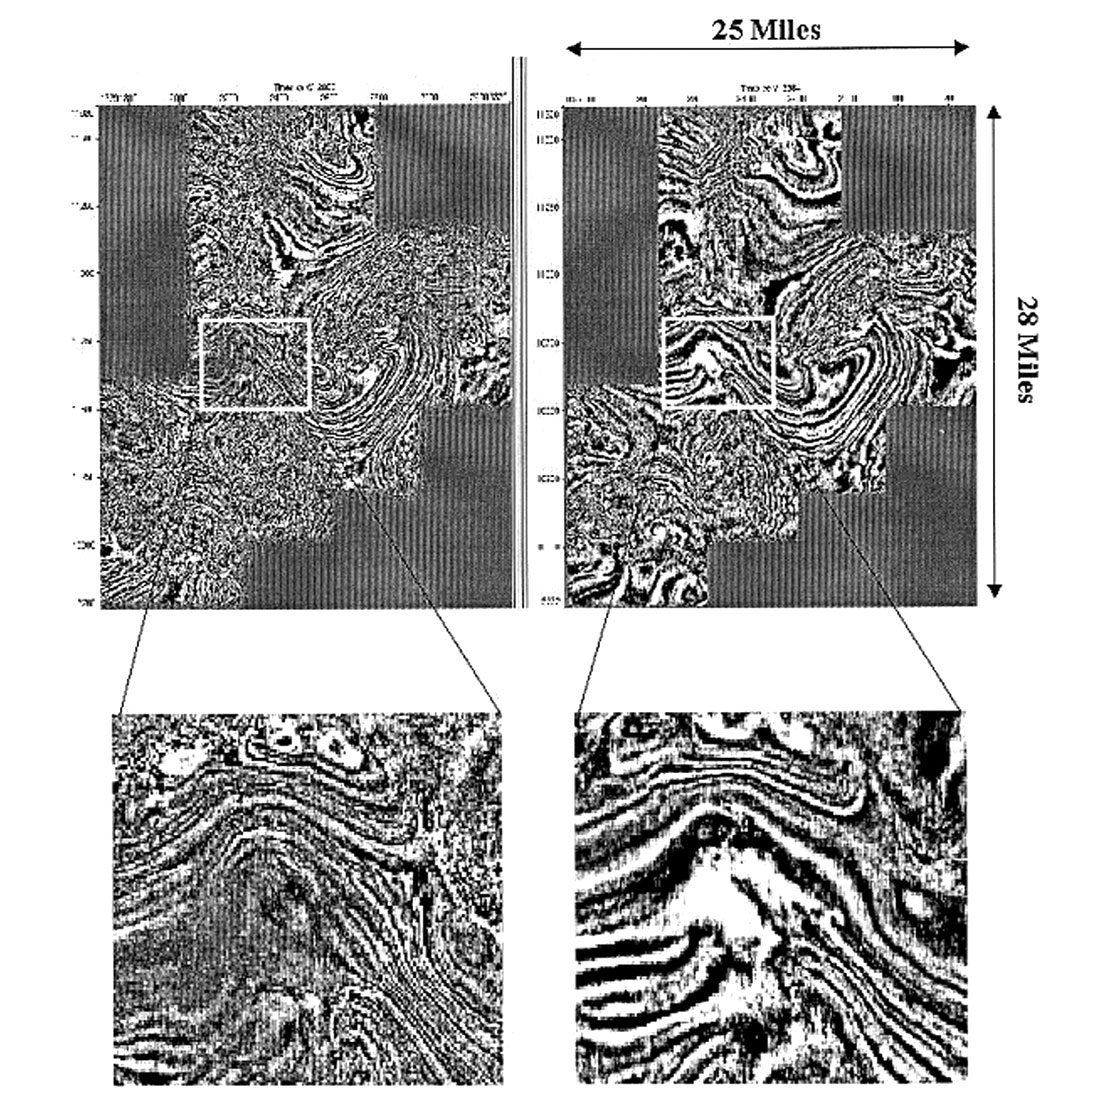
PP Timeslice (left), PS Timeslice (Radial) (right)
Future Work
As can be seen by these examples the results are very encouraging, however, further analysis is necessary to fully realize the added value of this dataset. Special processing to determine the effect of azimuthal anisotropy and depth domain imaging would be of interest. A definitive evaluation of the obvious benefits versus potential inadequacies from limited azimuth acquisition needs to be addressed.


Join the Conversation
Interested in starting, or contributing to a conversation about an article or issue of the RECORDER? Join our CSEG LinkedIn Group.
Share This Article