Abstract
Geostatistical methods are becoming widely accepted in reservoir characterization. The appeal of these techniques is the ability to integrate diverse types of information, including seismic data, into a consistent subsurface model. An added benefit of geostatistics over deterministic reservoir description is the ability to assess uncertainty in the modelling process. A Canadian reef, extensively studied with deterministic reservoir characterization methods over the post 30 years, provided on opportunity to assess the validity of the new modelling methods.
Geostatistical techniques were used to estimate the pore volume of the reservoir. According to the new results, the older deterministic pore volume estimate was not only too small but significantly outside the estimated uncertainty range. Examination of the geostatistical maps indicated most of the pore volume increase was due to new areas of high porosity indicated beyond the reef. From a geological perspective, this scenario is extremely unlikely and the long production history of the field did not support a pore volume of this magnitude.
This evidence led to a more complete review of the geostatistical results in which it was found that the overage porosity in the reef interior and the reef apron were significantly different. This condition violated the assumption of statistical stationarity in the mapping process. Further analysis indicated that the seismic attribute used in mapping was in reality not sensitive to changes in overage porosity but only appeared to be correlated because of complications in well sampling. Careful interpretation analysis coupled with seismic modelling indicated that amplitude and porosity were correlated within the reef interior. However, in the reef apron, porosity was correlated with reef thickness rather than with amplitude. The two regions of the field were independently mapped with appropriate seismic attributes providing interpolation constraints. Pore volume, based on these results, agreed with the deterministic estimates and provided a realistic range of uncertainty.
We learned that geostatistical reservoir studies should not be performed in isolation. Statistical estimates of overage porosity and regression relationships were invalid due to limited well control, and a biased distribution of available data. Geologic analysis played a vital role in determining the validity of the interpolated maps and in improving the geostatistical mapping process. Regression relationships between seismic attributes and petrophysical parameters should be analyzed using seismic modelling and detailed interpretation techniques to ensure that they are physically meaningful before they are used in the mapping process.
Introduction
Study area and Geology
The Devonian reservoirs of Western Canada constitute a major petroleum resource, and provide a major challenge in reservoir characterization. Porosity development and distribution is largely the result of both the original depositional facies and subsequent diagenetic alteration. Effects such as dolomitization, solution enhancement of pores and cementation make porosity distribution difficult to predict. The integration of geostatistical, geophysical and geological techniques help in creating a realistic reservoir model which can be used to optimize future depletion of the hydrocarbons.
Reservoir characterization techniques
The objective of the study was to determine if the existing reservoir model, and pore volume estimates could be improved through the use of geostatistical techniques. To this end, conventional geostatistical methods were employed based on kriging techniques.
Kriging is on interpolation methad that estimates the value of reservoir attributes as a linear weighted overage of the values measured at existing wells. Kriging requires a set of wells where the petrophysical attributes are defined and a spatial correlation model that describes the variability of reservoir parameters as a function of distance and direction. Kriging produces maps that are consistent with the spatial trends described in the correlation model and honours the value of the reservoir attribute at the well control points exactly. Kriging techniques vary in the way that the mean value of the attribute is estimated. We used simple kriging in our study which assumes that the mean value is constant over the entire mapped area.
Cokriging extends the concept of kriging by adding on additional constraint in the form of a guiding attribute related to the primary reservoir attribute (ie. porosity). In most instances, this guiding attribute is derived from seismic information. Cokriging replaces the spatial autocorrelation model of the reservoir property with a spatial cross correlation model between the reservoir property and the guiding attribute. Cokriging honours the well-derived control points exactly and incorporates seismic information to the degree that the guiding attribute is correlated to the reservoir property. If the correlation coefficient is perfect, cokriging reduces to a simple linear regression. If the correlation coefficient is equal to zero, cokriging reduces to kriging. Between these extremes, cokriging honors both solutions dependent upon the distance from well control points relative to the spatial correlation length and the value of the correlation coefficient.
The major advantage of geostatistical techniques is the ability to assess uncertainty in the mapping process. Kriging or cokriging produces on estimated error map that is derived as on initial control. A second tool; conditional simulation, produces a number of equally probable maps that are within the uncertainty estimates mode by the kriging process. Token together, these realizations explore the expected uncertainty in parameter estimation based upon the uncertainty present in the data. Sequential Gaussian Simulation (SGS) is one of the conditional simulation processes that is based upon the kriging techniques. SGS simulations can be conditioned by the well information alone (like kriging) or with the well information together with guiding attribute information (like cokriging).
Estimating pore volume of the Reef Conventional reservoir characterization
The initial pore volume estimates were mode in a standard deterministic fashion. First the seismic time map for the reservoir top was converted to depth using a linear regression relationship. Reservoir thickness was estimated by subtracting a constant oil-water contact depth from the reservoir top. Porosity log values from each well were blocked and averaged vertically over 10 meter intervals within the reservoir. These overage porosity values were interpolated along geologic trends and then vertically averaged to produce a porosity map of the field. This porosity map was multiplied by the thickness map to derive a porosity thickness distribution which was integrated over the field area to derive a pore volume estimate.
Geostatistical mapping from wells alone
Geostatistical depth maps were created using collocated cokriging. This technique used the seismic time map for the top of the reservoir to interpolate depth between existing wells, but unlike linear regression, it was constrained to tie the known depth at the well locations. A set of ten alternative depth maps were created using Sequential Gaussian Simulation (SGS) techniques to study uncertainty in the mapping process. We then subtracted the constant oil-water contact from the depth maps to create a set of isopach maps.
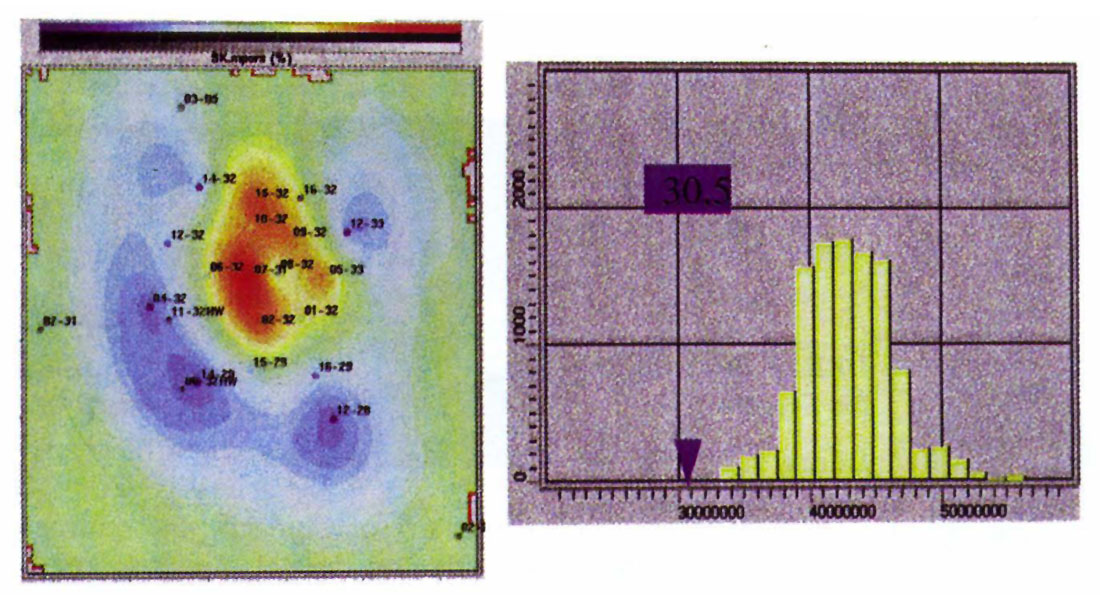
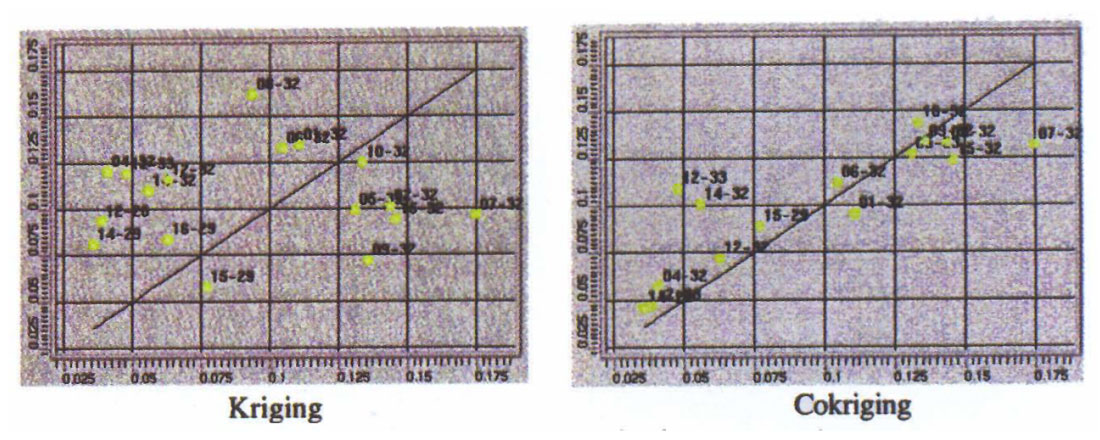
Our first approach at mapping the spatial distribution of porosity in the reservoir was based on the well information alone to provide a calibration for the other mapping processes. We used simple kriging to map the spatial distribution of vertically-averaged porosity in the reservoir. The spatial correlation study revealed that porosity variations between the wells were random (the correlation length was smaller than the interwell spacing) and a consistent trend could not be identified. Not surprisingly, the kriged porosity map was unrealistically smooth and did not represent the expected variations of porosity in the reservoir (Figure 1). We tested the prediction accuracy of the kriging technique by performing across-validation analysis: each well was systematically hidden and porosity at that location was predicted by kriging based on the porosity values at the other wells. Cross validation revealed that the prediction accuracy from kriging was very poor (Figure 4). This result was consistent with the high degree of spatial variability that was observed in the spatial correlation study. SGS was used to create 100 equi-prabable realizations of the porosity distribution based on the well data. These maps represented the spatial variability of porosity better than the kriging result, but showed a high degree of variation in porosity distribution between the various realizations. Pore volume was estimated by multiplying each porosity realization with each thickness realization and accumulating the results. This provided 1000 possible pore volume estimates for the reservoir and these were displayed in histogram form to assess uncertainty. As predicted by the variation in the SGS porosity simulations, there was a large uncertainty in pore volume, and the estimates were all significantly greater than the deterministic result (Figure 1).
Geostatistical mapping with seismic attribute constraints
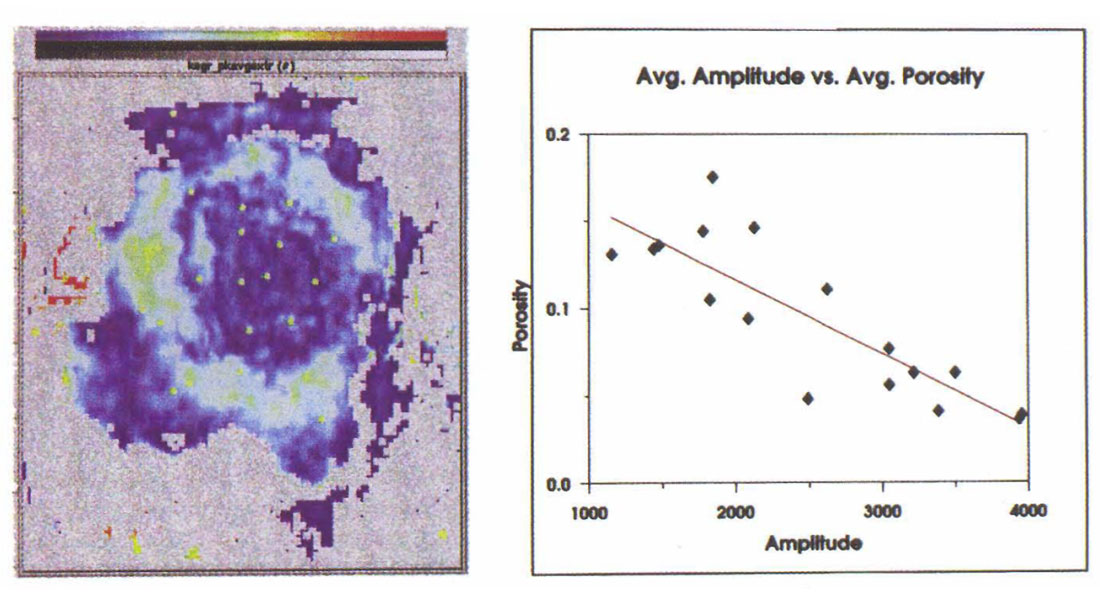
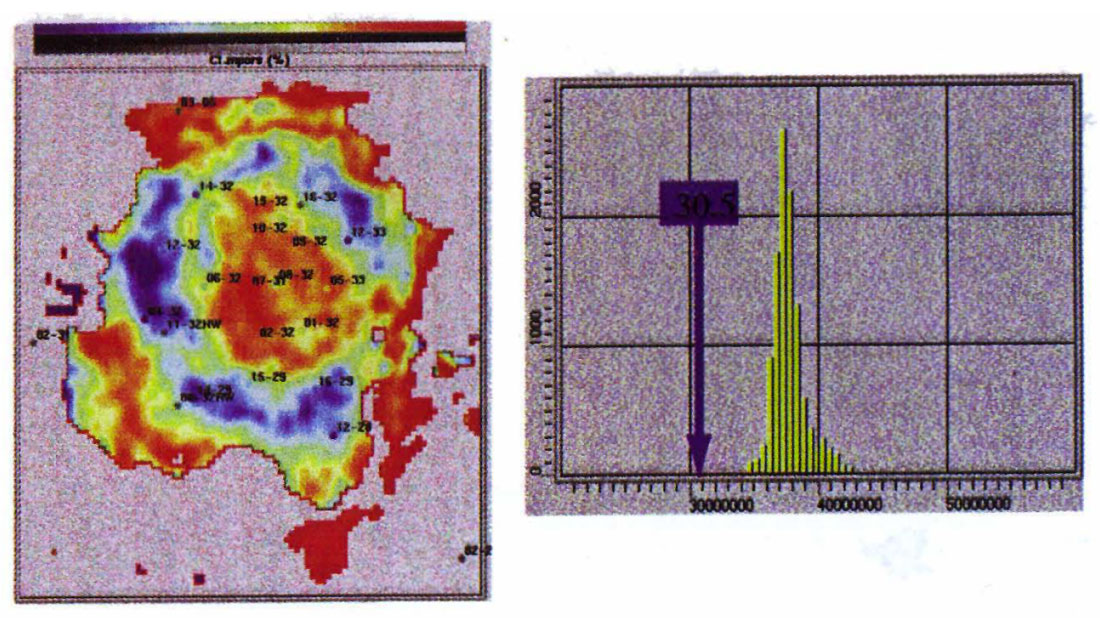
Numerous seismic attributes (such as instantaneous phose and frequency and various amplitude properties) were extracted and crossplotted with the overage porosity values at corresponding well locations so that their relationship, if any, could be calculated. A strong correlation (R= -0.75) was found between the logged porosity and a peak amplitude overage extracted from a time window corresponding to the reservoir zone (Figure 2). This seismic attribute was used to guide the porosity interpolation using the collocated cokriging technique. The inclusion of the seismic attribute data added detail to the cokriged porosity map, and the corresponding error map indicated that the prediction accuracy was greatly improved over kriging (Figure 3). Cross validation further confirmed improvement in prediction accuracy of the collocated cokriged porosity map over the map derived from kriging with the wells alone (Figure 4).
SGS simulation created 100 realizations of the porosity distribution, this time consistent with both the well log and the seismic attribute data. These maps, much more consistent in the spatial distribution of high and low porosity areas, were combined with the thickness maps to create a probabilistic pore volume distribution. The new histogram indicated that the expected pore volume was somewhat smaller than the one obtained from the well data alone. More significantly, the seismic attribute data seemed to greatly reduce the uncertainty in the pore volume estimate (Figure 3).
The only unexpected result was that the pore volume estimates from the co-simulations was much higher than that of the original deterministic model. This suggested that the pore volume derived from the detailed geologic analysis was extremely unlikely; outside the range of possible models based on the statistical results. There had to be a serious error in either the geologic interpretation or the statistics.
Validation of geostatistical maps
The reconciliation of the disagreement between the geostatistical and deterministic pore volume estimates required are view of the geologic model and of the statistical assumptions that are implicit in the geostatistical mapping techniques. In this case, the geological model had been based on many other sources of information such as the study of nearby fields, regional geologic trends, comparison with modern day depositional analogues, and outcrops. In addition to these qualitative comparisons it was also possible to demonstrate that the model fit the physical response of the seismic and that the model was consistent with the production and pressure history of the field. By contrast, the geostatistical model had been derived solely on the 17 wells from the field, combined with highly specific seismic attribute data. There was a good possibility that the porosity statistics, based on drilling the best reservoir areas, were biased and not representative of the entire field. There was also a reasonable chance that the seismic attribute correlation was misleading (Kalkomey, 1996).
We mode a detailed comparison of the geologic and geostatistical porosity maps to assess where the major differences in pore volume were occurring. We could distinguish three areas: the reef interior, the reef flank (or apron), and the inter-reefal facies. The major differences in the porosity maps were located beyond the reef flank, in the inter-reefal area. No wells directly penetrated this port of the inter-reefal facies to prove which porosity was correct. However, it could be reasonably inferred from the absence of porosity in 2 nearby wells, regional geology, and the lock of aquifer pressure support, that this area surrounding the reef was not highly porous (as suggested by the geostatistical map).
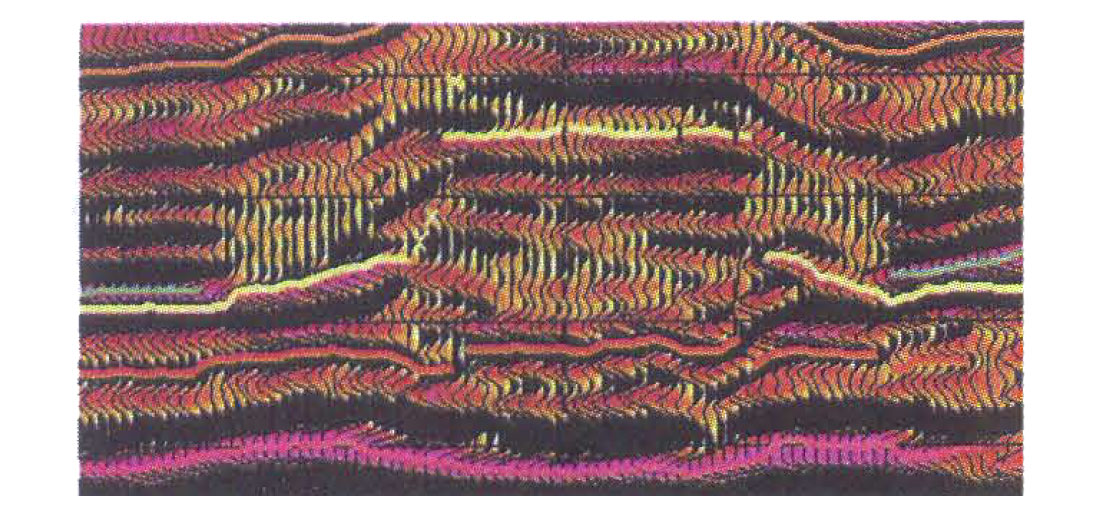
The second step in the geologic validation was to compare the seismic response to the geologic model (Figure 5). In the course of this analysis it was discovered that the overage amplitude variable used in cokriging was not consistent over the field area. This seismic attribute seemed to be related to the presence of tight zones in the reef interior (which supported the use of the attribute), but it was strongly affected by tuning due to changes in thickness (rather than porosity) in the reef apron. Beyond the reef apron, it was determined that this attribute was strongly affected by major changes in rocks properties above and below the reservoir. In light of these conditions, it was unlikely that the seismic overage amplitude was really a reliable guide for porosity interpolation over the entire field area.
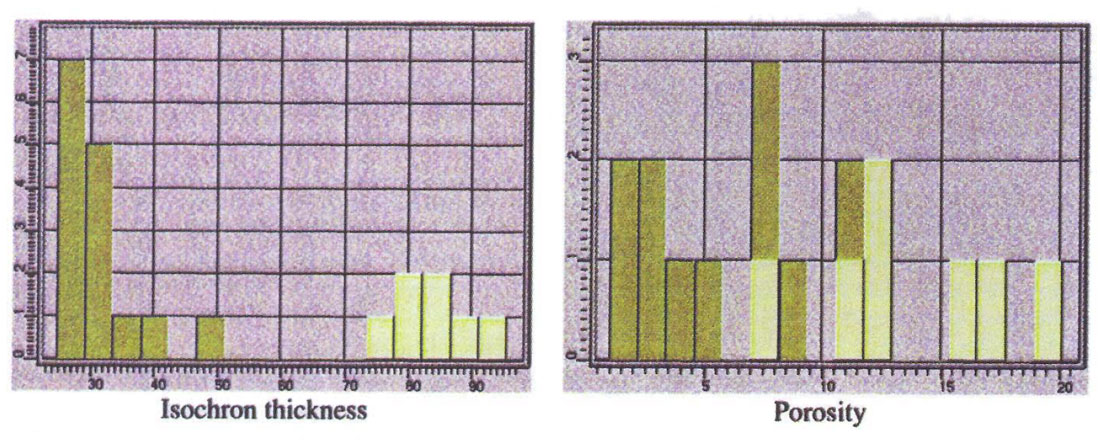
The geologic review suggested that the geostatistical maps were not reliable. Based on this assessment, we performed a detailed study of the statistical behavior of the available data. The first step was to examine the porosity histogram to determine if the data were normally distributed, or if there was evidence of more than one population. Unfortunately, based on the distribution of the 17 wells, it was possible to interpret the histogram either as a normally distributed population with a mean value of 8% porosity, or a more complex bimodal population. An additional test was performed by grouping the wells in the reef interior separately from the wells in the reef apron. This analysis demonstrated that the data represented two distinct populations, with a mean porosity of 13% in the reef interior and only 5%in the reef apron (Figure 6). This bi-modal porosity distribution violated the basic assumption of stationarity in the kriging and cokriging processes and caused on overestimate of the overage porosity of the field.
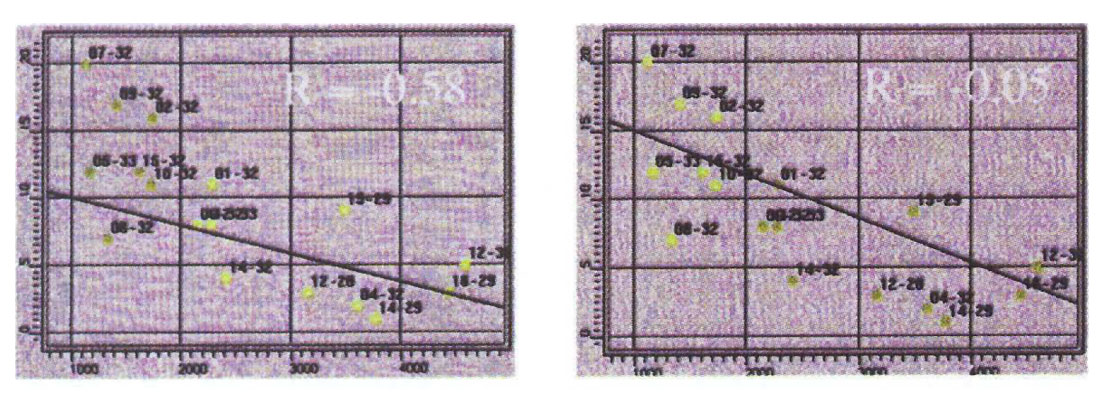
We tested the seismic amplitude to porosity relationship by forming a linear regressions separately in the reef interior and reef margin (Figure 7). When the regression was estimated from the wells in the reef interior the regression line projected through the points representing the apron wells, however, the correlation coefficient value fell to 0.05, suggesting a very weak correlation. When the regression was formed using the flank wells the correlation coefficient value was higher, but the regression line did not estimate the high porosity interior wells. This indicated that the regression relationship was not stationary, but changed as a function of reservoir facies.
These tests verified that the statistical model that had been used to create the geostatistical maps had been in error. The reservoir characterization had to be done again, and this time the reef and flank areas were separated prior to mapping.
Revised geostatistical maps
The first step in deriving the new geostatistical maps involved partitioning the wells into two groups, representing the reef apron combined with the inter-reefal area (smaller isachron times) and the reef interior facies (larger isochron times). Correlations were estimated between seismic attributes and porosity in each of the 2 groups independently. Separating the wells into 2 groups increased the uncertainty in sample statistics which increased the need to understand the physical relationship between seismic attributes and porosity.
Porosity was found to correlate with the seismic amplitude from the top of the reservoir. This makes physical sense because the caprock impedance across the top of the reservoir was essentially constant, and increased porosity in the reservoir lowered average impedance below the constant interface. This resulted in increasing porosity causing a higher amplitude trough at the top of the reservoir. It was also observed that porosity was highly correlated in a vertical sense, and the porosity at the reservoir top was usually representative of the average porosity in the reservoir. One well proved an exception to this rule, and slightly degraded the correlation coefficient between amplitude and porosity.
In the reef apron, variations in porosity were completely independent of amplitude. It was discovered that average porosity was correlated with seismic travel time to the reef top or the reef isochron. This is consistent with the geologic model because the higher porosity facies is a larger percentage of the total isopach as the reef apron thickens. Therefore, thicker isochron times infer a thicker section of the higher porosity facies and a higher average porosity. This relationship appeared to apply in the inter-reefal area as well, where the thinning isochron indicated a further reduction in porosity. It is interesting to note that there was no correlation between average porosity and isochron in the reef interior.
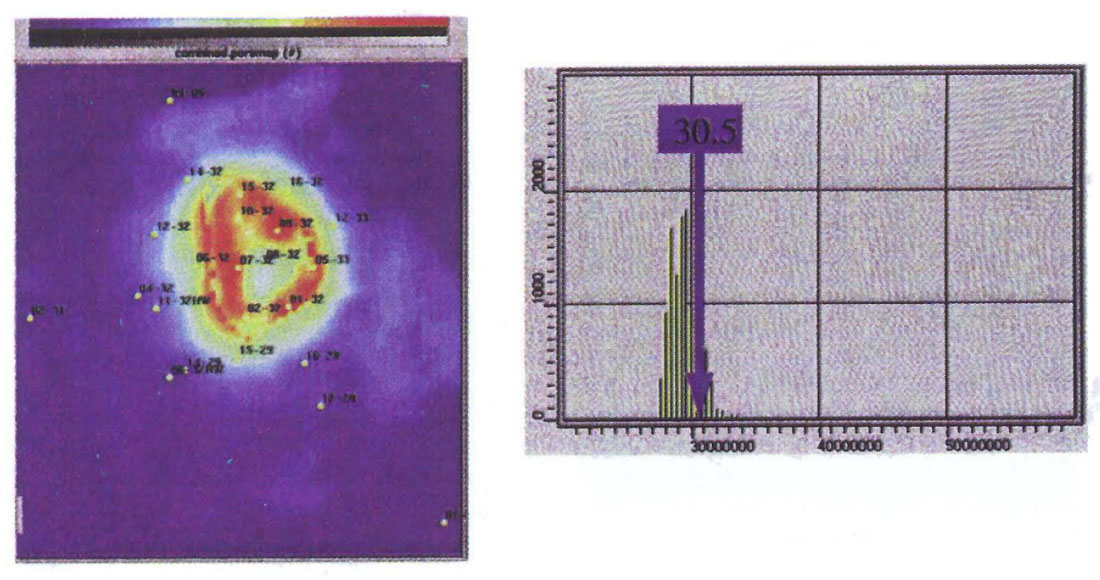
Sequential Gaussian Cosimulation was performed in the reef interior and the reef flank/inter-reefal areas separately. Average porosity, porosity variance, as well as the seismic attribute regression was used only in the areas of the map that corresponded to the appropriate geologic region. The resulting maps were combined to produce a map of the entire reservoir (Figure 8). The pore volume estimates derived after partitioning the reservoir into the appropriate geologic regions agreed favourably with the deterministic result, and also provided a reasonable assessment of uncertainty.
Conclusions
Traditional reservoir modelling is deterministic and labour intensive. A unique model of the reservoir is derived, but it is very difficult to quanti~ uncertainty in reservoir parameters. The models are also heavily biased by geologic interpretation because it is difficult to integrate seismic information effectively. Geostatistical modelling allows geoscientists to easily integrate geologic trends, petrophysical information, and seismic data, but in doing all of this, it is very important not to loose sight of the fundamental geologic concepts that must be considered in building a realistic model of the reservoir.
Limited well control and biased sampling of well information makes it difficult to assess whether the statistical characteristics of the field are consistent with the assumptions of the geostatistical techniques. If the basic statistical assumptions are violated, the resulting maps can lead to false conclusions about the reservoir parameters and about the uncertainty in the parameter estimates. We can, unfortunately, become highly confident in an erroneous result. Seismic interpretation, seismic modelling and geological interpretation techniques must be used to ensure that the statistical interpretation of the reservoir is meaningful and that basic assumptions are not violated.
When correctly employed, the integration of geostatistical, geophysical, and geological techniques can produce meaningful models of reservoir parameters, with realistic uncertainty estimates. This can also be done in a fraction of the time that would be required with traditional modelling techniques. Geostatistical techniques allow us to effectively and efficiently define confidence limits on reservoir parameters.


Join the Conversation
Interested in starting, or contributing to a conversation about an article or issue of the RECORDER? Join our CSEG LinkedIn Group.
Share This Article