Creating value and planning for success in field development operations is a multi-disciplinary process that needs both a learning and an integrative approach to optimize capital. Technological advantage for producers comes from implementing just-in-time processes continuously with software systems that do the hard work in the background to provide Dynamic Intelligence® for operations teams and their drilling programs. The real-time cycle of building, updating, informing and adjusting helps to keep costs low. Price of services, life cost of wells, usefulness of the wells to reservoir management and impact on project economics should all be considered in value creation.
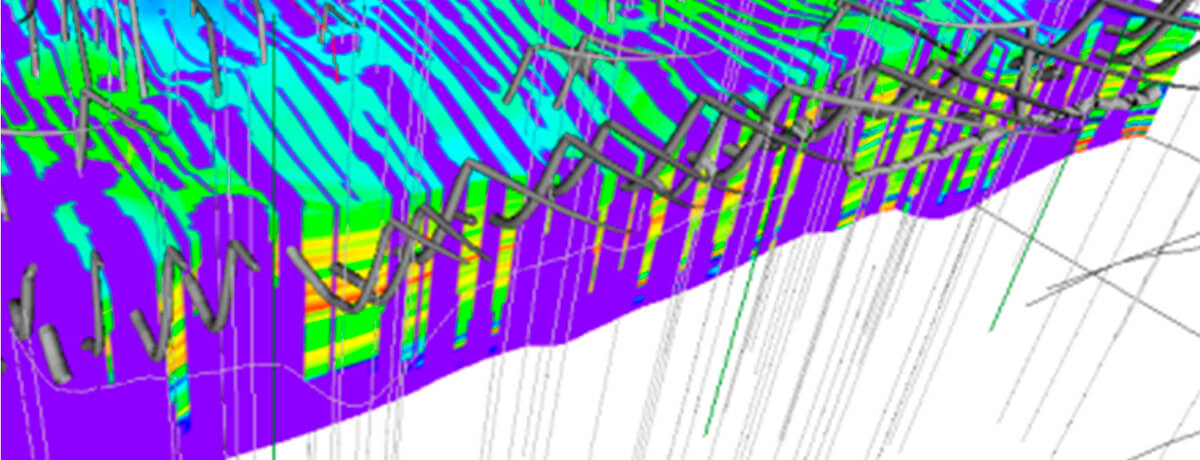
Combining real-time updatable 3D geomodels for geosteering with a reservoir engineering process for drainage modelling reduces risk on well placements. The robust geomodels catch deviations early, while geosteering and its Volumetric Sweep Mapping (VSM) simulator helps visualise well and frac drainage patterns in both conventional and unconventional plays. Utilizing a geomodel with VSM helps the operations team to avoid low-pressure areas and mitigate frac hits by better pre-planning. Pre-drill integrated studies and while-drilling processes improve well placement and NPVs with multidisciplinary technology. Technology acts as a hub for projects including geomechanics, completions, G&G lithology/property modelling, and drilling optimization as a continuous improvement process for field operations.
This paper takes a look at different characteristics and components of good well placement practices. Various KPI’s can be tracked by operators to create a baseline and examine progress. Some examples and results are provided based on field learnings. Market forces are pushing producers and service providers towards placement optimization, added efficiency, and drilling automation technology.
Introduction
In geosteering, to dynamically drive forward with confidence and accuracy in the target with minimum doglegs, real-time solutions should not only allow us to correlate to the last survey point (how we got here) but calculate the optimal 3D path forward relative to well plans.
By using previous G&G datasets and in real-time building of 3D models including structures, dips, thicknesses and rock properties, we can create an immersive 3D pathway ahead of the bit. Through automation processes, cycle-time between 3D mappings has been reduced to minutes, which allows the operations team to use the most recent mapping results (providing spatial accuracy) at all times to make better decisions.
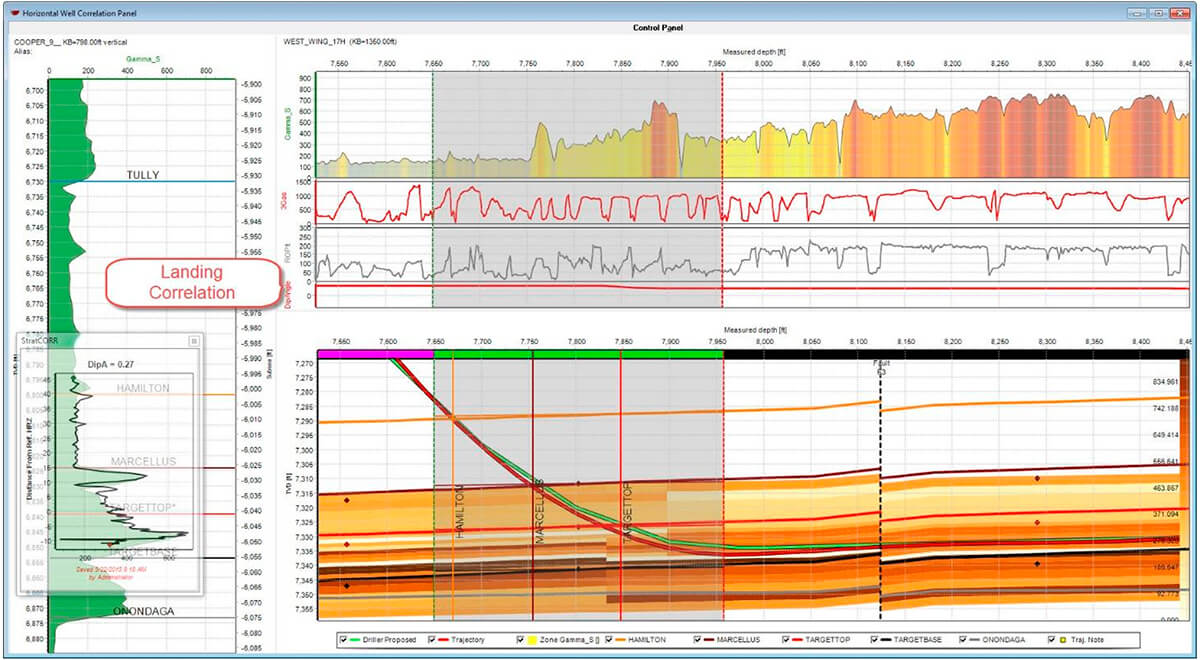
SMART4D’s predictive mapping and geosteering system, with the property modelling approach, adds efficiency and a better workflow for operations teams, adding accuracy for landings and laterals by a proactive geosteering process. True 3D modelling of the variability of rock properties is integral to geology and the nature of rock formations. This provides the stakeholders a true understanding of the road map and spatial context with which they are dealing.
Technology Accessibility
Team accessibility to real-time geo-model results through the cloud, as well as web-based reporting and rig data automations, connect operation team members to make better decisions on time. Reducing stress for operations teams is a real issue. Cost challenges have pushed more work on the back of geosteerers. Making decisions 24/7 or early AM on a multitude of wells drilling has to be taken more seriously. We will likely be able to make more optimal geosteering decisions using robust models that show us the drilling corridor ahead, eliminating guesses on way points ahead.
Key Performance Indicators (KPIs) can be gathered for every well drilled by operators. The list below provides a basis for comparison and examines the case and value proposition to improve operations.
It's important to note that the success of each well/drilling program is dependent on a long list of technical and non-technical criteria. Collectively, success rests on the technical preparation, execution, and reflection cycle by multidisciplinary teams. Any breakdowns in collaboration between the geoscience and engineering teams will reflect poorly on project economics.
Here are just some of the characteristics of good well placement in tight oil/unconventionals and conventionals that improve well and project economics.
Some examples are provided based on our projects, both through direct technical involvement or through our technology.
1-Formation or structure prognosis accuracy
High confidence on prognosis ensures landings into targets at lowest DLS with dynamically modelled structures and progs to ensure smooth landings. (Cenovus example: Formation accuracy for landings increased by 54% in an 80 well drilling program in the WCSB.)
2-Geology and geophysics (G&G)
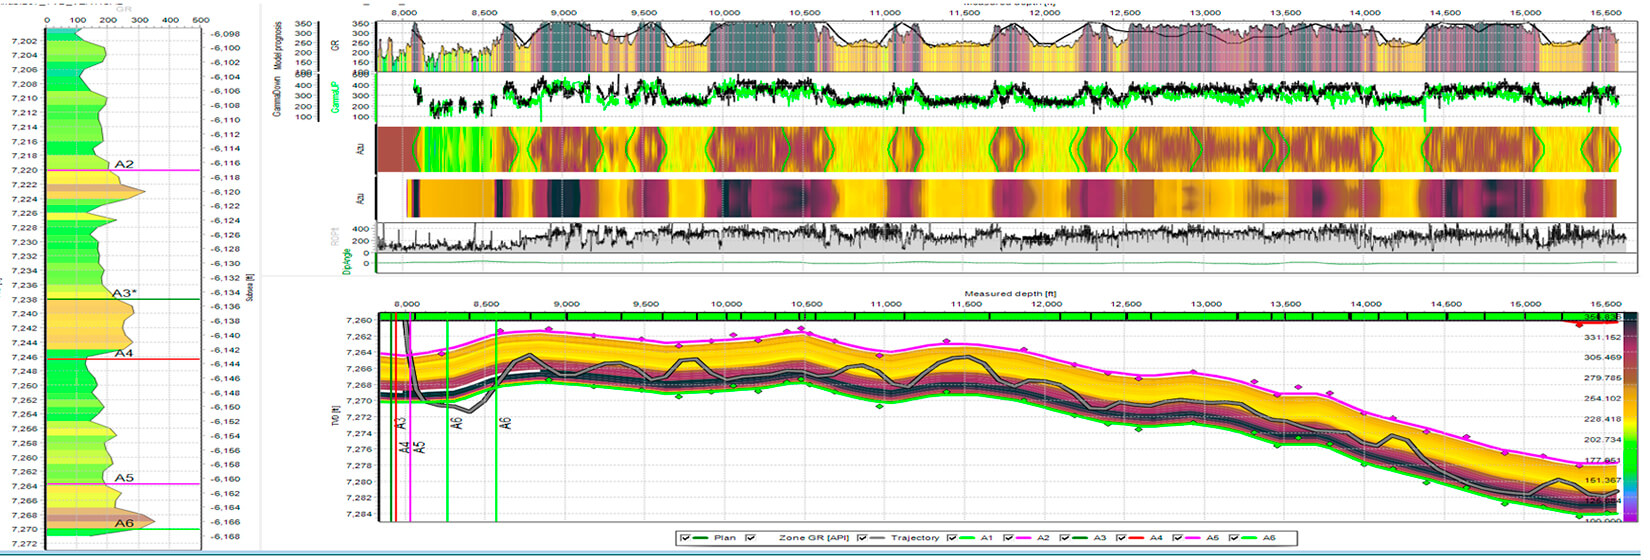
Modelling variability of rock properties in 3D can provide us with pre-drill and while-drilling perspectives on our positions relative to the target from the start, at the current drilling position, and all the way to TD. Up-to-date geo-modelling while drilling (WD) and automatic mapping of structures, isopachs and property models give an up-to-the-minute spatial awareness to drillers and the team. This view to the drill incorporates WD data and geology. It provides a hub and platform for better decision making.
3-Good landings will ensure max lateral length.
If we land too high, it will take additional footage to get into the target, reducing the length of the resulting lateral. If we land too low, a trough is created at the heel. Correct landing in the desired sweet spot should be expected every time.
4-Minimizing doglegs (DLS) for landing into targets
Better 3D models and processes with active geosteering have improved every well’s landings. Clear correlation facilities with real-time data and model updates and panels help the process. (Example: Cenovus reported 16% reduction of DLS in landing of an 80 well drilling program in tight oil in the WCSB.)
5-Maximum placement in the target zone (100%)
The bar has to be placed high at 100% for every well. (Example: Sheridan’s 40 injectors placed in a Powder River Basin oil play with over 100 wells (10’ target). In-zone placement improved from 82% to 98%.)
6-Minimum DLS in the laterals
The goal has to be low DLS (absolute and cumulative) in the lateral to reach the planned TD and to maximize frac placement opportunities. Fracs towards the toe of horizontal wells have been forfeited due to high DLS areas in laterals. High DLS and tortuosity lead to excessive friction and the dangers of getting stuck. (Cenovus example in the WCSB tight oil play: 36% reduction in the maximum lateral DLS in an 80 well program.)
7-Faster drilling
Every producer wishes to drill faster with improved drilling systems to reduce capital costs. This is only possible if you have a better road map in 3D. Needless sidetracks happen in the industry because of poor maps and processes that do not take all offsets into consideration.
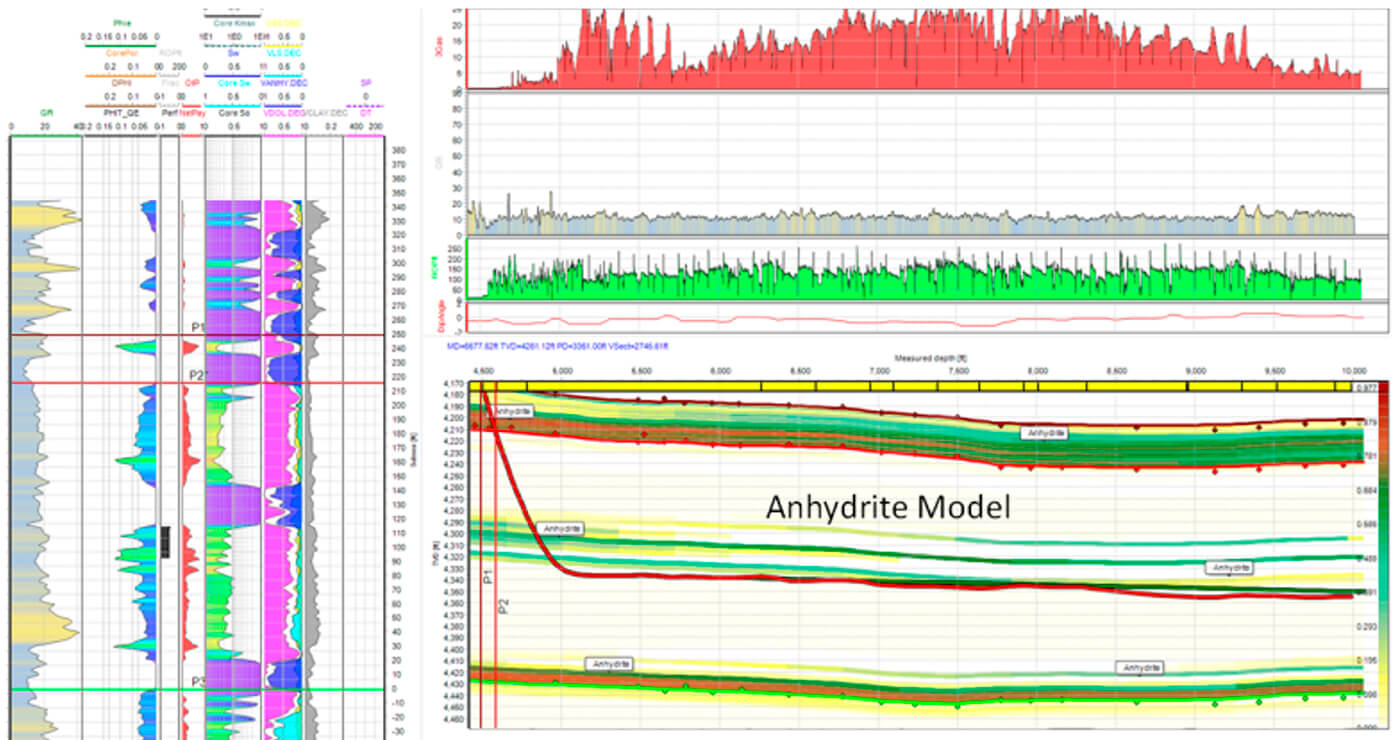
Faster drilling and mitigation of geological risk by avoidance of more abrasive anhydrites to save bit and trippings is an example of how one client saved 3 days off an 8 day lateral, ~$0.45MM by knowing the spatial distribution of anhydrite.
8-Accurate surveys
While-drilling magnetic survey corrections make sure that all wells are correctly represented in the model, as they may be potentially off from where you expect them to be. Use of corrected surveys is recommended.
There are services that convert the MWD survey and in real-time provide the corrected survey. It is possible to have wells surveys of the offset wells and the target wells vary, risking well placement by over 100’ laterally. Vertical position of the well may also be off due to survey errors.
In the processes presented, we can also visualize survey errors in 3D. Typically the errors accumulate from the KOP to TD by a factor.
Example: In integrated reservoir studies, United has designed wells in a ultra-mature heavy oil project with <4 acre well placement density in remaining oil pockets with its VSM process that will be described later. 95 new horizontal infills were placed in new oil pockets with 100% success in a 10 year period.
9-Cementing
Trajectories should be placed with minimal troughs and undulations, as cement may not reach the top of the liners in the trajectory peaks, creating uneven frac behaviour and adversely affecting completions. Planning wells and selecting way points that minimize this issue can help completion results.
10-Completions
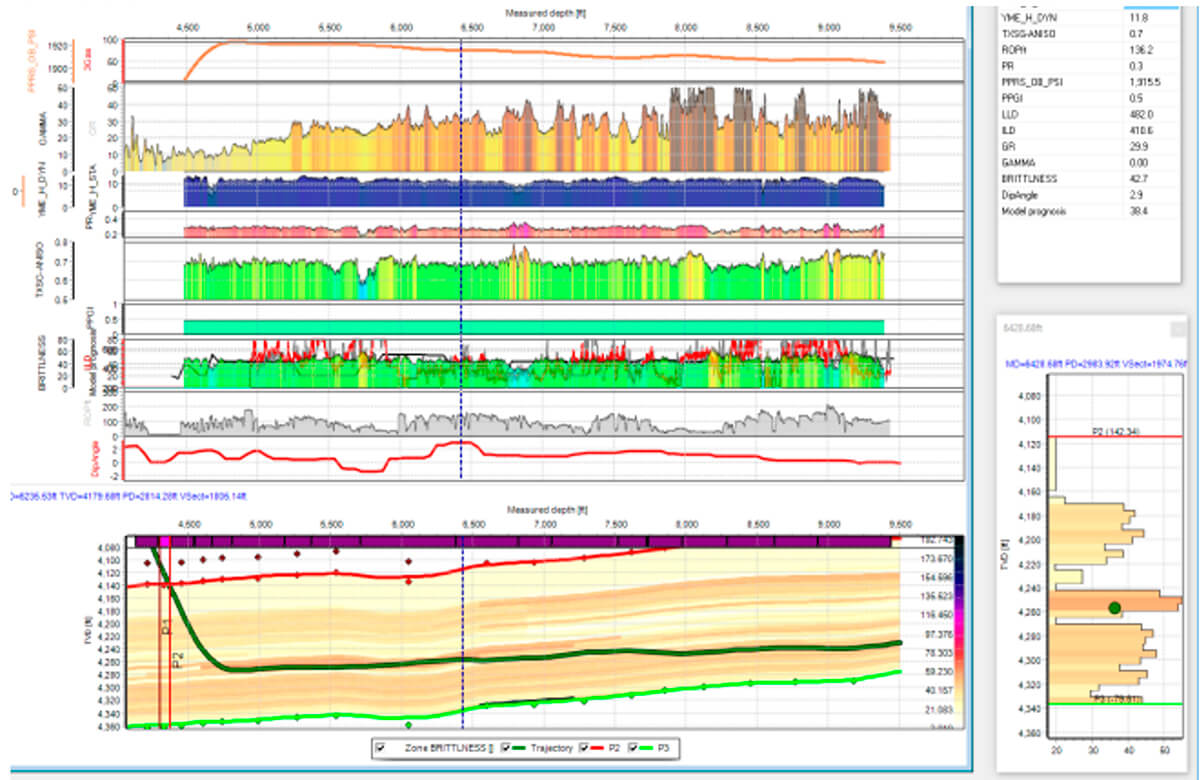
We can enhance completions by having low lateral doglegs and by fracking in the engineered sweet spot, typically with high TOC and brittle rock. High Young’s modulus (YM) and low Poisson’s ratio (PR) correspond to better frac performance, larger SRVs, and higher initial rates and recoveries.
Pre-drill and while drilling, 3D geomodels corresponding to geomechanical properties can be available in tandem with gamma to ensure optimal and continuous placement. In this case, way points selected (at minimum doglegs) ahead of the last survey (while geosteering) satisfy multiple rock property requirements.
11-Pump placement
The quality of the wells we drill now will have an influence on project economics and the future health of the company. The curvature of the wellbore in the landing area can reduce the life of submersible pumping equipment.
Designing and drilling horizontals with a relatively flat segment at the landing area will help minimize pump failures. This is a costly issue and can add an unanticipated cost of about $0.5MM/year/well.
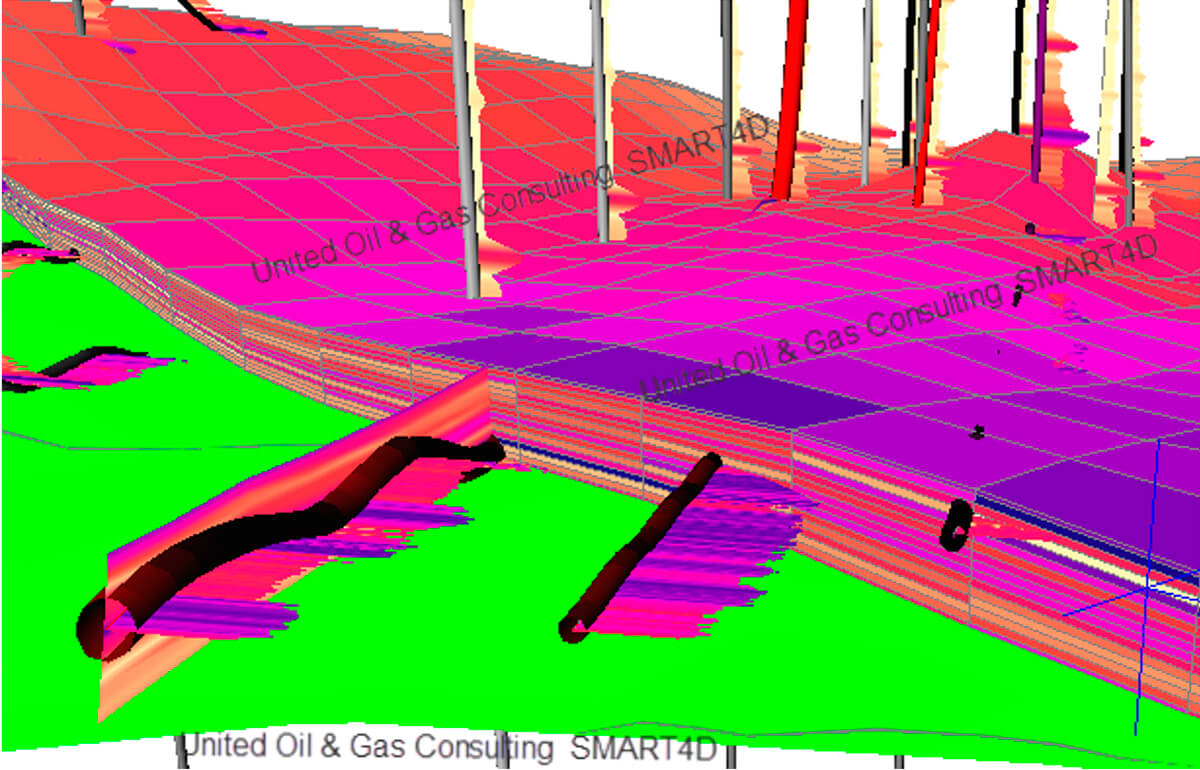
12-Visualization
It’s important to visualize the context of well plans, trajectories, offsets, and geo-hazards such as faults so as to have the structure, dips and properties to build a situation awareness. The more we know about the road ahead, the better and faster we can drill. We have found through experience that directional drillers (DD’s) will pay great attention to the overall plan and naturally want to reduce DLS by viewing the most current geological context and the path to TD. As we show drillers magnified vertical scalings of trajectories in live panels, we find them intuitively to want to reduce doglegs. More importantly, as they anticipate dip changes ahead (using the live/interactive geo-model) DD’s tend to reduce doglegs.
13-Team communication and automated reporting
Team collaboration and communication is facilitated through real-time automated reporting, working with real-time geological models. Having a shared plan forward reduces the burden on the operations geologists, allowing them to concentrate on geological modelling and optimizing the way points ahead. This process with models and automation increases productivity to carry a larger load when multiple rigs are involved.
Real-time panels and websites provide the context for drillers in an integrated fashion. Geoscience/geological input comes in through correlations and model updates and way points that actually reduce the DLS.
14-Intangible items in drilling operations that influence well results
Reducing stress for operations teams is a problem that influences the health and safety of a well and the team. The team may include the project/geosteering geologists, drilling engineers, and directional drillers (DD’s), and management should be part of every program. I believe using better 3D technology adds situation awareness and reduces the pressure on the drilling team by more confident way point selections that reduce DLS at every turn.
Geosteering operations centers with mainly 2D software are doing the bulk of the job in resource plays. Uses of interactive 3D geo-models for geosteering have not taken off due to bulkiness and complexity they entail. As a result of this issue, 3D models are exported to 2D geosteering software, and results are again pushed back to 3D products after drilling.
Interactive 3D modelling allows operations geologists to manage their drilling activity with better results and less stress, vastly improving well placements.
15-Cost reduction in geosteering
Horizontal wells are costly, and saving money below the AFE is a goal that every drilling engineer or producer wants. Some cost savings, however, are not indicators of value creation and return on investment (ROI) or net present value (NPV).
The cost of total well ownership, the utility/usability of the well as a producer/injector, and the impact of the well in project economics all need to be considered. The above items altogether represent the value proposition.
Geosteering support services have become a commodity and “the lowest cost” its supposed value. To move beyond this problem, we need closer examination of the issues. When geosteering cost is kept very low, we can be sure that something is getting dropped off in the process. Good geosteering requires expertise with the right tools just as in a surgical process.
16-Rig data automation (WITSML)
Multi-tasking of vast while-drilling data streams and integration into the geological context can be supported by automation with WITSML services rather than by manual/email loading. Automation is needed for operations geologists to do a good job on correlations, updating models, way point selection, and reporting. Geosteering operations systems can support the team for multiple wells by automated data integration, modelling, and reporting. Supporting the geosteering initiatives, operations centers need to add personnel when more attention is simultaneously required.
17-Azimuthal Imaging
Although not a large percentage of producers run azimuthal tools, the trend is that we will see more of this in the geosteering workflow as costs decrease.
Integrating real-time rig data through WITSML (Over 15 servers), we can produce a wellbore image to calculate dip and use it for better well placement. Once data is loaded, the 2,4,8 or 16 tracks of azimuthal gamma can be transformed to develop an image of the wellbore, producing smiles and frowns as it goes up or down strata. Synthetic images can also be extracted from any 3D property model in SMART4D, whether it is gamma, porosity or resistivity.
18-Geomechanics
Geomechanical properties such as Young’s modulus (YM), Poisson’s ratio and brittleness typically come from the operator’s geoscience team or can be generated in SMART4D. For the VSM process min and max stress directions and the full suite of horizontal log interpretations of rock properties can be brought in, and 3D properties can be kriged in 3D. Well issues related to poor placement, large DLS, being out of zone, etc., can result in forfeiting reserves when we can’t complete the stages.
Concurrent well geosteering and cost constraints
With typical 12 hour shifts and personnel changes, project objectives have to be very clear for each well. In larger programs with multiple rigs and stacked pays in an area, it is imperative that the models and drilling plans should also be up to date (the learning model) so effective real-time decisions can be made that include all offsets data and interpretations.
When concurrent models need to be updated, more computing resources and geologist input are required.
The processes described can also include the completions and reservoir engineering involvement for pre-drill and while-drilling planning. These continuous model updates and interventions add huge value to well results.
Under cost restraints and lower oil prices, many operators have opted for the lowest cost services, particularly in the geosteering area within the Permian and many other plays. It is important to note that the cost for geosteering support services and integrated updating of multiple geo-models and engineering while-drilling pale in comparison with the ROIs.
Work process improvement and learning models
Continuous learning models updated from the last drilling processes are enriched and reused immediately for one or many wells. The added just-in-time model knowledge improves well placements over time as the information is retained for future wells. Progs are also up to date and the drilling plans can be quickly gauged relative to the newer geology. Re-integration of geosteered data is skipped in the process we are presenting here, but it is a necessary process if the wells are geosteered outside the project/operations geologists main mapping system.
Model areas can contain a few to several hundred wells, usable to drill hundreds of wells at different bench drilling levels such as in the Permian.
Geometric well placement versus geosteering in 3D models
Even in tight plays with bench drilling, geometric steering (“drilling the plan” with little or no potential consideration of rock property changes) can potentially produce sub-par results and limit well potential and frac opportunities. Just monitoring a well placement for conformance to the well plan is not geosteering.
Since well placement results show up years after drilling, best practices for well placement need to be implemented continuously and at all times.
Active geosteering with integrated 3D models, as described in this paper, will result in optimized opportunities from all of the multi-disciplinary aspects described in the KPI List to optimize ROIs.
Quality control of geosteering services and the value proposition
The challenge for operators to QC, track, reflect and differentiate earlier results from their geosteering service providers (external/internal) is a worthwhile pursuit. Complexity arises from using various systems and post-drill or while-drilling geosteering evaluation services and technologies. Since there is lag of over a year or two before well and completion results are available for analysis, one cannot gauge the performance of the geosteering services, other than whether the cost was low and we saved money, until the wells have been completed and produced.
The main KPI after 1-2 years is the initial rate and the estimated ultimate recovery (EUR) from decline analysis. That’s why best practices need to be implemented at all times.
Continuous improvement in operations that are measurable will lead to value creation. Field studies promoted here create a basis for best development practices to do better and solve issues. In mature fields the historical wells drilled to date provide vast datasets to do proper analysis to optimize drilling and results for the next wells/drilling programs. Post-geosteering the old wells can also show how we can do better.
Reservoir engineering integrated with G&G processes to reduce risk on placement into low pressure areas or swept regions
The next segment of the integrated approach beside good well placement practices is inclusion of an engineering “volumetric simulation” process to better understand the SRV/”frac shadows” of unconventional plays and drainage volumes of wellbores.
The processes presented start from reservoir engineering but overlap into completions and geo-mechanics.
Introduction to the volumetric sweep mapping simulator (VSM)
The following segment of the paper is a reservoir engineering approach or process that was developed to model multiple types of reservoirs. Initial experience was with conventional reservoirs, then unconventionals.
The process was inspired by modelling of swept areas and extended to modelling of fracs/stimulated reservoir volumes (SRVs) in a quicker fashion than conventional simulators.
Volumetric sweep mapping (VSM) modelling of well drainage and frac shadows in oil field development
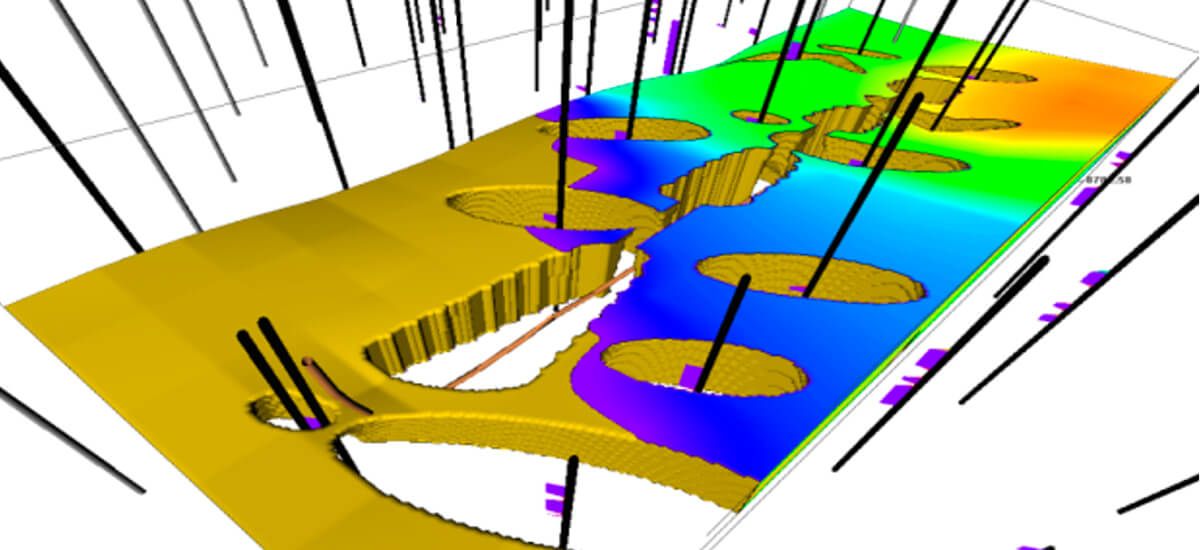
Using the geological framework developed for geosteering and additional reservoir description work in SMART4D, we have developed a reservoir engineering-oriented process over +15 years that started in conventional plays, heavy oil, and waterflood design/optimization for identifying safer infill locations that are not in the swept pathway of existing vertical and horizontal wells. This process is reflected in our volumetric simulator, which uses a downscaled multi-million-cell hydrocarbon pore volume (HCPV) of the reservoir after modelling gamma, porosity, saturation and permeability. This highly successful modelling process has led to drilling hundreds of infills in highly developed oilfields. This has been called volumetric sweep mapping simulator or VSM.
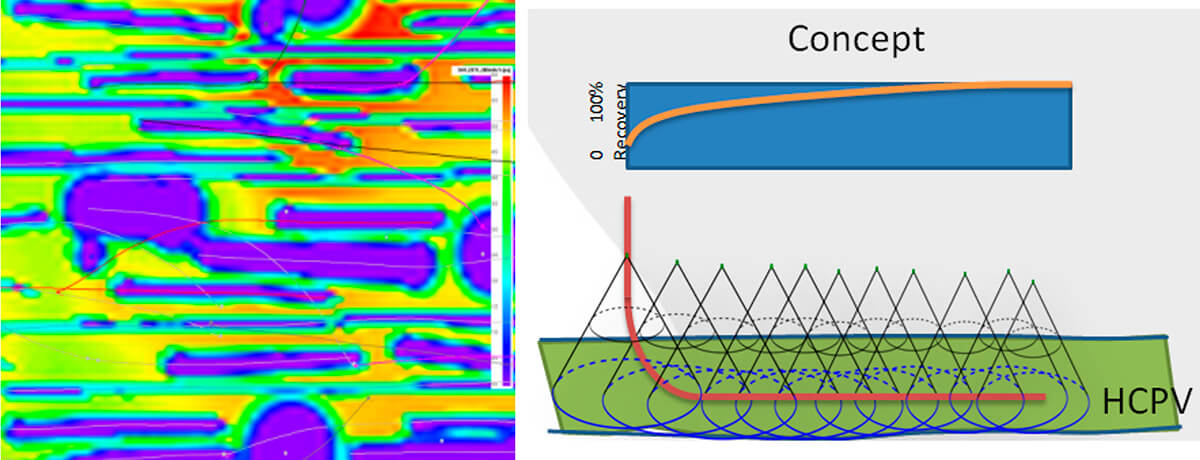
In short the process uses a high resolution multi-million-cell (downscaled) HCPV model (with a few or several hundred wells) with production and completion data (frac data, EURs, preferred drainage/frac directions, etc.) to iteratively chew up movable HCPV from the pathway/spine of a well to its frac wings.
DE (displacement efficiency) is defined as displaced oil (after waterflooding or a displacement process) divided by initial volume of oil. In a single geocellular block it is described as:
DE= (1-SW-Sor) / (1-SW)
= (displaced oil)/(starting volume of oil)
SW=Initial water Saturation,
Sor=Immovable Residual Oil Saturation
Early estimate on displacement efficiency can also come from the end points of the relative permeability curves.
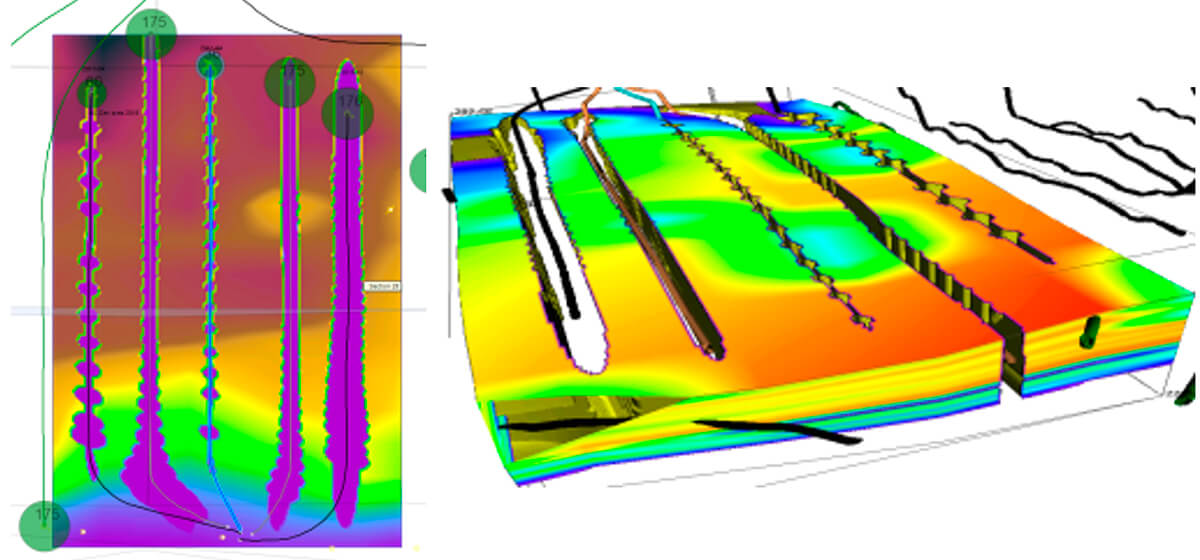
The VSM process was expanded to include tight oil/unconventional plays where the frac stimulated areas dominate the stimulated reservoir volume (SRV) that the will ultimately be recovered from a well.
The VSM process iteratively matches the EUR or cumulative oil produced from each well to the volumes (SRV) extracted from the very high resolution HCPV model for the wellbore and each of its frac stages to a +95% solution and a maximum of 20 iterations. This overall process for a 10 million-cell model with 40 horizontal wells with 50 frac stages (~2000 fracs) each takes a fraction of the time of a dynamic simulator, making it useful for studies or when calibrated, for while-drilling updates on a daily basis.
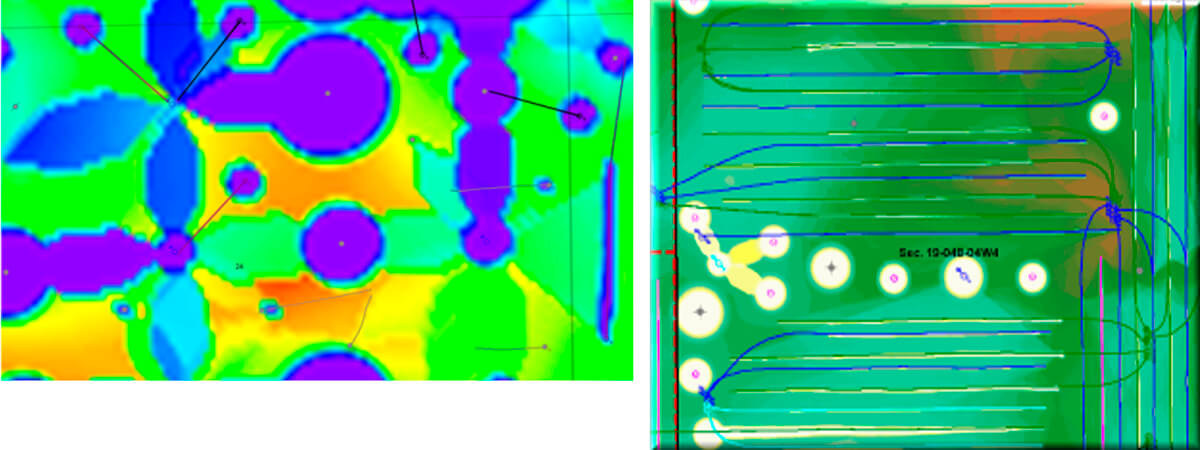
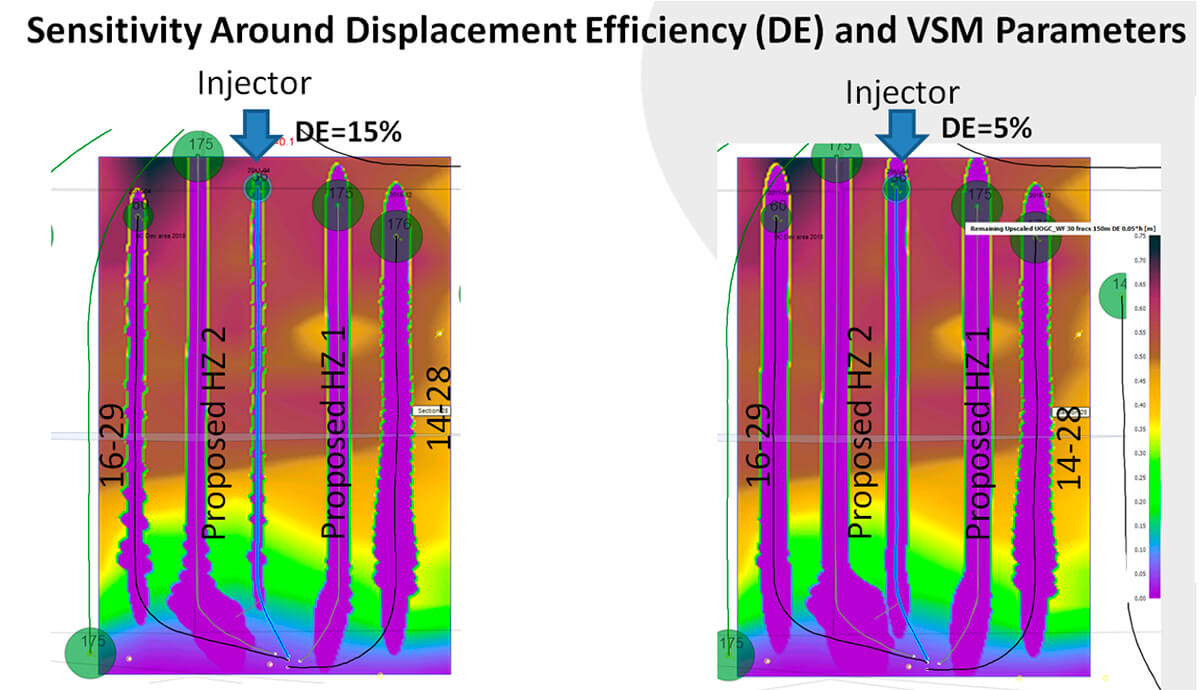
Resulting remaining oil is then summed up onto maps for planning the next horizontals and their fracs. The DEs are further adjusted to reflect pressure or production interference as a base case. Sensitivity cases for the DE can indicate risk tolerances and the necessary pre-drill adjustments on the position of the well laterally and frac stages help optimize the spacing. In various cases recommendations have been made as to areas to avoid fracking to mitigate frac hits / interference zones. In other cases the sensitivity cases on DE indicated that additional wells could be placed without interference concerns.
In the case of bench drilling in unconventional plays, the VSM process can be extended to multi-zone or commingled pool production. The well’s EURs are typically split factors such as Zone1(HCPV*h)/Zone2 (HCPV*h).
Mitigation of frac hits
The VSM processes for modelling of well and frac shadows can be used to mitigate frac hits.
EURs associated with one or more horizontal well plans and associated frac plans can be brought into the modelling process. After VSM runs, any observation of frac shadow overlaps would indicate potential risk of a low pressure area by drainage of a parent well or any offset horizontal or vertical wells. Well path, fracs proppant volume and locations and EURs could all be adjusted and a VSM run repeated.
We can examine the drainage footprint to a time, post drilling EURs to maybe 3 or 5 year of cumulative oil recovery. We can also apply further risk by running VSM with lower DE.
This VSM process can be implemented pre-drill and updated a few times while drilling. Looking at historical data showing drainage/interference from production behaviour or low pressures, we can model the VSM to a date of interest and refine the DE to reflect the observation. Processes are repeated with the planned locations for all wells in the field for one or more years of development.
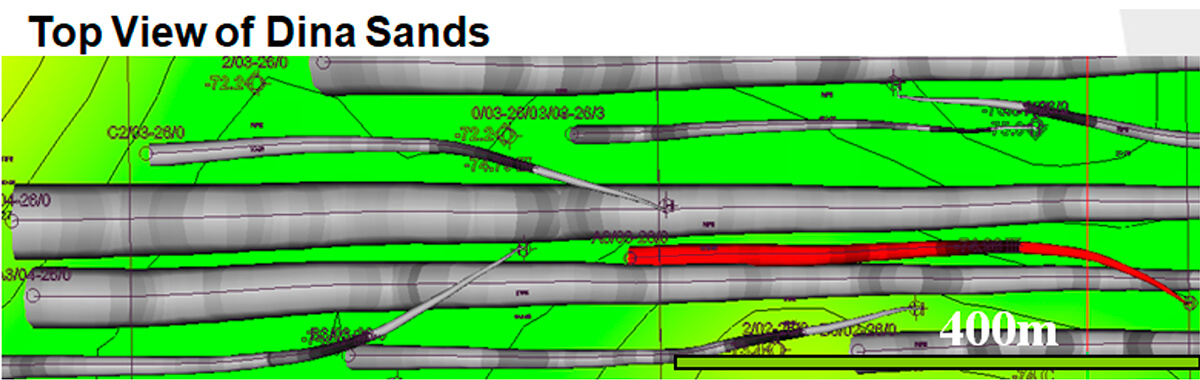
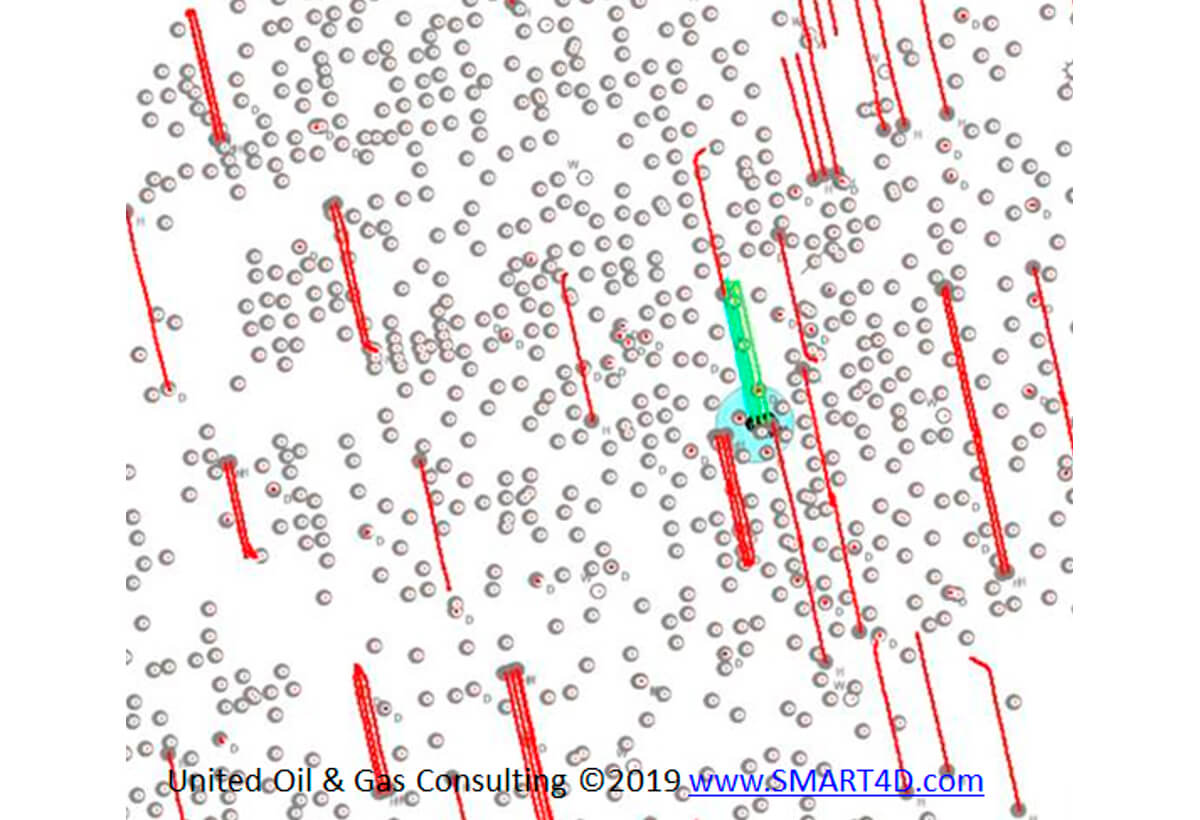
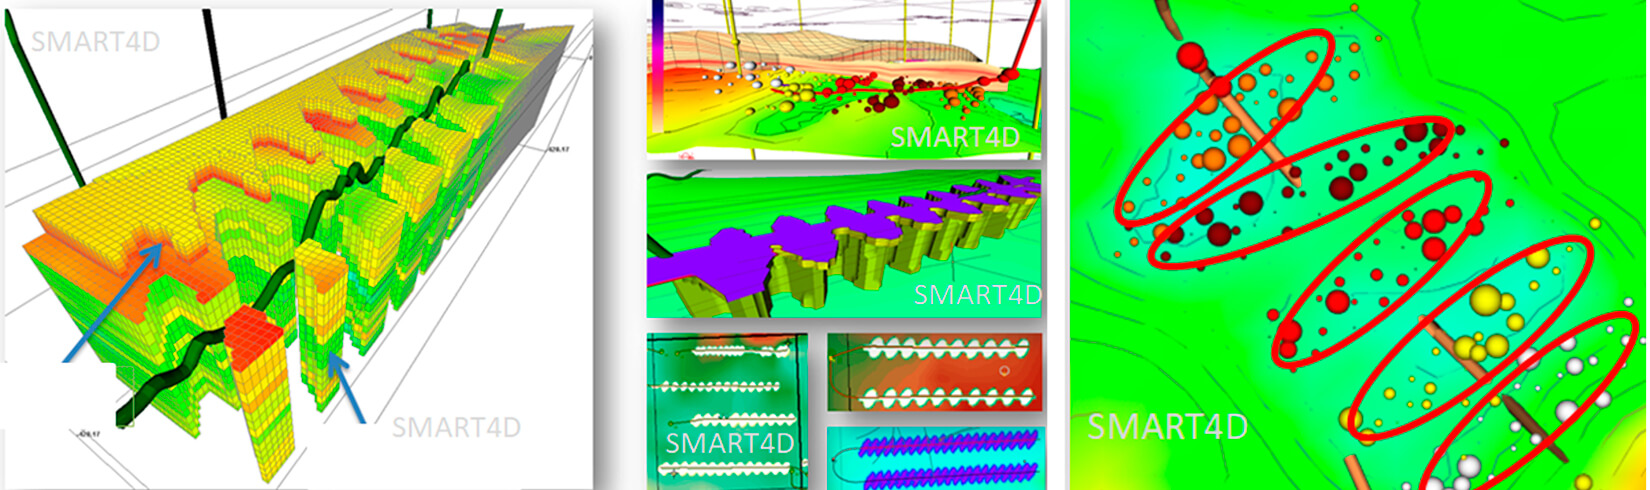
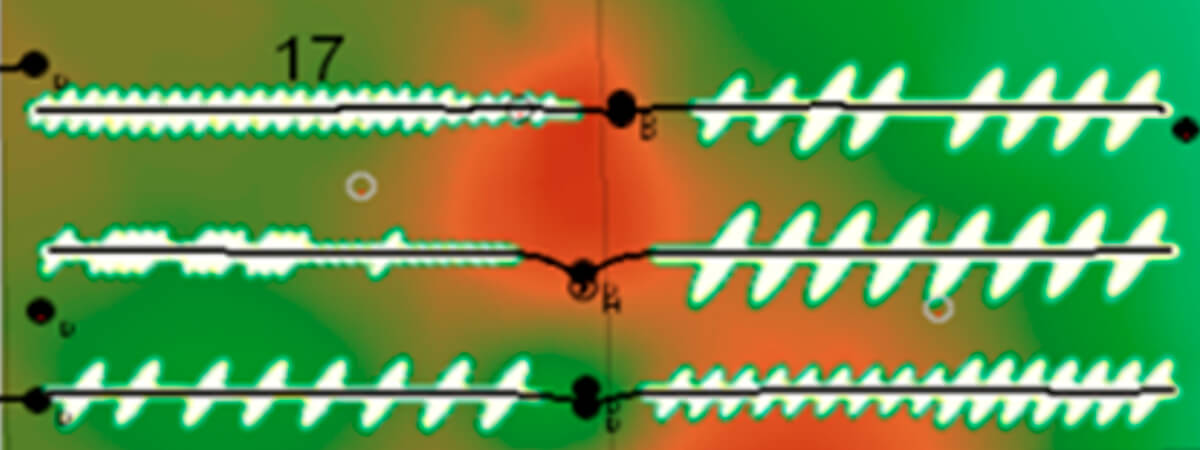
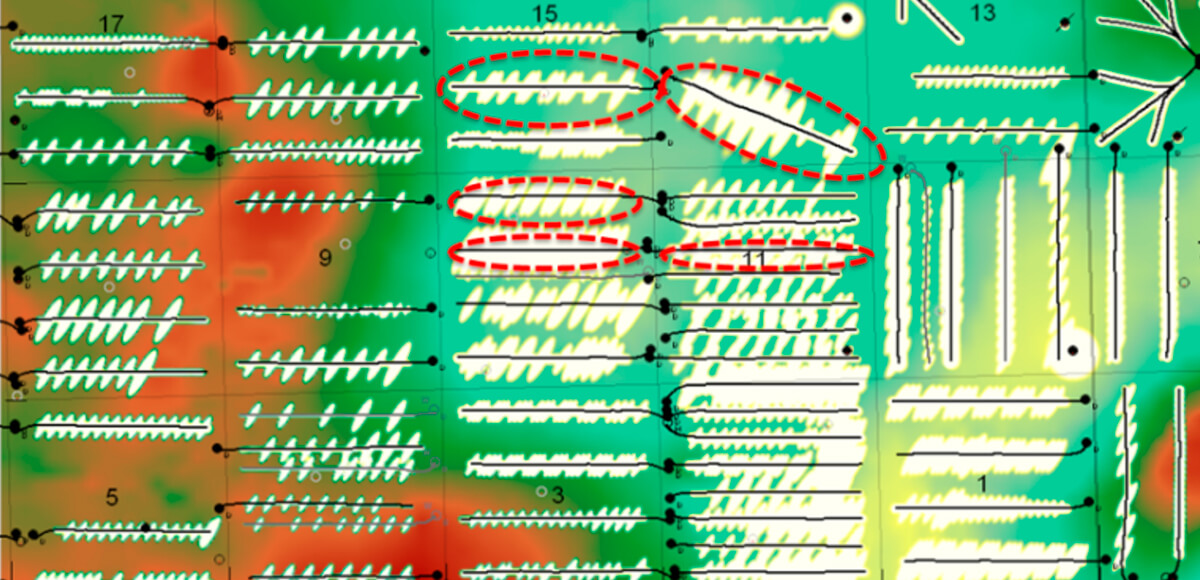
Directionality data from geomechanical studies and microseismic events allow us to calibrate the results. The following image shows a Bakken study map with over 60 wells showing the results of VSM on top of a remaining HCPV map. It shows the complexity of frac sizes, quality variations of the reservoir (High HCPV*h in brown to medium in green to low HCPV*h in yellow). The white areas are the SRVs of individual fracs. The VSM process drains the volumes to match with EURs.
Conclusions
Integration of geological and engineering processes presented can improve well and project economics.
Updating real-time 3D geological context while drilling provides a key advantage for reduced DLS, faster drilling and improved cost savings in drilling operations.
Integrated studies with the presented VSM volumetric simulation helps us to manage risk and fine tune well placement, particularly in older fields with offsetting vertical and horizontal producers. Questions about well density, 3D well position, frac stages, completion designs, EURs and project economics can benefit from the analysis method.
Various KPIs were examined to highlight that small decisions pre/while-drilling on the path matter greatly in regard to longer term profitability of wells and projects.
Technology advantages presented here are the foundational requirements for drilling automation systems, making it easier for operators to drill better wells.


Join the Conversation
Interested in starting, or contributing to a conversation about an article or issue of the RECORDER? Join our CSEG LinkedIn Group.
Share This Article