Assessing the liquid state of bitumen and its production is now possible from 4D seismic. From conventional 4D seismic data, steam chamber volume can be determined. From 3C-4D (3-component, 4-dimensional) PS (P-wave down, converted S-wave up) seismic data, the liquid state of the bitumen, immediately produceable bitumen, and future produceable bitumen can be forecast. This presentation shows how we have done this. During steam assisted gravity drainage (SAGD) processing of an oil sands reservoir, two marked phase changes occur. First, bitumen changes from a quasi-solid state to a produceable liquid state when heated. Changes in the Vp/Vs ratio determined from 3C-4D seismic data in oil sands reservoirs indicate the presence of bitumen heated to its liquid, and therefore mobile and produceable state. Second, a steam chamber develops as the liquid bitumen is displaced with gas and steam during production. Therefore, the size of the steam chamber is used to quantify all these measurements by comparing it to how much bitumen has been produced by the time of the 4D seismic acquisition. From this calibration, and well measurements, it is possible to quantify the other effects. The use of 3C-4D seismic data is critical to assess where the heated bitumen resides in the reservoir because it exists around the steam chamber, and can be detected best by low-frequency changes in the Vp/Vs ratio. The 3C-4D differences allow the visualization of these low-frequency high Vp/Vs ratio zones outside the steam chamber.
The 3C-4D suggest a much broader expanse of mobile oil above and around the steam chamber than might be suggested by Butler (1991) theory. In addition, it appears that a lot of mobile bitumen sits below the producers and therfore will be difficult to produce with a gravity method. This has important implications for the type and placement of infill and extension wells in and around existing SAGD well pairs, as well as for workovers.
Introduction
Zeigler (2013) demonstrated that significant changes in Vp/Vs ratios are associated with the change from quasi-solid bitumen (Han et al, 2007) to its liquid form. When quasi-solid bitumen is heated to its liquid state, its shear modulus, and therefore shear velocity (Vs), go to zero,which is one definition of a liquid. Meanwhile, the bitumen’s P-wave velocity (Vp) gradually decreases as the bitumen warms. The significant drop in Vs, combined with a slight decrease in Vp, cause a large increase (>30%) in the Vp/Vs ratio of the sands containing heated, liquid, and therefore, mobile bitumen. This increase in the Vp/Vs ratio is signficantly larger than the decrease in P-wave impedance commonly used to identify the steam chamber in an oil sands reservoir. Therefore, the Vp/Vs ratio change associated with heated bitumen should be quite prominent and observable in 3C-4D differences, even with the lower resolution of PS data. The Vp/Vs ratio undergoes a substantial increase only during its liquid state and the Vp/Vs ratio is approximately equal to or lower than the Vp/Vs of virgin reservoir when steam replaces the bitumen. Due to the thickness (0-50m) of the steam chambers and the heated bitumen surrounding them in Athabasca oil sands reservoirs, these Vp/Vs anomalies will often be so thick as to be below the period of the conventional P-wave seismic wave. Therefore, conventional seismic can only see their top and base, but not the full chamber (Pro4D Guide, 2007). Time-lapse interpretation of the differences in the depthing velocities, ideally from PSDM (pre-stack depth migration), through the heated zones or differences in the time horizons (Zeigler, 2013) in the 3C seismic monitor survey below the heated zones, identify thick zones of liquid, mobile bitumen on the edges of the steam chambers and around the producing wells. Reversing these observations, large, thick, increases in Vp/Vs ratio imply the presence of substantial volumes of heated, mobile bitumen. Through the use of pre-stack, joint inversion (Hampson et al., 2005) and multiattribute transforms (Hampson et al., 2001), we create volumes of gas, temperature, and saturation, which allow us to evaluate the 3C-4D anomalies by comparing them to well logs from observation wells in and around the steam chamber. The conventional 4D difference can be related to the amount of bitumen that has already been produced (Zhang et al 2017). The 3D differences in Vp/Vs ratios produced by the 3C-4D method allow us to interpret where bitumen has been heated to the point where it is mobile and therefore produceable. This will have a significant impact on our ability to optimally place infill wells and adapting operating strategies for production optimization in the existing SAGD well pairs.
Method
The method for applying a 3C-4D inversion to oil sands data is described in Gray et al (2016). Critically, the inversion of the PS-wave 3C-4D seismic monitor needs a low-frequency adjustment to its background model to account for the signficant drop in S-wave velocities through the mobilized bitumen zone. Due to the thickness of the steam chamber in this Athabasca reservoir, this drop in S-wave velocities is below the period of the P-wave and the PS seismic data. Therefore, the critical step in this process is to determine where low-frequency changes in Vs can be identified. Large decreases in Vs combined with a slight decrease in Vp is where the bulk of the mobile bitumen sits. Ideally low-frequency velocities can be estimated by PS-PSDM velocity analysis on the baseline and monitor PS data. Alternatively, the time shift between the PS baseline and the PS monitor through the reservoir can be used Gray et al (2016). This time shift can then be converted to an adjustment to the low-frequency background model for the joint inversion of the monitor, similar to what is described for adjustment of the P-wave monitor in the Pro4D Guide (2007), except that the velocity is P-wave down and S-wave up. The difficulty with the latter method is determining where in depth the low-frequency velocity anomaly sits. In our example we assumed that it went from the top of the steam chamber to the bottom of the reservoir.
The shear-wave velocities (Vs) start to drop rapidly as soon as the bitumen starts to heat up (Figure 1), which means that this low frequency adjustment must extend beyond the steam chamber because there is heat beyond the steam chamber. Furthermore, our observations indicate that the Vs adjustment is required for some distance away from the steam chamber, e.g. Figure 2 where the mobile bitumen anomaly extends at least 200m away. Therefore, the low-frequency adjustment to the shear-wave velocity should not be estimated from the P-wave (Vp), low-frequency adjustment. The shear-waves are delayed traveling through the liquid bitumen sands relative to the cold, quasi-solid bitumen sands because of the reduction of the shear-wave velocity in the liquid. This creates a time delay that we use to identify how much and where the shear-wave velocity should be modified in the low-frequency Vs model used in the pre-stack inversion of the 4D monitor survey. The background density model is left unchanged because only small changes in density are expected (Figure 1). Once the above low-frequency corrections to the background models for Vp and Vs are made, the 3C-4D monitor is pre-stack, jointly (PP and PS simultaneously) inverted using the same parameters as the baseline.
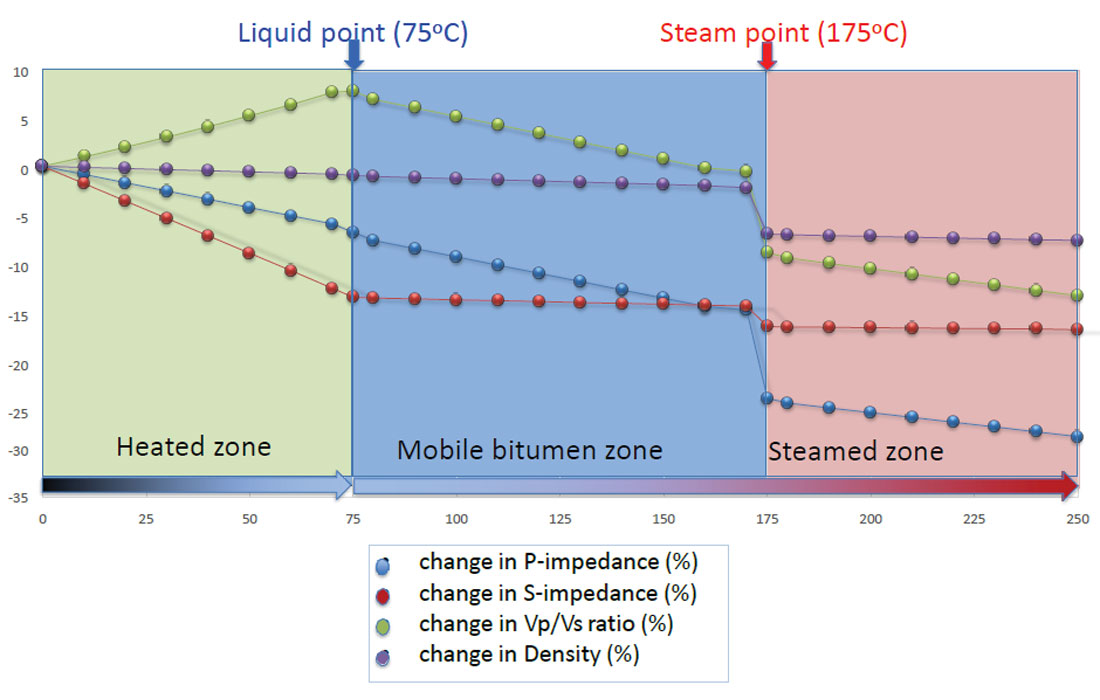
The rapid decrease in the shear-wave velocity causes a rapid increase in the Vp/Vs ratio, but as the bitumen is replaced by steam or gas Vp drops substantially, which causes the Vp/Vs ratio in the steam chamber to drop to values much closer to virgin reservoir Vp/Vs values, or slightly below (Figure 1). Therefore, there should be a zone of high Vp/Vs ratios around the steam chamber that should correspond to heated, liquid, and therefore mobile, bitumen, and a zone of lower Vp/Vs ratios and lower P-impedance associated with the steam chamber. This is what we observe (Figures 2 & 3) and what we use to distiguish the various liquid states (Zhang et al, 2017). The area of mobile bitumen outside of the steam chamber appears to be quite significant (e.g. Figures 2 and 4, and Figure 6.5 in Zeigler, 2013). This anomalous zone of high Vp/ Vs ratios related to mobile bitumen also appears to be at least as thick as the steam chambers (e.g. Figure 2). Therefore, the anomalous zone will often be thicker than the seismic bandwidth covers. Therefore, a means of seeing this low-frequency trend is required. The only way that we are aware of to get this low-frequency trend is to use some form of shear-wave seismic. Ideally this will be done by depth migrating both the PS monitor and baseline. In this example, we accomplished this by interpreting the monitor – baseline 4D time-difference in the shear-wave reflector interpretations above and below the reservoir, similar to the method described in the Pro4D Guide (2007) for conventional 4D. The low-frequency adjustment required for the pre-stack joint inversion done here is estimated using the time delay from our 3C-4D seismic data, as described in Equation 1. As can be seen from the equation, the PS data is critical for this adjustment.

Where:
P is slowness in s/m
T is two-way travel-time in s
The subscripts s, ps and p represent the SS, PS and the PP waves, respectively.
The terms in the brackets (bas and mon) represent the baseline and monitor, respectively.
Examples
The results of the pre-stack inversions are shown in Figures 2-4. Figure 2 is the key result because it shows that substantially higher Vp/Vs ratio values of 2.8-2.9 lie where we would expect them to be associated with heated, mobile bitumen just outside of the steam chambers that have been interpreted from the conventional PP-4D in Figure 3. The Vp/Vs ratios in the interpreted steam chamber are slightly lower than the background Vp/Vs ratios in the baseline (left side of Figure 2). The increase in the Vp/Vs ratios in the interpreted mobile bitumen zones is greater than 30% (2.1-2.2 to 2.8-2.9), as expected from Zeigler’s (2013) theory. Gray et al (2016), Zhang and Larson (2016), Zhang et al (2017), and Todorovic-Marinic et al (2017) establish that the 3C-4D results appear to represent mobile bitumen and heated quasi-solid bitumen as shown in Figure 4.
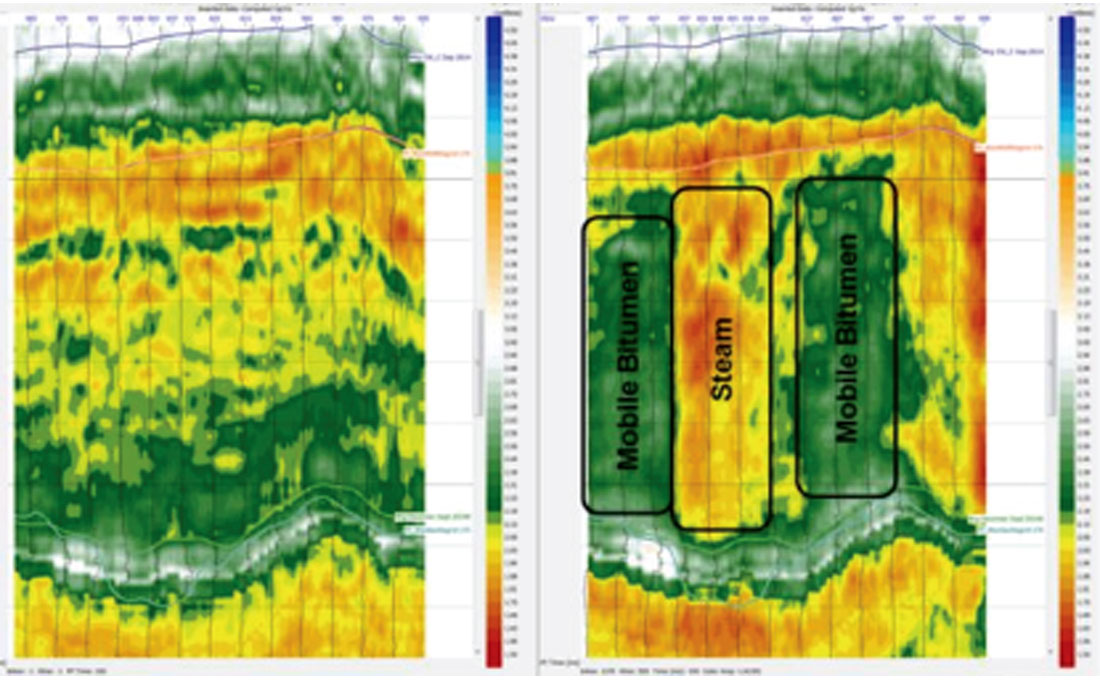
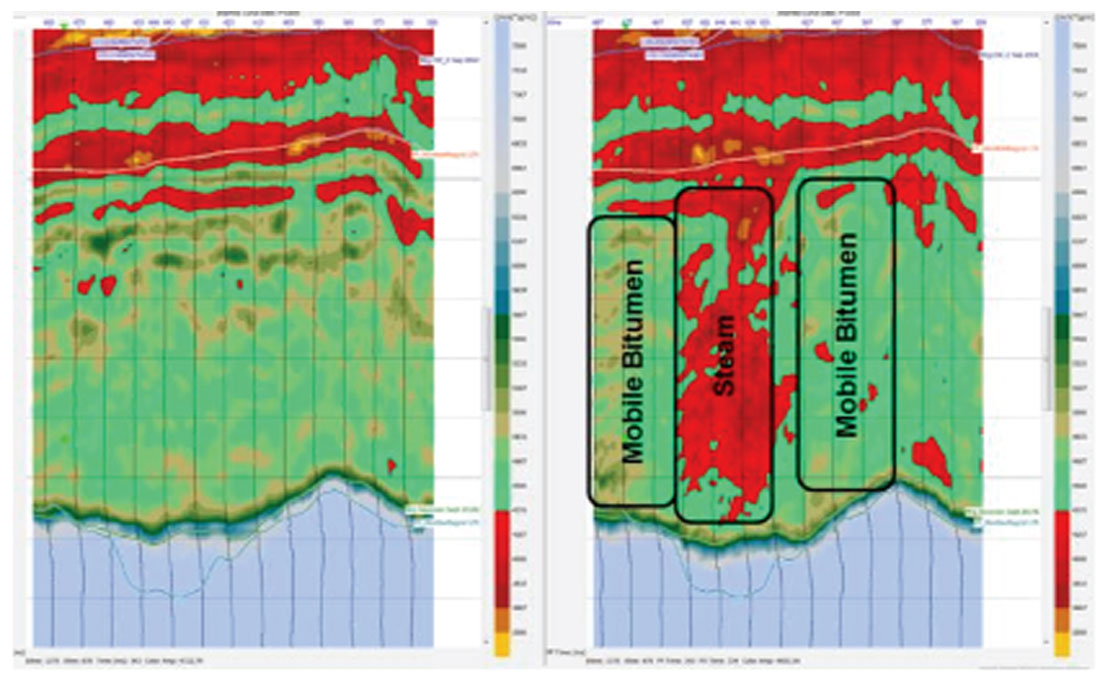
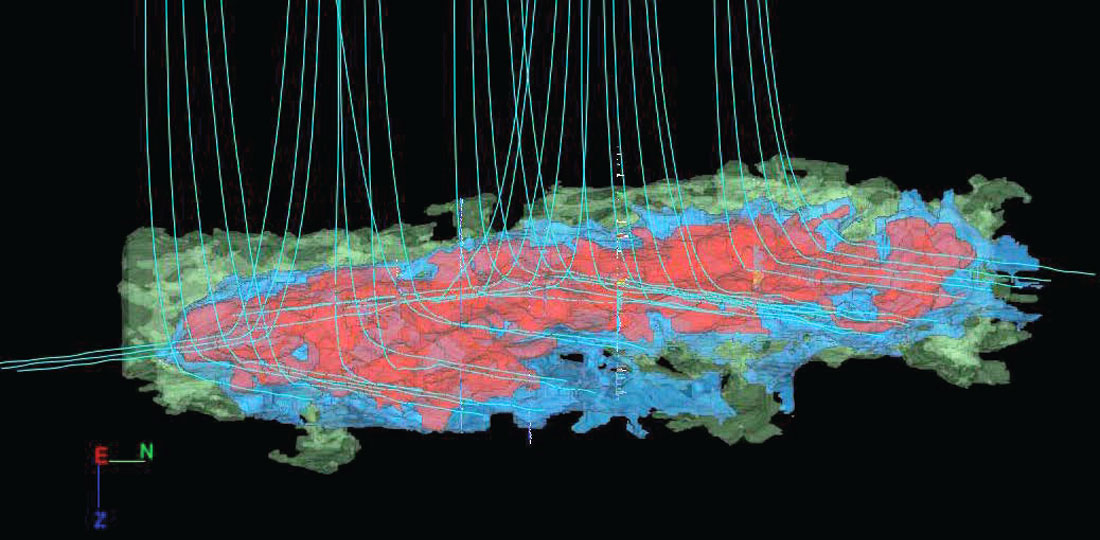
Figure 4 shows the results of the classification methods described in Zhang et al (2017) used to interpret the various states of the liquids in the producing reservoir: the steam chamber (red), mobile bitumen (blue), and heated quasi-solid bitumen (green). The locations of all these fluid states make sense, with the steam chamber on the inside, the heated quasi-solid bitumen on the outside and the mobile bitumen between. Zhang and Larson (2016) show that the size of the steam chamber is related to total production to date. This allows Zhang et al (2017) and Todorovic-Marinic (2017) to quantify the 4D response to production based on the 2014 4D anomaly and production to the date of the 4D acquisition, and it allows them to predict future production by using the 2014 3C-4D anomalies as follows. The mobile bitumen gives an idea of how much oil can be produced immediately, and therefore is useful for planning workovers and infill wells. The heated quasi-solid bitumen gives an idea of how much production is available in the near future, and therefore is useful in planning infill wells. In this presentation we will show that it realistically predicts production in 2016, two years out from the 2014 4D acquisition. The 2014 prediction has a correlation coefficient of 77% and has an error of 14% compared to the actual production. The 2016 prediction has a correlation of 92% and an error of 10% compared to the production through 2016.
Conclusions
Mobile, heated bitumen seems to be indicated by significant increases of 30% or more in the Vp/Vs ratio between baseline and 4D monitor surveys. Vp/Vs changes can be determined from differences in prestack inversion of 3C-4D seismic data. Furthermore, the Vp/Vs anomalies occur where mobile, heated bitumen is expected: below the bottom of, and on the edges of, the steam chamber. The Vp/Vs anomalies on the edge of the steam chamber are larger than expected. The combined 3C-4D anomalies can be used to estimate liquid states of bitumen in the reservoir. In addition, the current-day steam chamber can be correlated to total production and the resulting 3C-4D anomalies have been used to predict future production with good correlation to the actual production. Therefore 3C-4D analysis creates value by assisting in the identification of infill and extension well opportunities and providing guidance for adapting operating strategies for production optimization in the existing SAGD pairs.

Acknowledgements
We thank Nexen Energy ULC and Devon Energy Corp. for the opportunity to work with and permission to publish these data. We wish to thank Alicia Veronesi and Fabien Allo for their contributions to this work. We thank Al Murray, Dominique Holy, Yannick Champollion, and Jacqueline Chernys for valuable feedback provided to this work and for their reviews of this paper. We thank Tobin Marchand, Brian Hargreaves, Don Daub and Rod Cousins for their understanding in the processing of these 3C-4D data.


Join the Conversation
Interested in starting, or contributing to a conversation about an article or issue of the RECORDER? Join our CSEG LinkedIn Group.
Share This Article