Abstract
Landsat images and a digital elevation model covering the central and southern portions of the Masilah Basin in the Republic of Yemen have been used to enhance the mapping of poorly imaged structural features. An absence of recent post-rift sediments within the study area allowed Mesozoic and Cenozoic extensional features to be mapped on the surface from satellite data and then extrapolated to analogous subsurface structures identified on a 2D seismic grid. The structure of the outcropping Umm Er Radhuma Formation was interpreted by picking control points on the base of the widespread Eocene Jeza Formation. The control points were then back-interpolated onto a “digital elevation model” (DEM) constructed from Russian topographic maps. Contouring of the gridded control points generated a structure map of the Umm Er Radhuma Formation. The interpreted structure maps and faults were combined with well and seismic data to develop 2D structural cross-sections and 3D models of the study area. Sixteen leads were identified on the surface maps and three were corroborated by the seismic data. An exact correlation of the surface structure to the top of the zone of interest (Qishn Carbonate Member) proved impossible due to statics problems. The deepest coherent reflector was the Dha Sohis Member of the Harshiyat Formation, which lies approximately 360ms above the Qishn Carbonate Member.
A potential source basin was identified by surface expression adjacent to the mapped structures, bound by reactivated N-S trending late Jurassic aged faults. The majority of structural traps are bound by WNW-ESE Early Cretaceous steeply dipping extensional faults also with surface expression. WSW-ENE Oligocene structures predominate south of the rift shoulder, paralleling the spreading ridge in the Gulf of Aden. Seismic data indicates that the Early Cretaceous structures were reactivated and occasionally inverted during an Oligocene rifting event. Overall, remote sensing based reconnaissance has proved an invaluable tool in a region where difficult surface conditions prevent precise imaging of subsurface features.
Background
The structural geology of the petroleum basins of Yemen predominantly reflects the Mesozoic break-up of Gondwanaland. Interior basins formed during major rifting events in the Late Jurassic and Early Cretaceous. In the Tertiary, the earlier structures were overprinted and new ones were created by extension associated with the opening of the Gulf of Aden (Csato et al., 2001). Drilling for hydrocarbons commenced in 1961 with the first commercial discovery by Hunt Oil in 1984 in the Marib Al Jawf Basin in western Yemen. Activity spread to eastern Yemen with a series of discoveries made by Nexen and Total in the Masilah region through the early 1990’s.
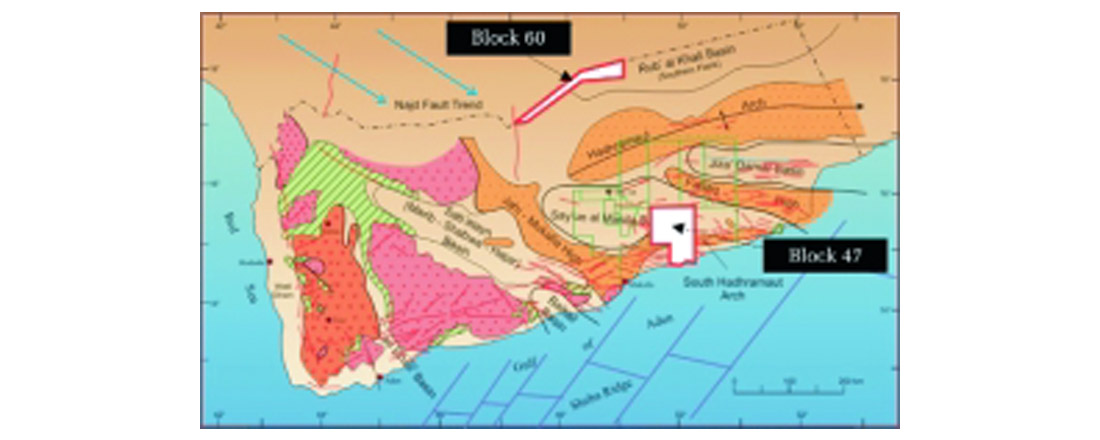
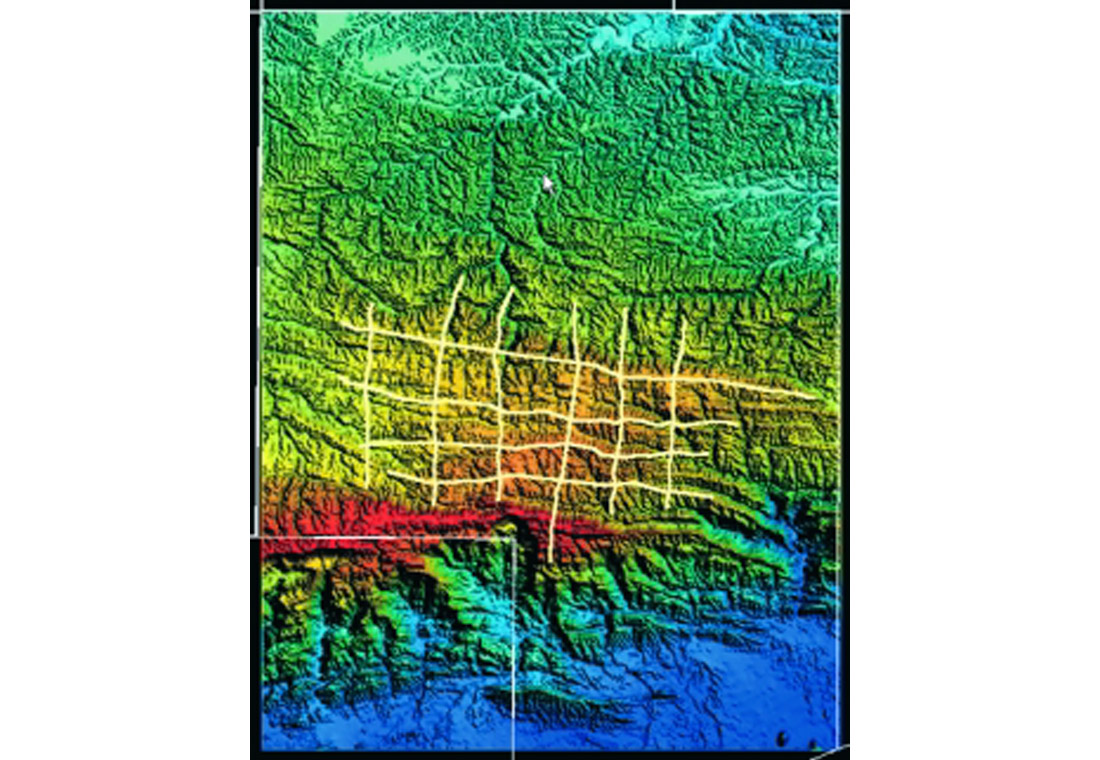
The study area is located in the southeastern portion of the Masilah basin just to the east of Block 14 (Masilah Field) and covers an area of approximately 25 000 km2 (Fig. 1). The Masilah basin is a broadly symmetrical graben oriented NW-SE, roughly parallel to and controlled by the Pre-Cambrian Najd fault trend (Bosence, 1997). The oldest sediments within the basin are early Jurassic in age and are preserved in small intra-basinal lows surrounded by broad Cretaceous platforms. Basin fill is comprised of three major sequences: the Jurassic Amran Group, the Cretaceous Tawilah Group and the Tertiary Hadhramaut Group. The basin is bounded to the north by the Fartaq High and the Hadhramaut Arch, and to the South by the Mukalla High and the South Hadhramaut Arch (Fig. 1). The project was focused on exploration within concession blocks 33, 43, 45 and 47 in the Republic of Yemen. EnCana currently has operatorship and a working interest in Block 47 (52.5%) and Block 60 (39%).
The Mesozoic basins in Yemen formed during two separate rifting events. The first event occurred during the Kimmeridgian-Berriasian and was followed by a period of thermal subsidence and a second rifting event during the Hauterivian-Barremian (Ellis et al. 1996). The basins appeared to open from West to East with the Marib Basin dominated by Late Jurassic and Early Cretaceous fill, followed by the Masilah and Jiza’ Qamar Basins filling progressively with younger sediments. Source and reservoir rocks were deposited as both pre- and syn-rift sediments, forming traps during rifting within horsts and tilted fault blocks.
Production within the Masilah basin is predominantly from early Cretaceous Qishn Formation sands trapped in the hanging wall of rotated fault blocks sealed by tight overlying Qishn Formation limestone. The pools are sourced from Jurassic marine shales in adjacent down-faulted lows, which allowed migration of hydrocarbons into the overlying and adjacent reservoirs. The Qishn Clastic Member at Nexen’s Masilah fields reflects deposition in fluvial to tidal flat environment, producing reservoir sandstone with porosity greater than 20% and permeability in excess of 1 darcy (Putnam, 1997). Qishn Formation sands have produced at rates of up to 12,670 b/d of 29-33 API gravity oil with little dissolved gas (Bosence, 1997).
Structural Mapping using Remote Sensing Data
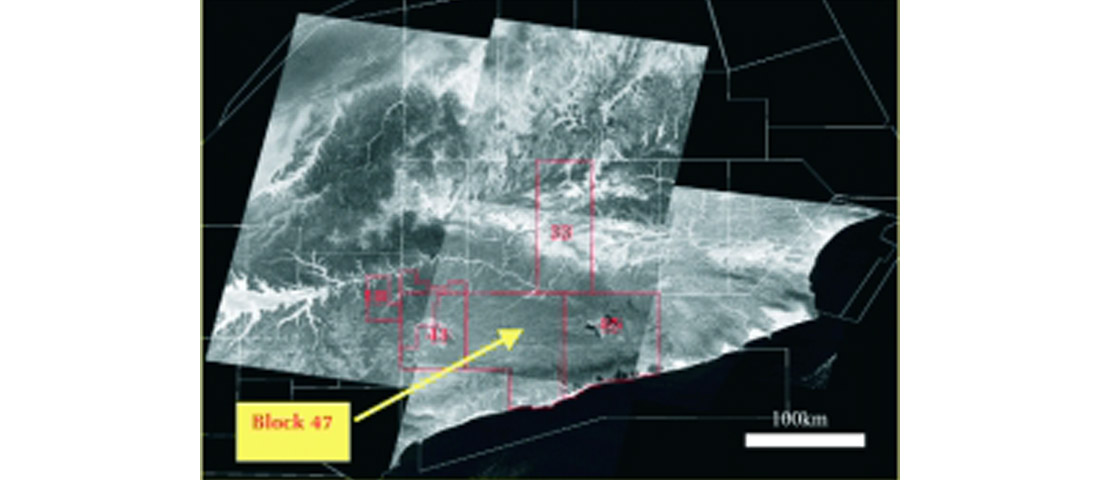
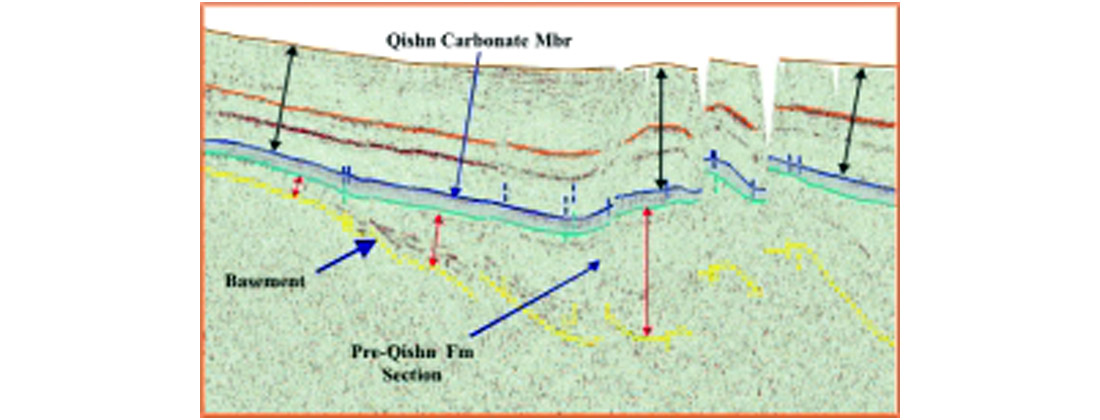
Landsat based mapping is ideal for onshore, arid terranes with no history of glaciation. Many areas in Yemen have sparse seismic coverage and generally poor imaging quality from 2D lines. Structure hinted by seismic mapping can be confirmed with a combination of satellite imagery (Fig. 2) and surface DEM (Fig. 3). This technique provides for rapid reconnaissance of structural features to be followed up by a more detailed seismic program. The Masilah area is ideal as surface structure often mimics the reservoir horizon. Seismic data shows a close correlation between the top of the Qishn Formation and surface structure (Fig. 4). Thickening of the Mesozoic strata occurs prior to the deposition of the Qishn Formation. The Masilah area has sparse surface cover and flat-lying surface strata, which are extensively cut by erosion, allowing mapping of outcropping formations over large areas.
New technologies being introduced to EnCana in this project include spectral mapping, which combines Landsat images with a digital elevation model (DEM) to map surface structure and geology. Spectral mapping requires using the unique combination of spectral reflectance (colour), brightness, and erosional texture associated with lithologic units to define spectral units bounded by recognisable surfaces on a satellite image or photograph. These units have no genetic significance until ground-truthed in the field. The ideal terrain has not suffered glaciation and exists in an arid climate allowing for maximum outcrop exposure. The Arabian Peninsula is one such region and has been mapped extensively using aerial photography and satellite images (Wender & Sabins, 1991). The study area in Yemen has the added advantage of gently dipping surface stratigraphy cut extensively by drainage allowing individual contacts between spectral units to be spatially present over the entire region.
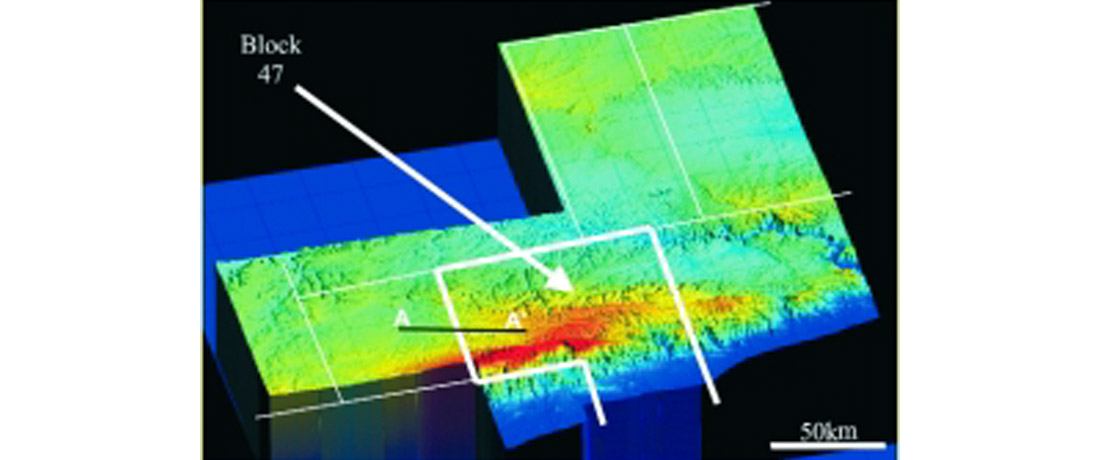
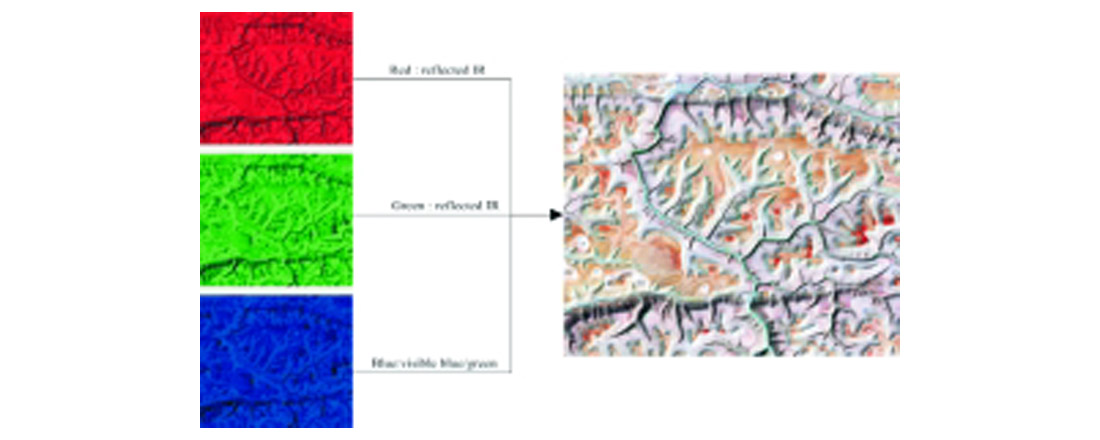
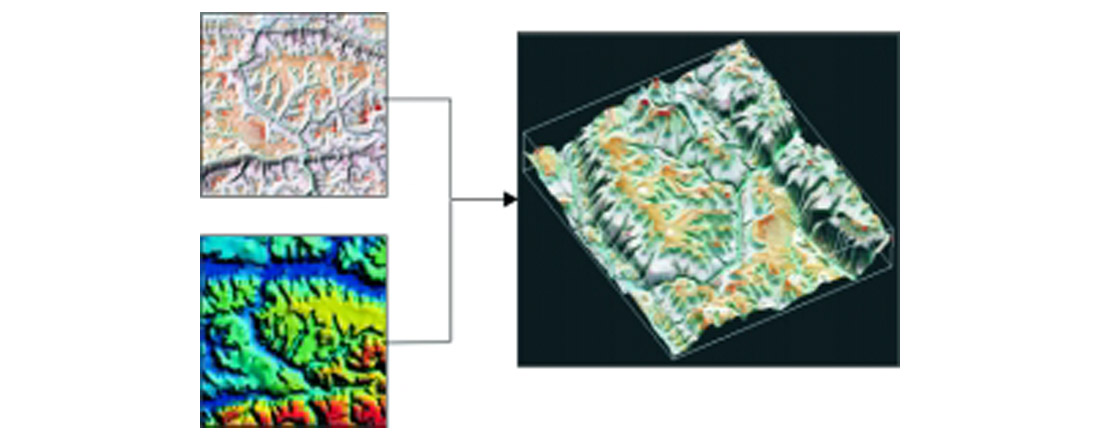
Landsat 7 satellites have 7 spectral bands ranging through the electromagnetic spectrum. Combining bands 7 (reflected infrared (IR)), 4 (reflected IR) and 1 (blue-green) (Sabins, 1991) as a RGB raster in ERMAPPER produces an image which gives the best distinction of outcropping formations in Eastern Yemen (Fig. 4). Geological field studies carried out by EnCana were able to help correlate the spectral units to lithostratigraphic units present throughout the field area. The DEM is an ASCII XYZ data file representing topography in both 100m and 20m postings (Fig. 3). The DEM was produced from Russian satellite stereopairs. The ASCII file was imported to ERMAPPER1 and converted to ‘.ers’ format for use in the creation of a 3D surface model.
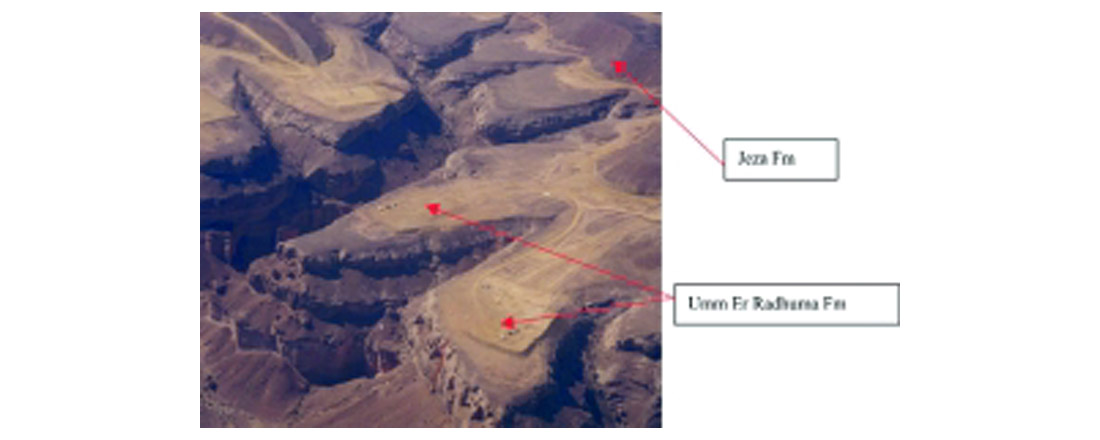
Surface structure and stratigraphy was interpreted from the 3D surface model created by combining the DEM with the satellite images. The satellite RGB raster was draped over an intensity layer created from the DEM. The combined dataset could be displayed in 3D mode (Fig. 6) to establish fault type and throw, and the stratigraphy of outcropping formations. Spectral stratigraphy of the composite Landsat image is matched to surface stratigraphy through the use of air photos and field work. The Eocene Jeza Formation is a cliff-forming unit conformably overlying Umm Er Radhuma shallow-marine carbonates (Fig. 7). The more argillaceous Jeza Formation appears as red/brown on weathered surfaces and the Umm Er Radhuma shows as dark purple (Fig. 5). EW striking normal faults are easily identified by the appearance of younger strata at the base of faults scarps. The Umm Er Radhuma carbonates were resistant to weathering and flat-lying and thus could be mapped consistently over the entire study area.
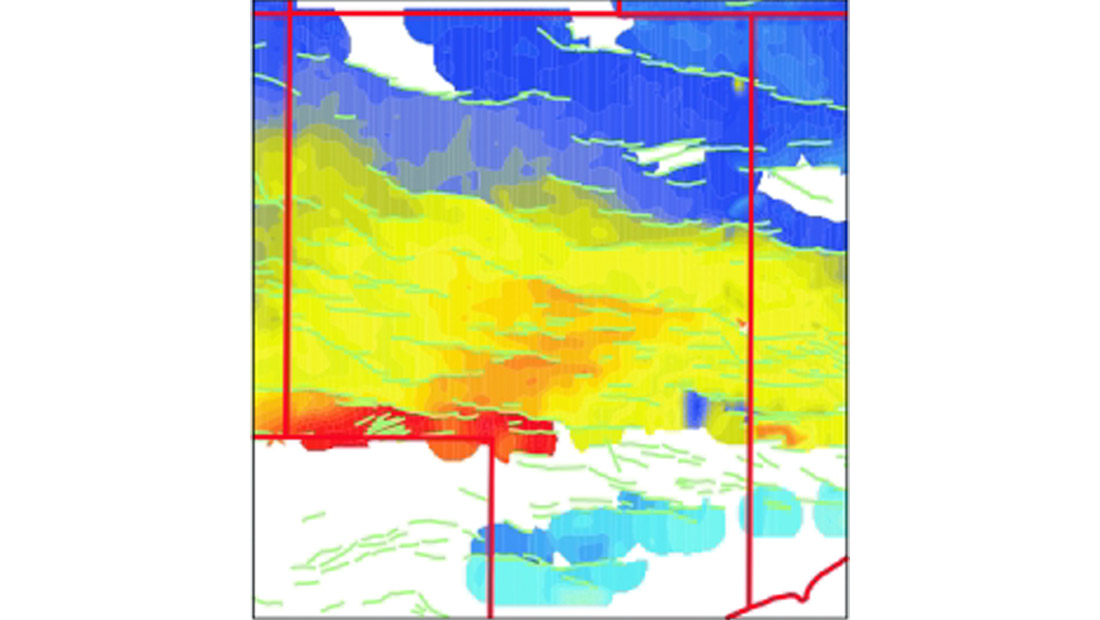
Structure maps of the top of the outcropping Umm Er Radhuma Formation (Fig. 8) and the Russ Formation were constructed as part of a structural model for the study area. The purpose of these maps was to predict subsurface structures, to identify structural features for lead delineation, and to rapidly focus the seismic program within Block 47. The structural data was also used as an input for cross-section construction and 3D modelling. Points were selected on the Landsat raster image which represent the top contact of the Umm Er Radhuma Formation. This formation was chosen for its widespread and cliff-forming nature, allowing for the use of topography as a quality control. The number of points picked depends on the complexity of the structure and the exposure of the contact. Surface faults are mapped as vectors and used to create a more realistic structure map. The digital elevation model (DEM) was overlayed onto the points as topographic contours to ensure that points lie along slope breaks at the base of the cliff forming unit. The DEM grid was back-interpolated onto the pointset data to assign a Z value to each XY point. The resultant XYZ data file represents the structure of the top of the selected formation. The resultant data file was gridded using the horizontal resolution of the Landsat data as a grid increment. Contouring this grid file provided a structural contour map of the outcropping formation.
Seismic Acquisition & Processing
A 400 km 2D seismic grid was acquired over the central area of Block 47 (Fig.9). The primary purpose of the seismic data was to verify that the surface model of the top of the Umm Er Radhuma Formation was correlating to deeper geological horizons, particularly the Qishn Carbonate Member.
The surface terrain over which seismic was acquired was extremely arduous with seismic lines positioned over wadis and faults creating drastic elevation changes along lines. The wadis range from 30m to 180m in depth and 100m to 300m in width. Due to the terrain, a 2D heliportable dynamite program utilising four and eight shot hole patterns with a nominal fold of 100 was carried out. In addition to the rough terrain, very high near surface velocities combined with fractured and karsted surface lithology prevented significant penetration of seismic energy and caused difficulty with the long-wave statics solution. As expected, the recorded data was low frequency and burdened with low signal to noise ratio with significant back scattered and ground roll noise. Despite these initial concerns, several geologically pertinent horizons were imaged well enough for a confident interpretation.
Test lines previously acquired near the area of interest were evaluated to determine the optimal processing flow. Selections of deconvolution parameters, noise attenuation algorithms, longwave statics solution methods and migration processes were all tested.
Results
Groundtruthing the structural interpretation was accomplished with both field data and a 2D seismic grid. It was important to establish the accuracy of the surface maps and whether the original assumption of consistency between surface structure and top Qishn Carbonate structure was valid. In August 2001, an EnCana field party took 54 GPS measurements at the top of the Umm Er Radhuma contact within the central portion of Block 47 (Gavrilescu, 2001). Measurements were taken to test closures over large fault-bound structures identified from the top Umm Er Radhuma contour map. An average error of 19.8m was calculated when the GPS measurements were compared to the interpreted top of the Umm Er Radhuma Formation. Comparing field data versus satellite derived data shows that the error is consistent and the interpretation can be corrected by bulk shifting the interpreted structure up 20m.
Interpretation of the 2D data, still in the preliminary phase, revealed a significant departure from the original model that had the structure at the Qishn horizon essentially mirroring that of the outcropping Umm Er Radhuma Formation. The deepest horizon that could be reliably interpreted was the Dha Sohis Member of the Harshiyat Formation, which lies approximately 360ms above the Qishn Carbonate Member. The structure of the Dha Sohis horizon is seen to generally match that of the surface. The seismic data also indicated significant thinning of the Upper Cretaceous Mukalla Formation onto the high underlying the central portion of Block 47. Leads mapped on the surface were to some extent offset from prospects mapped from the Dha Sohis horizon. Faults detected by surface mapping correlated well with those on the 2D lines and could also be used to infer faults on the lines where imaging was extremely poor.
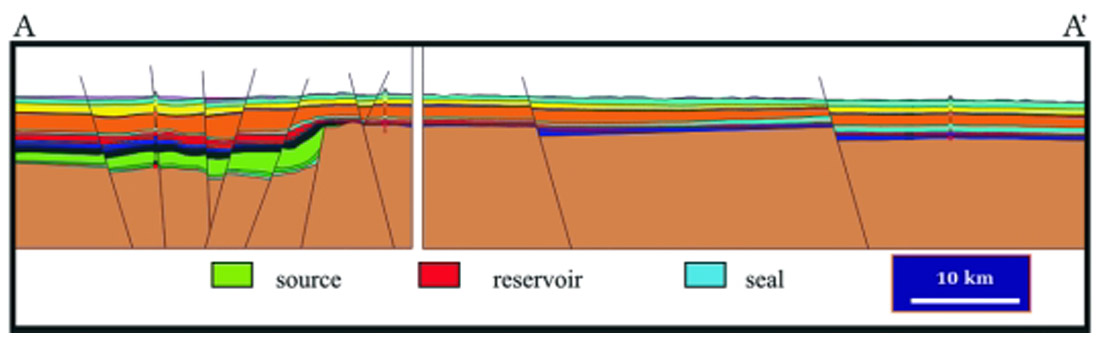
Several cross-sections were constructed as part of a structural model of the study area (Fig. 10). The sections were created to visualise and predict subsurface structure in order to identify risks associated with reservoir, seal, and trap for leads identified in the study area. The position and orientation of each section was based on the location of the leads, wells and seismic lines. The sections were constructed in GEOSEC2D2 by projecting interpreted horizons from 2D seismic with well data, topography and the structure of surface formations into the line of section. The sections illustrate the orientation and displacement of the major fault bounded structures as well as the timing of episodes of extension and inversion throughout the Mesozoic and Cenozoic. Three extensional events were identified constraining the deposition of source rocks, the formation of trapping structures and the risk of seal breach due to late inversion. Cretaceous and Oligocene faults mapped from the satellite data closely matched subsurface faults mapped from 2D seismic but Jurassic faults bounding source grabens were not consistently expressed as surface features. Many of the structural highs identified from surface mapping were subsequently recognised as inversion structures with important implications for reservoir deposition and seal integrity.

Acknowledgements
The authors wish to thank EnCana Corporation for permission to publish this paper. We would additionally like to thank Jeff Chisholm of Niko Resources, Roger Fife, J.C. Chameroy, Jackie Howard, and Robert Gardner of EnCana Corp. for their substantial contributions.


Join the Conversation
Interested in starting, or contributing to a conversation about an article or issue of the RECORDER? Join our CSEG LinkedIn Group.
Share This Article