Introduction
A test survey was recently conducted to compare the relative performance of three types of seismographs. The equipment used was a DFS/v (Texas Instruments), an I/O System Two (Input/Output, Inc.), and a Bison 24000 (Bison Instruments, Inc.).
The DFS/v features 16 bit analog to digital ( A/D) conversion. This instrument has been the standard over the years for 120 to 240 channel 2D recording. The I/O System Two has 24 bit AID conversion. It is a distributed system with large channel capacity used for recording 3D and larger 2D surveys. The Bison 24000 is a new and inexpensive 24 bit seismograph configured for 120 to 240 channel 2D recording.
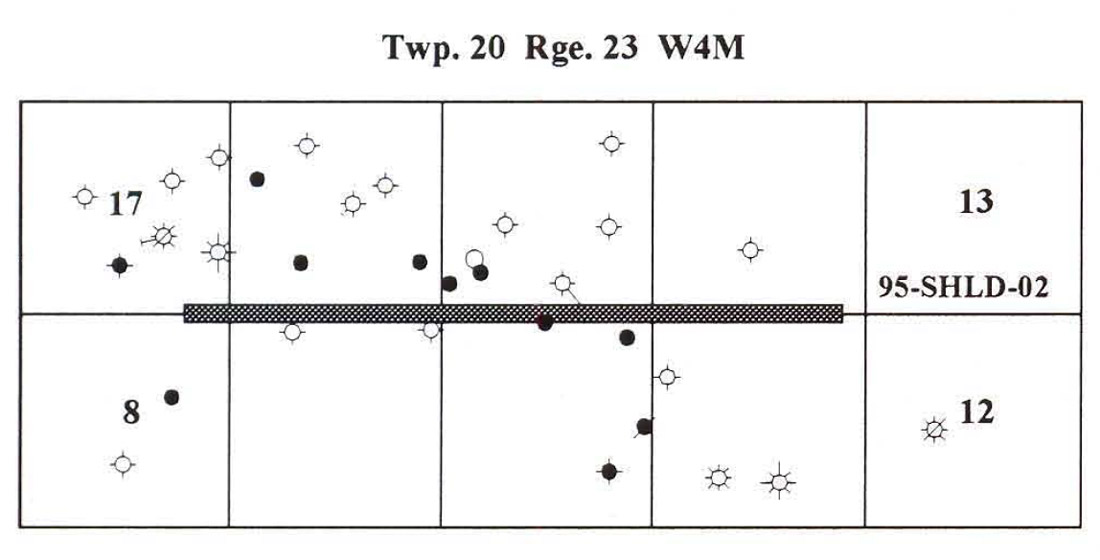
The test survey is located at the Shouldice field in southern Alberta (T20 R23 W4M), as shown in Figure 1. The test line is five kilometres in length and crosses an oil producing Glauconite channel. The channel fairway is about 800 metres wide and occurs at a depth of about 1600 metres. Production is from point bar sediments within the channel complex that can be up to 35 metres in thickness at this location.
The identification of the channel fairway, the location of the point bars and their thickness, and the occurrence of silt plugs are the main mapping objectives by which seismograph performance was to be compared for the test survey. The degree to which each of these features can be resolved is primarily a function of the frequency bandwidth and the signal to noise content of seismic data. These characteristics are primarily related to system dynamic range, since source and receiver differences were minimized for this study. Dynamic range depends upon the fidelity of the AID conversion.
System Configuration and Survey Parameters
The test survey was conducted to approximate data recording in production mode. Each system recorded 120 channel data. The sample rate for the DFS/v recording was 2.0 milliseconds. The sample rates for the I/O and the Bison were selected to be 1.0 and 0.5 milliseconds, respectively. The difference in sample rates was not intended to bias any of the results, but rather to configure each of the instruments in a fashion in which they would reasonably be used for other similar projects. A sample rate finer than 2.0 milliseconds is essential for extension of frequency bandwidth beyond 128 hertz. It was not an expectation that significant frequencies beyond 128 hertz would be recovered during data recording, but rather that a finer sample rate may provide greater stability during data deconvolution and that it may provide a more detailed picture of static corrections.
The survey parameters are summarized in Table 1. Near surface soils at the site were gravelly. A source pattern consisting of three drill holes up to three metres apart was adopted for the survey. The attainable depths of source drill holes varied in the range of 2 to 10 metres. Each drill hole was loaded with a 0.5 kilogram charge.

Separate cables were laid for each recording system. The cables for the I/O and Bison recording systems were located within 5 meters of each other to the north side of the road allowance. Shot holes followed the Bison cable. The DFS/v cable was located about 10 metres away along the south side of the road allowance. Receiver groups were linear arrays of nine ( 14 hertz) geophones placed at about a three metre geophone separation.
Data was recorded simultaneously with each seismograph. Source detonation was initiated by the I/O observer. The time break at the DFS/v was provided by radio link in slave mode. The time break for the Bison was provided by a wire connection to the DFS/V. The Bison had a constant 24.4 ms time break delay as a result of this connection design. Weather conditions at the time of the survey were windy and cold. Shooting required about four hours for completion.
Data Quality
The different locations for cable layouts were not expected to produce any appreciable difference in the data sets recorded by the three seismographs. The major variables effecting data quality were the effectiveness of the source, which was the same for each instrument, and the characteristics of the recording instrumentation.
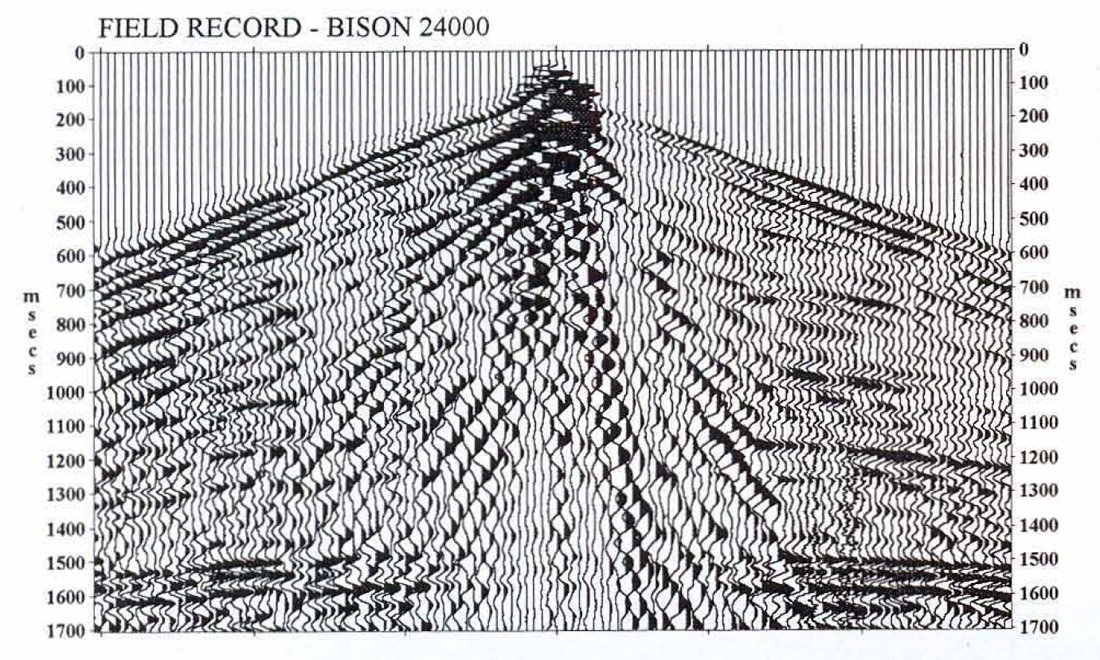
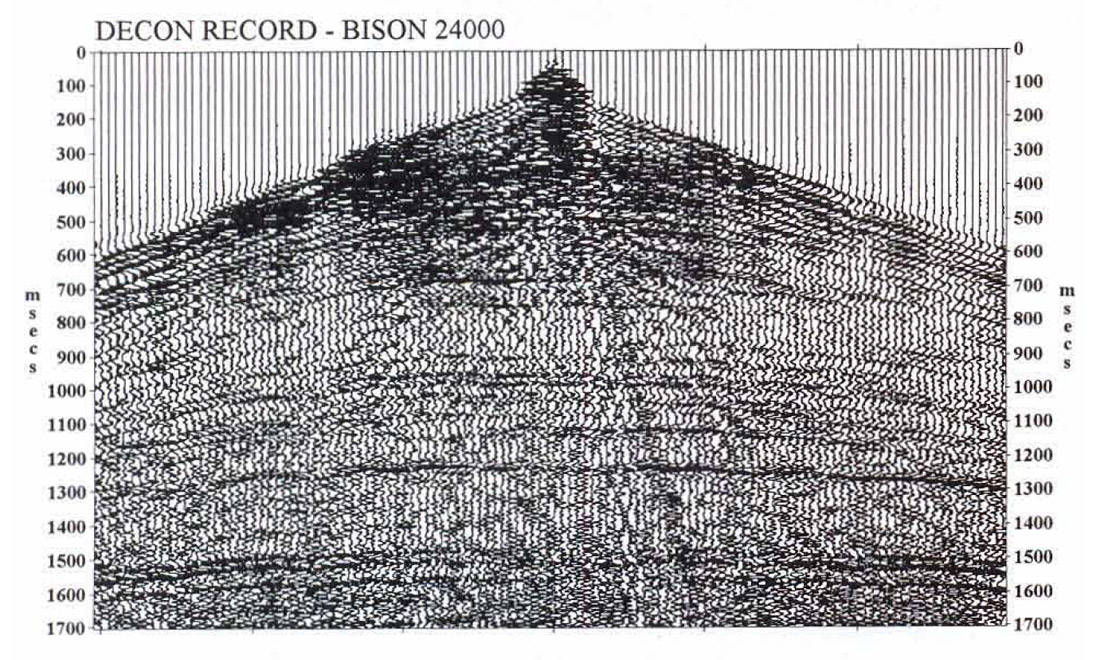
Figure 2 shows a typical raw field record and the corresponding deconvolved record obtained with the Bison 24000. The target zone lies between 1.0 and 1.2 seconds. Field records from all seismographs are similar in appearance and are seen to be dominated by strong refraction and ground roll energy. The appearance of strong coherent noise trains is a characteristic of the source type and the poor data recovery nature of the site. Surface consistent deconvolution followed by spectral whitening was applied to the field data to reduce the effects of coherent noise. The deconvolved records from each seismograph are relatively similar in appearance. The deconvolved records for the I/O and Bison instruments, however, show subtle improvements as compared to the DFSN data in terms of frequency content and continuity of events.
Amplitude versus frequency spectra were derived from field records for each seismograph corresponding to the record shown in Figure 2. The spectra are shown in Figure 3. The window used to derive the amplitude spectra includes all data beyond the initial refraction. The high amplitudes observed at low frequency are attributable to the inclusion of ground roll in the spectral window. The spectra show only the data amplitudes and do not quantify signal to noise ratio in any way. Figure 3 indicates that the largest difference in the spectra for each of the records is the higher amplitude observed at higher frequencies for the two 24 bit recording systems.

Processing Sequence
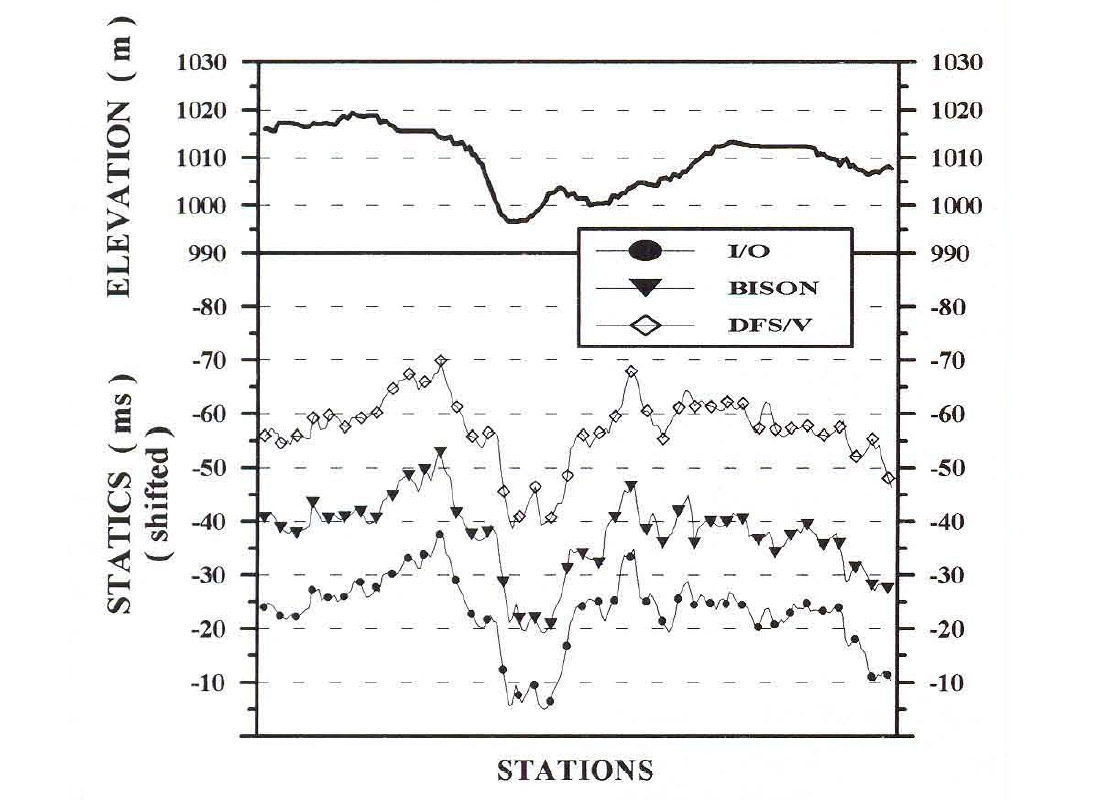
The different sample intervals allowed separate static corrections to be determined for each data set. Figure 4 displays the surface elevations along the seismic line with the total static corrections determined from each of the data sets. The statics have been shifted in time to allow comparison. The statics for all three data sets exhibit much the same shape. It is noteworthy that the statics for both the I/O and Bison have more detail than the DFSN. This is most likely due to the finer sample rates utilized with the 24 bit systems. More study is necessary to determine which static solution is better.
The processing sequence applied to each data set is quite standard for the industry and is outlined in Table 2. The only differences in processing of each data set arise from the fact that different time sample intervals were involved. Refraction statics for the Bison data were calculated at 0.5 ms while all of the processing steps were applied to the Bison data resampled to 1.0 ms. The I/O and DFSN data were processed at sample rates of 1.0 and 2.0 milliseconds, respectively.
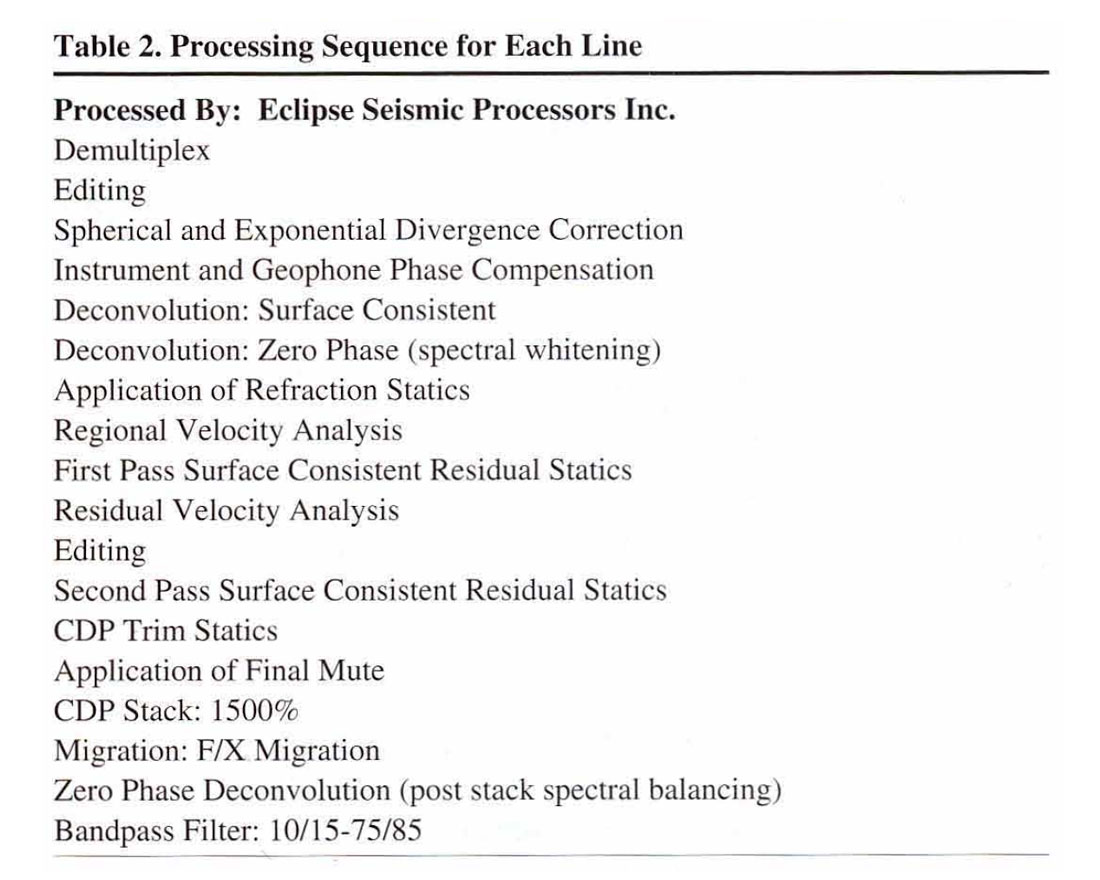
A post stack spectral whitening was applied to the data to improve the frequency content at the zone of interest. The frequency content was improved when the spectral whitening was applied after, rather than before migration, for the three data sets.
Final Seismic Displays
The final migrated stacks for each data set are relatively similar at first glance. The glauconite channel anomaly is clearly visible on all three. It is necessary to look at the data sets in detail to determine the differences.
Post stack processing in the form of FIX migration followed by zero phase deconvolution (spectral whitening) were used to see how each data set would respond to a final boost of the frequency bandwidth. The greatest improvements were noticed for both 24 bit data sets. Figure 5 shows a portion of the boosted data stack from the Bison data set over the channel anomaly. The narrow band filter panels give an indication that signal to noise ratio is good over the entire frequency bandwidth. The filter panels for the I/O system show similar good results. The DFS/v data set did not respond as well to post stack processing as did the other two data sets.

Spectral displays of amplitude were prepared to illustrate differences in frequency content once the signal to noise content of the data within the bandwidth had been established. Three windows across the location of the channel anomaly were chosen corresponding to two way travel times of 0.1 to 0.7 seconds, 0.7 to 1.3 seconds, and 1.3 to 1.8 seconds. The amplitude spectra shown are simply the normalized sum of the frequency components derived from that portion of each trace in each window.
Figure 6 gives the relative amplitude spectra for each data set over the early time window. The figure indicates that the I/O and Bison data sets exhibit relatively higher amplitudes and are less spikey then the DFS/v data set. This is in confirmation of the results from the visual comparison of the data stacks.
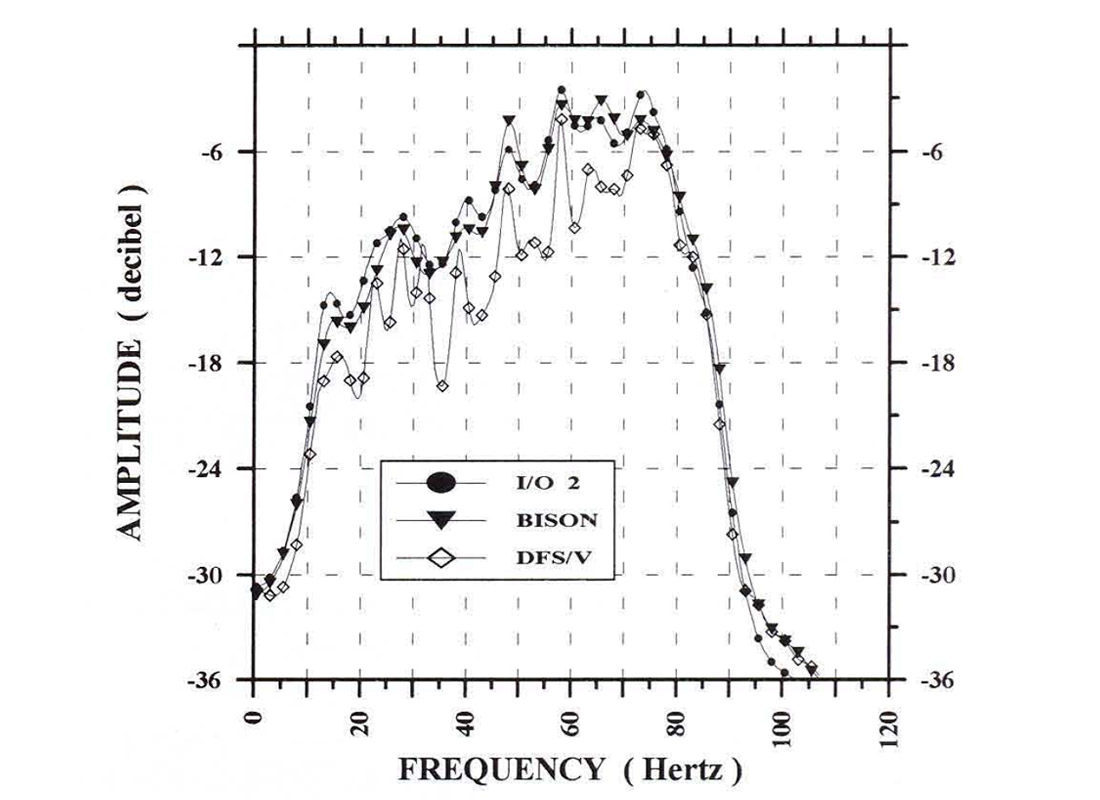
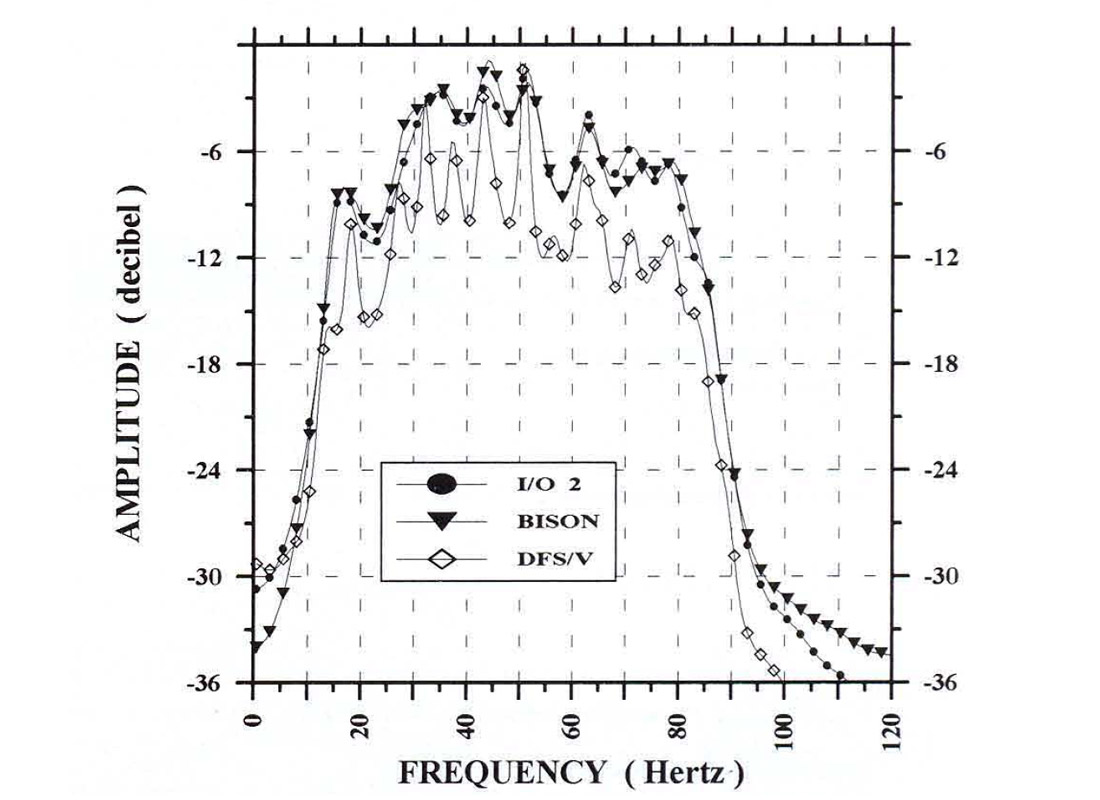
Figure 7 shows the relative amplitude spectra over the intermediate time window which includes the geologic target. The figure again confirms that the 24 bit data sets exhibit relatively higher amplitude and are less spikey. The DFS/v data fails to respond at the high end frequencies.
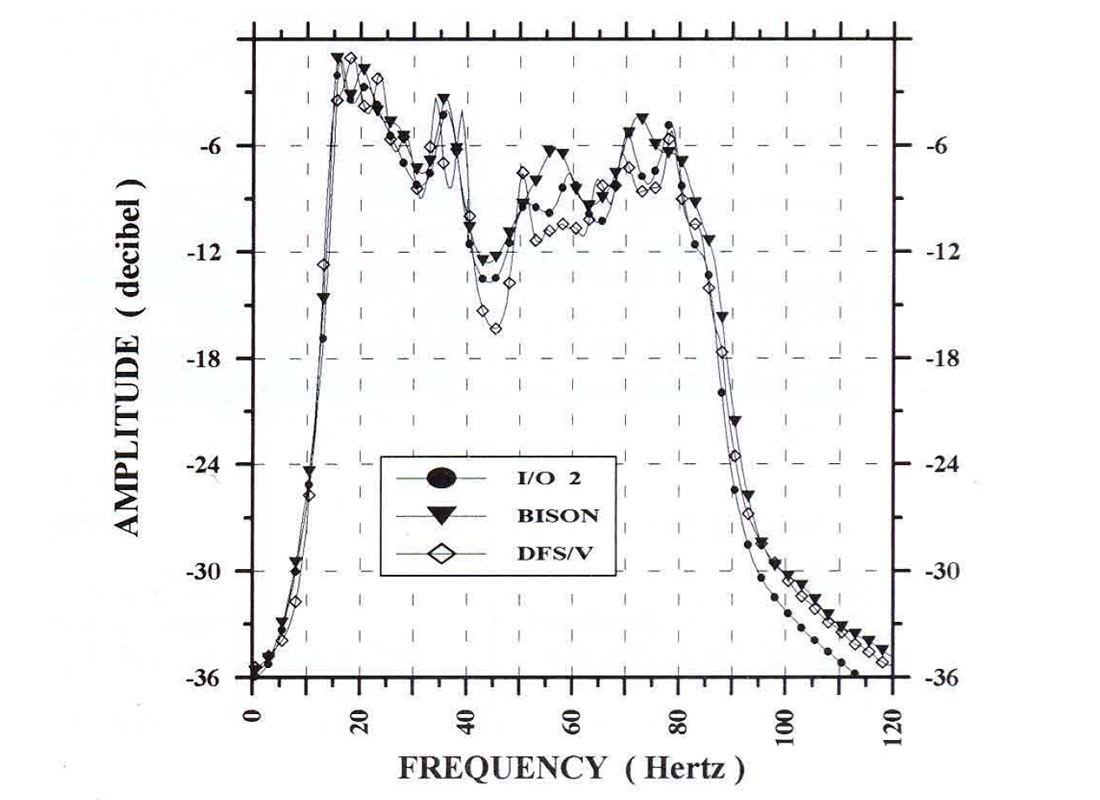
The amplitude spectra for each data set at large two way reflection time is shown in Figure 8. All three data sets show a similar response. This suggests that the advantage of 24 bit as compared to 16 bit recording can be expected to be reduced with larger travel times.
The ability to seismically resolve the geologic objective with confidence is the main criteria for determining the best processed data quality. This can be referred to as "anomaly detection". Detecting subtle variations in seismic character may mean the difference between a producer and a dry hole for many play types.
A portion of the final migrated stacks over the eastern edge of the channel anomaly are reproduced in Figure 9. A simple geological interpretation based on this data is also shown. Three data windows within the channel anomaly on each line have been highlighted for comparison and ranked based on the confidence of the interpretation.

It is fair to say that the two 24 bit instruments produce a more focused, continuous and higher frequency picture of the channel anomaly as compared to the 16 bit data. Both 24 bit data sets better define the subtle structural drapes and sags associated with differential compaction, downcutting along the channel margins, the delineation of the reservoir, the transition into fill material or silt plugs and other characteristics that are essential to the full understanding of local geologic conditions important to the exploitation of the channel reservoir.
Summary
The following points are presented in summary of this article.
The data area is characterized by poor to moderate seismic data recovery. The gravelly nature of the near surface required that a shot pattern be used. Field records show strong refractions and ground roll wave trains as a result. Reflected events on field monitors exhibit low frequency and low lateral continuity to beyond the target time of interest.
The main experimental variable was the number of AID bits available with each recording system. Data acquired with 24 bit ND systems contained more usable high frequency components.
A different time sample rate was used with each seismograph. The sample rates were chosen to conform to the practical rates that would be used with each system for comparable surveys. Differences in time sample interval mainly affect the results in that a separate static correction was determined for each data set. The recovered frequency bandwidth did not extend beyond the antialias filter used for the instrument with coarsest time sample rate.
Data processing yielded sections with subtle yet perceptible differences. A post stack boost to increase frequency bandwidth at good signal to noise levels was more successful when applied to the 24 bit data sets.
The channel anomaly required data with an extended frequency bandwidth to be properly detected. The 24 bit data definitely yield results upon which a more confident interpretation can be based.
It is concluded that 24 bit recording can be used to good advantage in areas of poor to moderate data recovery. No definite conclusion is given regarding the comparison of the I/O and Bison data sets as data analysis has not been taken to this degree. Other than the fact that each of these instruments has 24 bit AID capability, their use as exploration tools are presently substantially different. The I/O System Two is a distributed system that is primarily used for surveys requiring large channel capacity. The Bison 24000 is presently configured for 120 to 240 channel 2D surveys and should be seriously considered to replace the present 16 bit standard based on these results.
Notes
This article expresses the results based on a single field test. Results from similar field testing at another site may be different. No warranty regarding the performance of the instruments tested is expressed or implied by the authors. Companies and universities interested in acquiring this data set for further study or as a field template line should contact a local seismic broker for particulars.

Acknowledgements
The field crew and equipment were made available by Trace Explorations Ltd., Calgary, Alberta. Data processing and display were provided by Eclipse Seismic Processors Inc., Calgary, Alberta. The authors wish to thank these companies for their generous support with this project.


Join the Conversation
Interested in starting, or contributing to a conversation about an article or issue of the RECORDER? Join our CSEG LinkedIn Group.
Share This Article