Shallow and deep groundwater can be a major environmental obstacle for any geophysical surveying technique, especially radio waves. Ground penetrating radar (GPR) is a mature technology with applications in many areas; see Daniels (2004) for an overview. Almost all applications are restricted to imaging the subsurface to a rather shallow depth: large losses of signal occur when propagating through materials with free ions. These conductive losses are determined by the soil conductivity. However, in environments where these losses are low, the depth penetration of GPR increases dramatically, allowing imaging up to depths of several kilometres, for example, through the polar ice on Mars (Jordan et al., 2009; and Orosei et al., 2018) and Antarctica (Berthelier et al., 2005).
To extend the depth range of conventional GPR surveys, a radar-based imaging technology has been developed that measures atomic dielectric resonance (ADR) in the subsurface. ADR technology measures subsurface (i) dielectric permittivity; (ii) spectral (energy, frequency and phase); and (iii) material resonance, from ground level without physically boring the ground. ADR is a patented investigative technique (Stove, 2005) which involves the measurement and interpretation of resonant energy responses of natural or synthetic materials to the interaction of pulsed electromagnetic radio waves from materials which permit the applied energy to pass through the material. The technology can be trained on known geology to build up a reference database, which is then used to classify data collected at new locations.
ADR measurements can be presented in outputs resembling: (i) stratigraphy (like seismic imagery); (ii) information on rock characteristics (like well logs); and (iii) rock petrography (like cores).
Fundamentals of ADR Technology
ADR technology is based on the principle that different materials reflect and absorb electromagnetic radiation (radio waves) at specific frequencies and energy levels. The ADR geophysical system transmits a pulse of electromagnetic energy containing a multispectral wave packet that resonates and interacts with the subsurface materials. The reflections from the subsurface are recorded as a time-domain trace and provide information about the location and composition of the materials encountered (Stove and van den Doel, 2015).
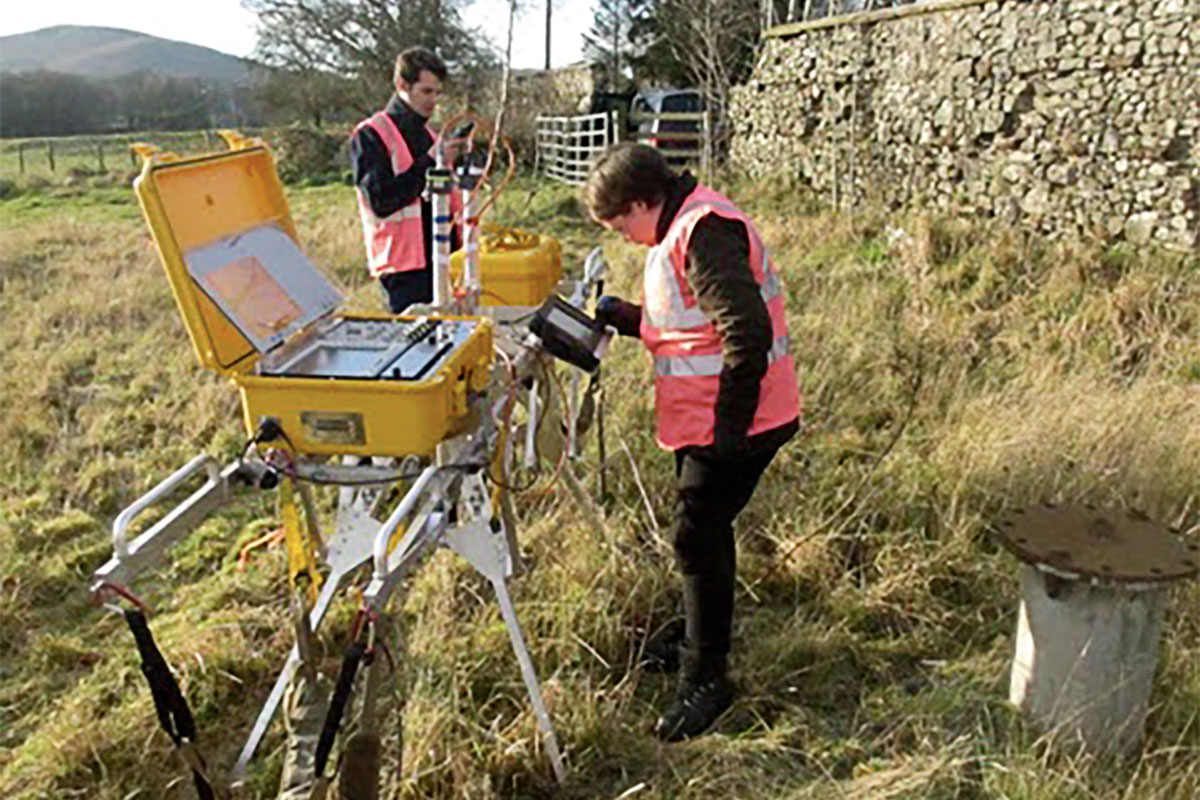
ADR technology finds applications in a variety of different fields, including mineral, oil, and gas exploration, as well as water discovery and geotechnical purposes. The field survey equipment (Figure 1) consists of one transmitting antenna and one receiving antenna, the antennas gimbal platform, the receiver control unit, the transmitter control unit, and the data acquisition computer. Data acquisition is relatively quick as the ADR Scanner and equipment are small and mobile.
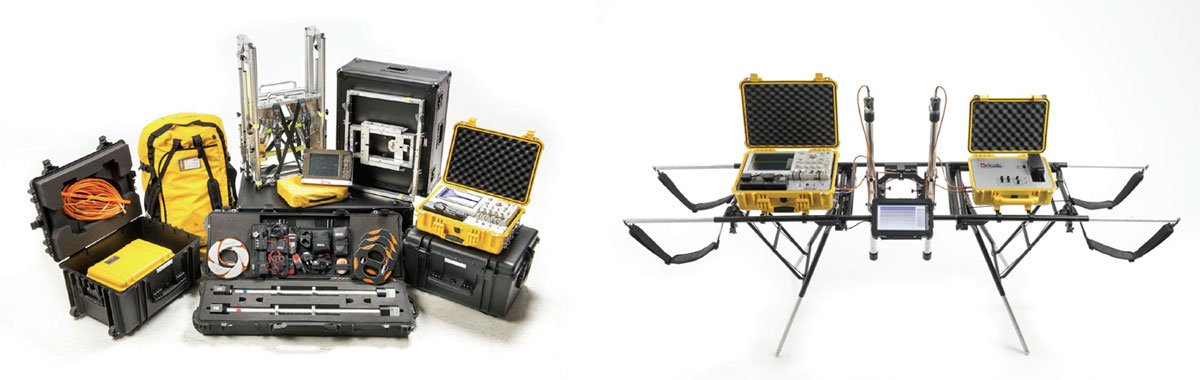
The ADR signal generator produces a broadband pulse that is fed to the transmitting antenna. The transmitting antenna conditions the signal into the desired wave packet using dielectric lenses and mirrors so that the transmitter and receiver appear to have much longer chambers than their actual physical size (Stove et al., 2012). Once the signal has been sent to the transmitting antenna, a signal is sent to the receiving control unit to synchronise collection of the subsurface reflection data which is detected by the receiving antenna from different subsurface rock layers and mineral structures. The receiving control unit collects the signal from the receiving antenna and converts it into a form that can be read and stored on the data logging computer (Stove and van den Doel, 2015).
There are three different types of scans that are typically performed in the field: (i) Profile Scan (P-Scan); (ii) Wide Angle Reflection and Refraction scan (WARR); and (iii) Stare scan (Stare).
For P-Scans, the two antennas are moved parallel to one another along the full scan line length. P-Scans are profile scans of the subsurface collected by the ADR system from ground level. This scan produces a two-dimensional cross-section image of the subsurface that offers opportunity for structural and stratigraphic mapping.
For WARR scans, the receiver antenna is left permanently attached to a tripod platform, while the transmitting antenna is moved away from the stationary receiver along a full scan line length. WARRs are used for triangulating depths using techniques such as normal moveout and velocity spectrum analysis, similar to those employed in seismic data analysis.
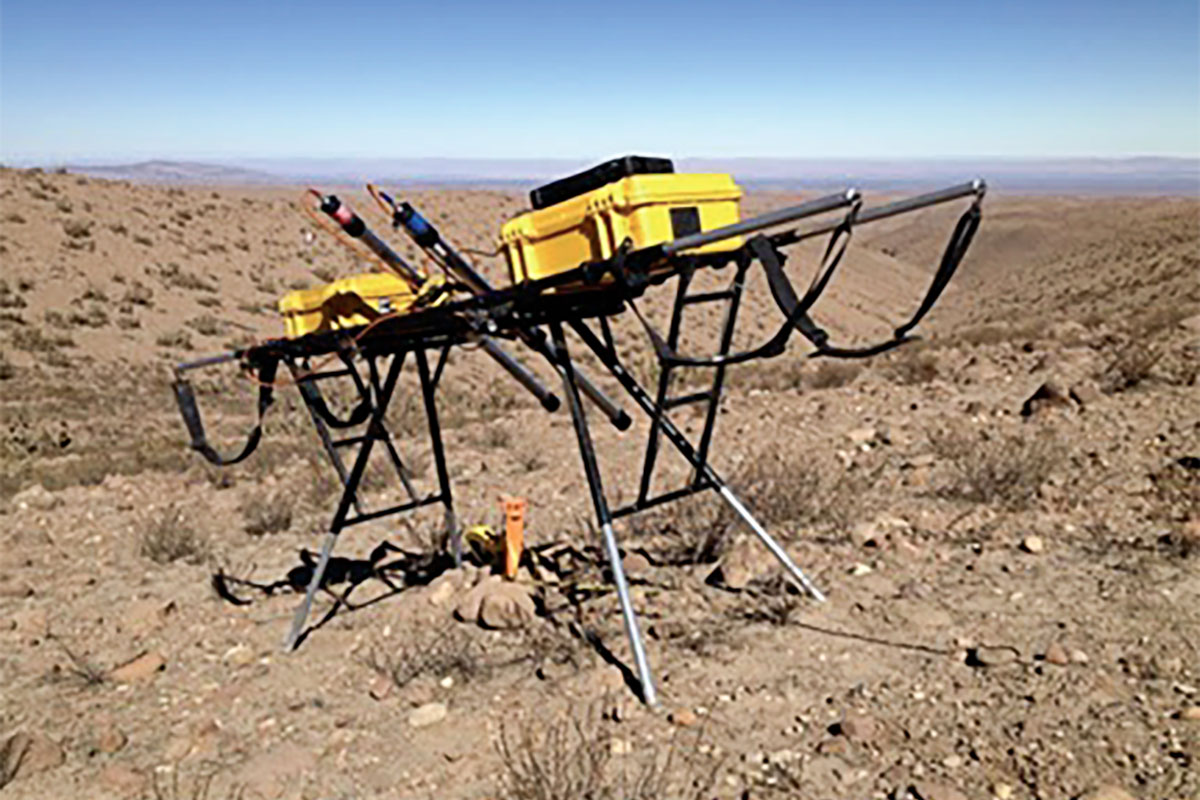
Stares are conducted by having the two antennas at a fixed point (Figure 2). The distance between transmitter and receiver sensors varies depending on the depth of penetration sought - generally, deeper penetration is achieved by widening the sensors separation. A Stare scan involves a large number of wave packets, typically 100 000 or more, to increase the signal to noise ratio for high resolution and precision regarding the composition of the section it is penetrating.
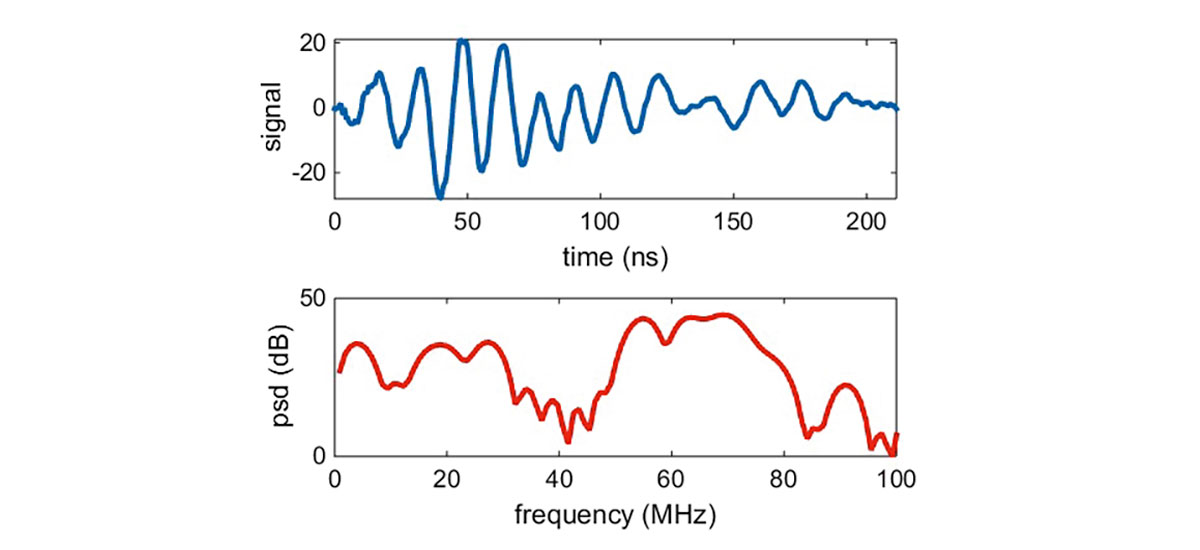
The transmitted ADR wave packet (see Figure 3 for an example) contains several frequency components in the range of 1-100 MHz, where the low frequencies achieve deep penetration whereas the higher frequencies enhance vertical resolution (van den Doel et al, 2014). When rocks of different compositions, dielectrics, and petrographic textures have been exposed to ADR wave packets, a range of energy and frequency responses are detectable by suitable receivers. The recorded data describe how rocks and minerals, including hydrocarbons, interact with the electromagnetic radiation as it passes through them, and suggests their composition. The technology measures the dielectric permittivity of the subsurface as well as characterizing the nature of the rock types based on analysis of both the spectroscopic and resonant energy responses.
ADR is a time-domain electromagnetic (TDEM) method, but differs significantly from methods such as induced polarization and resistivity methods. Those methods employ much lower frequencies and do not involve propagating waves, but rely on measuring currents and polarizations induced by (relatively) slowly varying electric or magnetic fields. ADR, on the other hand, uses propagating wave packets and derives subsurface properties from the changes in spectral content and energy measured in the reflections. As such, the data analysis resembles seismic methods more than the usual TDEM inversion techniques. However, ADR waves are electromagnetic which are governed by different physics than seismic pressure waves.
Ray tracing and finite-difference time-domain (FDTD) simulation software have been developed for numerical simulation of the ADR wave propagation through various subsurface materials (van den Doel and Stove, 2016). Simulated scans are used for preliminary feasibility studies and for experimental design of specific field scans using ground models based on known geology and/or borehole data, if available.
Experiments have been performed to quantify the depth penetration possible with the system, and to explain the results theoretically with a propagation model based on Maxwell’s equations coupled to a ground model.
Theoretical modelling and empirical field measurements show that the high frequencies of the transmission pulses into the ground penetrate very little, but the low-frequency component experience very low losses. Results are analyzed to estimate the skin depth and interpreted in terms of a constitutive model incorporating Maxwell’s equations with conductivity and polarization losses. In a separate experiment, an ADR field system successfully detected the reflection of the radar pulse from a body of water through 350 m of rock. A numerical simulation of the model confirmed that these results do not contradict theoretical expectations.
The model developed for electromagnetic wave propagation through the subsurface by van den Doel et al (2014) results in this system of partial differential equations:
EQUATION
EQUATION
where ε0 is the permittivity of free space, P is the polarization, E is the electric field, σ is the conductivity, τ is the Debye relaxation time, and εr is the relative permittivity.
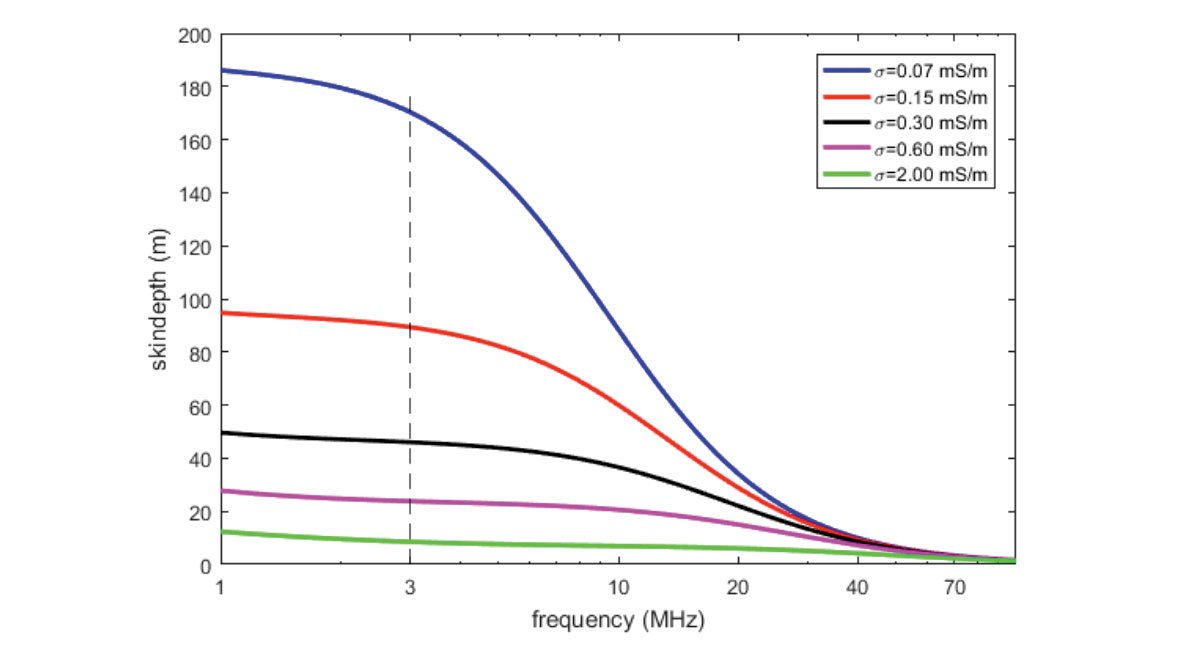
By using equations 1 and 2 with a correct application of the skin depth concept, it is possible to model (and measure in practice) deeper penetration of radio waves into the ground. For a given frequency in a uniform material, losses are proportional to distance no matter what the mechanism for signal attenuation/loss is. The depth of subsurface penetration must be exponential: e(-d/sd), where d is distance through the medium and sd is skin depth in metres. The skin depth is the distance where the signal falls off by 1/e. Skin depth generally decreases with frequency; penetration depth is proportional to skin depth. However, this depends on conductivity. In-situ conductivity value of the subsurface are generally unknown. In the experiments reported by van den Doel et al (2014), the ADR values of limestone conductivity were found to be 0.075 mS/m. The value measured was lower than generally assumed, but well within range of possible values (Jackson, 1998) (Figure 4). It would be desirable to confirm this value with independent measurements. Values for limestone conductivity reported in the literature vary widely, for example (Telford et al., 1990) quotes a range of 10-7 to 2x10⁻² S/m. The actual value depends on complicated and not fully understood details of how pore water is embedded in the rock, and which solutes are present in the solution. See for example Revil (2013). Furthermore, Schön (2004) quotes values from ε = 102 S/m (wet) to ε = 105 S/m (dry) with permittivity values of ε = 11 (wet) to ε = 6 (dry), suggesting the limestone studied by van den Doel et al (2014) had a rather low water content.
Practical application of ADR for groundwater detection
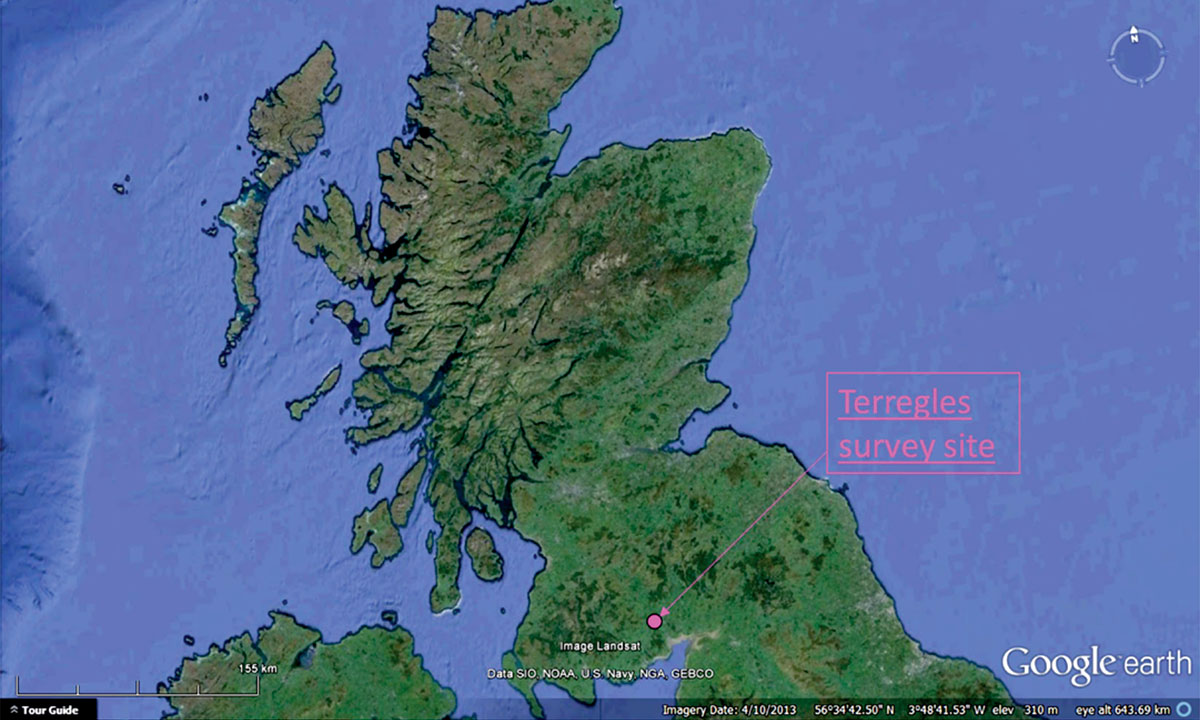
In November 2012, Adrok Limited performed a practical field experiment to try to identify the presence of known water aquifers beneath a site operated by Scottish Water in Terregles, Dumfries, Scotland (Figure 5 and Figure 6).
Scottish Water provided downhole logs drilled directly beneath the survey site, specifically detailing subsurface water flow and saturation.
The Dumfries Basin aquifer is one of the most important groundwater resources available in Scotland. The Permian-filled Dumfries basin overlies steeply dipping Silurian mudstones and sandstone units and is bound to the west and northeast by en echelon faulting (Robins and Ball, 2006). The aquifers are contained within the Permian Doweel Breccia and Locharbriggs Sandstone formations, present beneath much of Dumfries basin and are the main aquifers for the region.
The Doweel formation has low intergranular permeability and porosity but has high secondary permeability in the form of fractures. Consequently, horizontal permeability is more prevalent than vertical permeability and therefore water is transported through naturally occurring horizontal fractures and inter-layer breaks between sandstone and breccia units that exist throughout the basin, providing a high flow rate for water movement. This can be seen in the downhole logs provided by Scottish Water on the right-hand side of Figure 7.
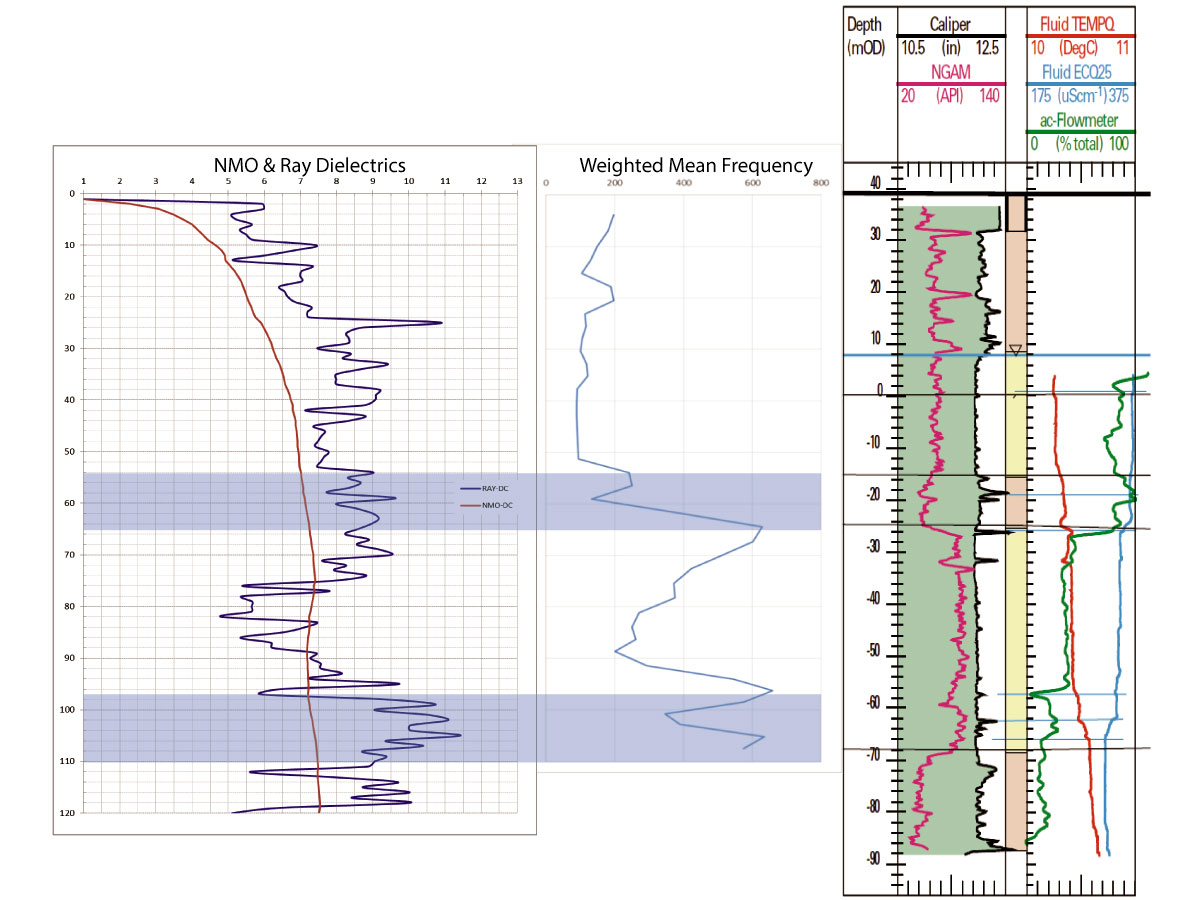
According to the geological information provided by Scottish Water, the two main aquifers are located in multiple fractures between 58-68 m and 98-110 m. This means that the aquifer is contained within in a less-permeable geological unit, confining the water to thin fracture networks. The stark difference between the water-rich fracture network and the enveloping non-permeable breccia provides a useful contrast for analysis of the ADR scanner results.
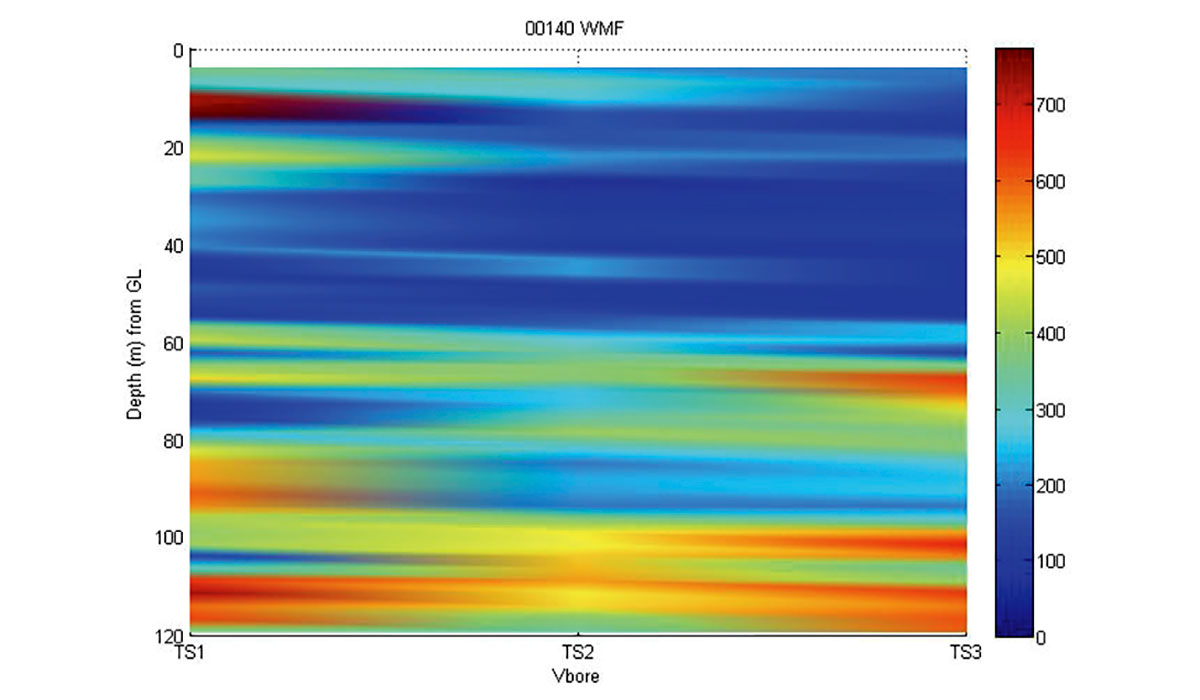
Adrok acquired three Stare scans (“virtual boreholes”) at Terregles: TS1, TS2, TS3. They were along a line, separated by 60 meters. The depths were obtained from the WARR scans at each Stare site.
Results of TS3 demonstrate that high Dielectrics and peaks in the Weighted Mean Frequency (Figure 7) could both be used to directly identify the location of the aquifers within the subsurface matched or closely matched with the fracture zones and therefore the aquifers at 58-68 m and 98-110 m with an offset of about 1-2 m.
Figure 8 clearly demonstrates that the aquifers at 58-68 m and 98-110 m are being identified by the ADR scanner at the same depths, separately across the three ADR Stare measurements: TS1, TS2 and TS3.
The Terregles aquifer study demonstrates that ADR technology can identify aquifers using a combination of Dielectrics and Weighted Mean Frequency (Figure 7). This cheap, quick, reliable, and non-destructive technique can be used to identify the presence of water in the field. It could be used to greatly reduce the drilling costs associated with water aquifer exploration and help map, to great detail, fracture pathways in the subsurface. Ultimately, a 4-dimensional (4D) ADR sensing system could be developed that would have the capability to continually monitor water levels and may also be able to show flow rates within aquifers. This would have applications for early warning flood defences and companies wishing to explore for and monitor water aquifers.
Conclusions
Theoretical results, as well as those from field experiments and surveys, suggest that the exploration depth of pulsed radar can be increased significantly by including a low frequency component. Data suggests the high losses of Ground Penetrating Radar (GPR) in the 10 - 1000 MHz range are due to polarization effects, rather than conductivity losses (van den Doel et al, 2014). Measurements of limestone conductivity indicate that the skin depth for the low-frequency component of an ADR wave packet could achieve much greater skin depth than possible by GPR. If these results hold for other rock types, deeply penetrating radar scanning can potentially become an attractive geophysical exploration technique in selective environments where there is no highly conductive near-surface layer, or where this layer is thin enough to penetrate.
The ability to utilise ADR technologies for determining subsurface lithology and fluids pre- drilling would generate large cost savings as well as environmental savings for monitoring subsurface groundwater and general geology.
The results of these experiments are encouraging and warrant further investigations. Of particular interest is the ADR’s ability to detect subsurface water at great depth.


Join the Conversation
Interested in starting, or contributing to a conversation about an article or issue of the RECORDER? Join our CSEG LinkedIn Group.
Share This Article