Abstract
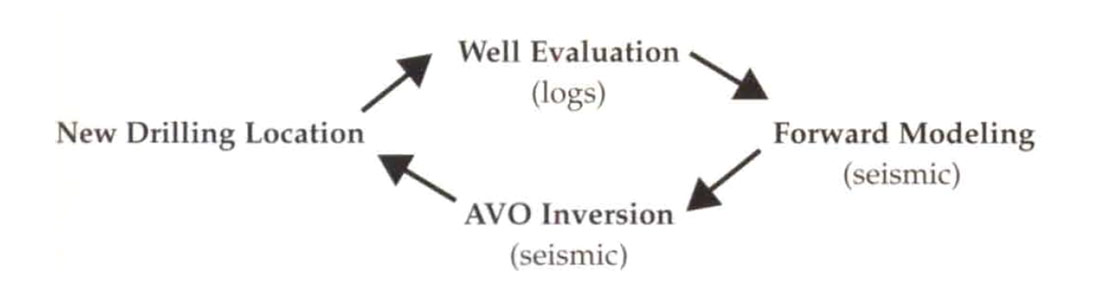
This paper will illustrate the role of the full waveform acoustic log as a useful tool in the exploration cycle of the example well. This cycle, as illustrated in figure 1 below, includes the petrophysical evaluation of a newly drilled location, the seismic inversion work that was used to identify this location, and the seismic modeling that was used to validate the inversion and complete the cycle.
An anomaly was identified on a 2-D seismic line and an interpretation was made based on AVO (Amplitude Variation with Offset) inversion. However, AVO inversion has many uncertainties associated with it and the AVO response does not uniquely determine the geology. Despite efforts to predict the geologic nature of the anomaly, some question remained regarding the veracity of the interpretation and the AVO inversion. The location was drilled and a full waveform multipole array acoustic log was run to verify the validity of the seismic analysis and as a petrophysical aid in determining if the reservoir was gas bearing. With the use of the multipole acoustic data, a productive gas zone was found and cased and the seismic ambiguities were resolved.
Introduction
For a number of years now, multi pole full waveform compressional and shear acoustic logs have been available to E&P companies. Using the Baker Atlas Multipole Array Acoustic (MAC™) tool, Calahoo Petroleum Ltd. acquired shea r and compressional slowness data on its Enchant well at 3-13-14-18W4 in Alberta. The various applications of this MAC data in Calahoo's E&P efforts are the focus of this paper.
A limitation exists in acoustic logging with the use of standard, omnidirectional, monopole sources where no shear mode will be recorded if the formation shear velocity is less than the velocity of the mud in the borehole. Dipole acoustic tools were designed to get around this limitation. The MAC tool, and the next generation Cross-Multipole Array Acoustilog (XMAC™) tool, incorporates two monopole transmitters and two dipole transmitters, each with an array of 8 receivers. With the use of a dipole tool, full waveforms are recorded that, despite slow formation velocities, will include compressional and shear information. These waveforms are put through an Nth root correlation algorithm to produce compressional and shear slowness values.
Typically, compressional slowness values are used for porosity calculations and as an aid in lithology determination. Shear data can be used for rock property calculations for hydraulic stimulation. Utilizing the well-understood effect of gas on acoustic results, it is possible to go beyond these basic applications.
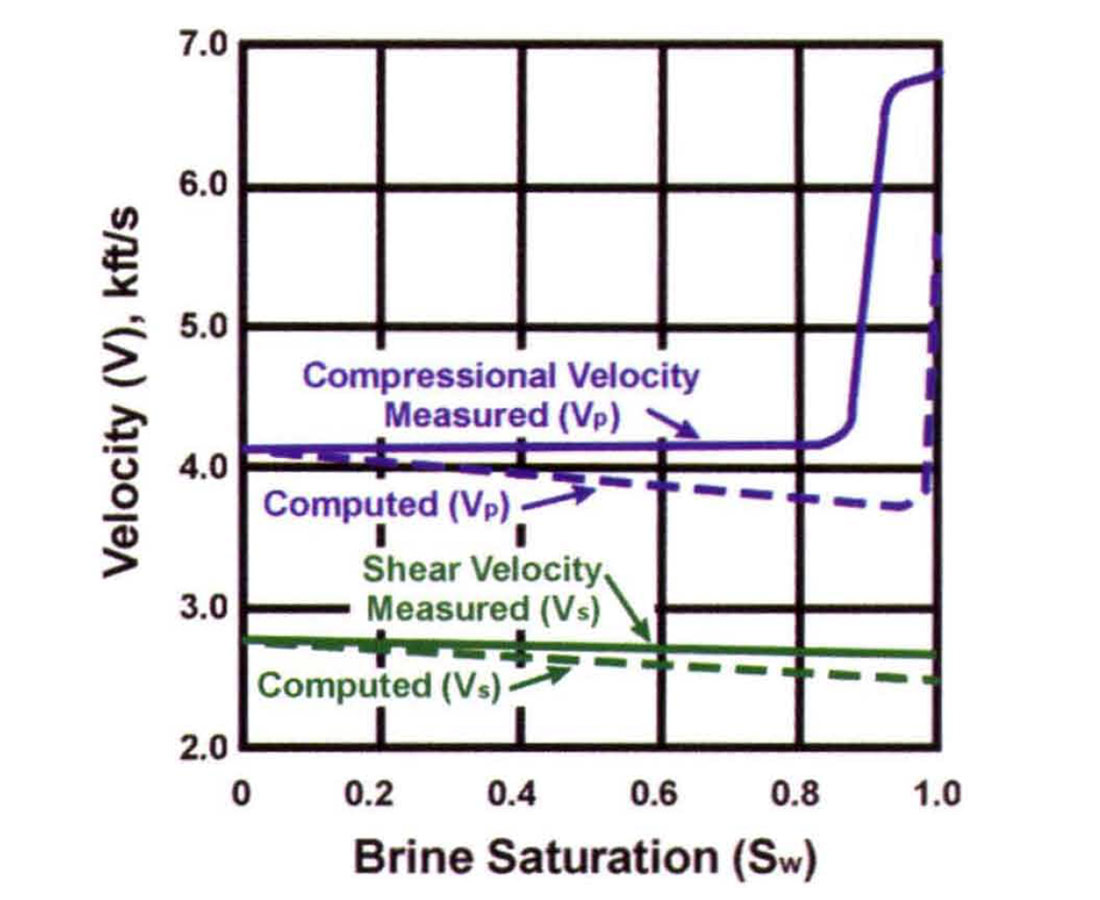
The introduction of a small amount of gas in the pore spaces of clastic rocks causes a large increase in compressional slowness and a small decrease in shear slowness. That is, a clastic rock with some gas saturation will exhibit anomalously low ratio values of shear to compressional slowness (low SCRA or Vp/Vs). It is the relatively high compressibility of the gas that is the fundamental driver of this effect. Only small quantities of gas (low gas saturations) are needed to cause a Vp/Vs anomaly (figure 2). This acoustic gas effect is most obvious in clastic rocks and becomes more pronounced in younger, less consolidated formations. Gas effects become ambiguous in framework dominated rocks such as carbonates and acoustically fast clastics (DTS < 425 usec/m). Both petrophysical and seismic techniques, which rely on this acoustic gas effect, were used to evaluate the well in question.
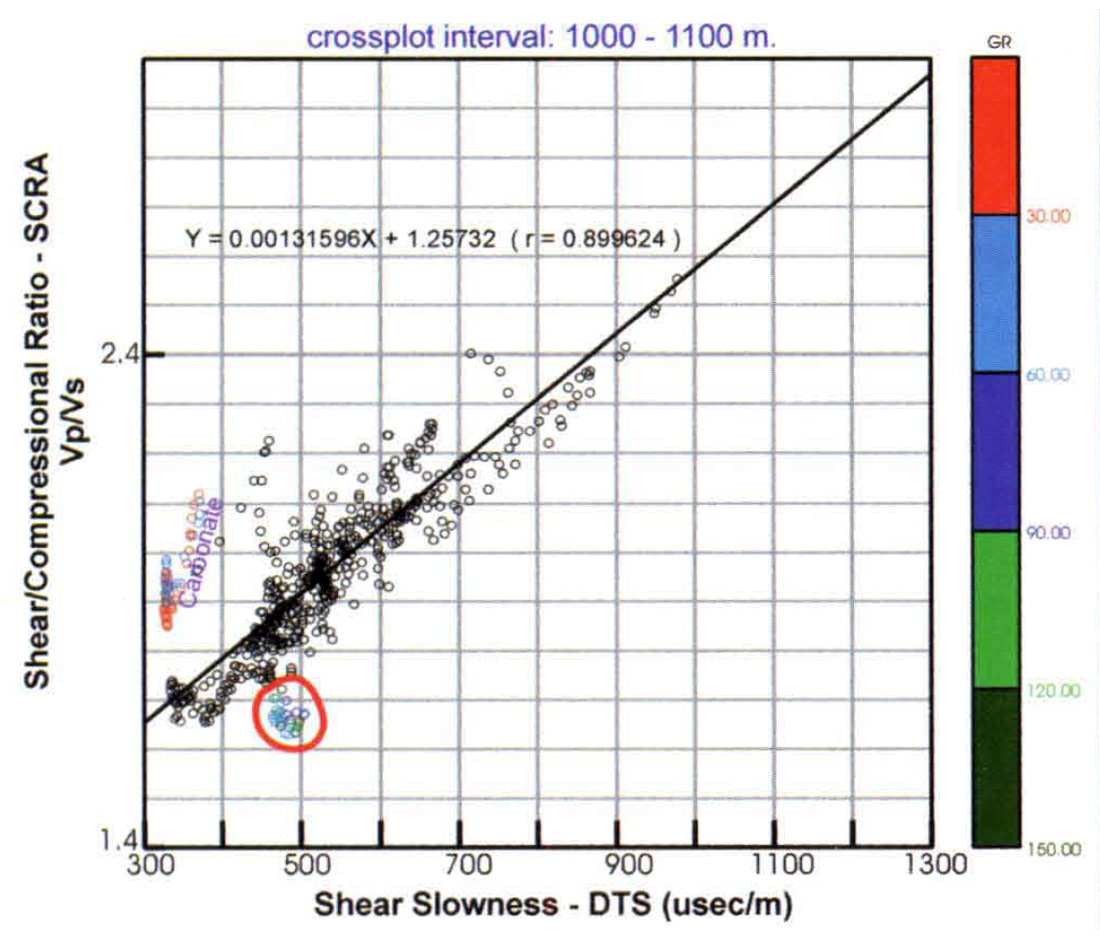
D.M. Williams (1990) proposed the Acoustic Log Hydrocarbon Indicator (ALHI), which employs a crossplot of SCRA (Vp/Vs) verses shear slowness (DTS). Shales and water bearing sands plot along a background trend from lower-left to upper-right on the crossplot. Due to low SCRA values, gas-bearing sands will tend to stand alone below the background trend. The ALHI technique was applied to the Enchant well as a petrophysical aid to help identify potential gas bearing intervals (figure 3).
The exploration use of well logs has always extended beyond the evaluation of reservoir quality and fluid content in a particular well bore. Geophysicists have traditionally made use of well logs for the reciprocal purposes of forward and inverse modeling. Forward modeling is an experiment where the geologic parameters of velocity and density are input to an algorithm, which creates a model of the seismic response. Forward modeling is used to help the geophysicist identify the seismic response of a wide variety of geological scenarios. This method is limited by the sophistication and appropriateness of the modeling algorithm as well as the geophysicist's choice of input parameters, which originate from the well log data. Inverse modeling is an experiment that attempts to take a seismic response, and by use of an algorithm, estimate the earth parameters responsible for the seismic image observed. There are usually several non-unique possible causes for any particular seismic response, so the geophysicist often imposes a constraint to drive the model in an appropriate direction. The appropriateness of the constraint critically determines the validity of the inversion experiment. It is for this reason that the compressional velocity and formation density information from well logs are important elements of the inversion method. Both of these modeling methods help the geophysicist make appropriate estimates of the meaning of the seismic data, and ultimately lead to the analysis and subsequent drilling of exploration and development prospects.
The acoustic gas effect discussed earlier has also been of special interest to geophysicists, and has lead to a resurgence in interest in the seismic methods of amplitude versus offset analysis, or AVO, and AVO inversion. These two related seismic methods attempt to estimate elastic earth parameters by solving the Zoeppritz equations. These equations quantify information about both the shear and the compressional reflection velocities of the earth from standard multi-offset compressional data. AVO methods may yield data that is vastly more useful to exploration, but it is well known that it is also much more difficult to obtain results that have a satisfactory level of integrity. It is for this reason that the methods of forward and inverse modeling, long used in conventional seismic exploration, are of even greater importance in the overall scheme of AVO methodology. The elastic earth properties of compressional and shear wave velocity available in the full waveform acoustic log are important as input data for the forward modeling and as constraints for the inverse modeling, and are therefore crucial to the AVO methods being discussed.
The Zoeppritz equations are very complex, and have been simplified into several shorter forms that find use in current AVO methodologies. These short forms all essentially analyze the multioffset seismic gather as having an amplitude at zero offset or angle, called the intercept value, and having a rate of change of amplitude with angle, called the gradient. Analysis of the intercept and gradient terms gives information about the elastic rock properties of the imaged subsurface. In recent work by Cidlow et al (1992), it was shown that the compressional and shear wave reflectivity may be estimated from the intercept and gradient, respectively. It should be noted that the extraction of the reflectivity sequences does require some basic knowledge about the compressional and shear wave velocities in the area as well as the densities.
Goodway et al (1997) revealed an extension to Gidlow's work in which they extracted Lame's parameters from an inversion of the compressional and shear wave reflectivities. The Lame's parameters are very useful in geophysical prospecting because they may be used to interpret fluid type and lithology. Goodway's method is outlined below:
- Perform AVO analysis using Gidlow's method to obtain the compressional and shear reflectivities.
- Perform an inversion on each reflectivity sequence to obtain the compressional impedance I-, and the shear impedance IS.
- Manipulate these results to obtain Lame's parameters:
λρ Iρ2 - 2 IS2
μρ IS2
where λρ (lambda-rho) is the incompressibility multiplied by the density, and μρ (mu-rho) is the rigidity of the rock multiplied by the density.
TI1e incompressibility of the rock is effected by the presence of fluid, particularly gas, while the rigidity of the rock is dependent on the rock matrix. Gas sands are characterized by low values of lambda-rho and low lambda-rho over mu-rho ratios. In performing this analysis, the geophysicist is attempting to make a similar analysis on the seismic data as the petrophysicist makes with the full waveform acoustic log and the ALHI technique.
Limitations of AVO Techniques: A Need for Compressional and Shear Wave Velocity Data
The AVO inversion method as outlined above may seem to be a simple solution to seismic interpretation in clastics, but unfortunately the correct application of this technique is very difficult. Seismic data has an abundance of noise, and a level of complexity that make the AVO analysis very difficult to perform accurately. Scaling of the gathers with offset is a critical issue. Having a nearby full waveform acoustic log and a density log can be helpful in the AVO processing and data conditioning sequence. The full waveform data, together with the density log can be used to create a multi-offset forward model. This model can be used to help qualitatively calibrate the conditioning and processing of actual AVO gathers. The full waveform data can also be used to help calibrate the AVO equation being used, which requires a basic knowledge of the compressional and shear velocities. In many cases, unexpected drilling results occur despite the most rigorous work. Recording a full waveform acoustic log may allow the geophysicist to investigate any possible error in the AVO analysis.
A nearby full waveform acoustic log may be useful as a constraint for the inversion itself. Inversion techniques often need to be constrained in order for the results to have stability, resolution, and greater uniqueness. The inherently unstable AVO inversion method clearly requires an appropriate constraint.
Discussion
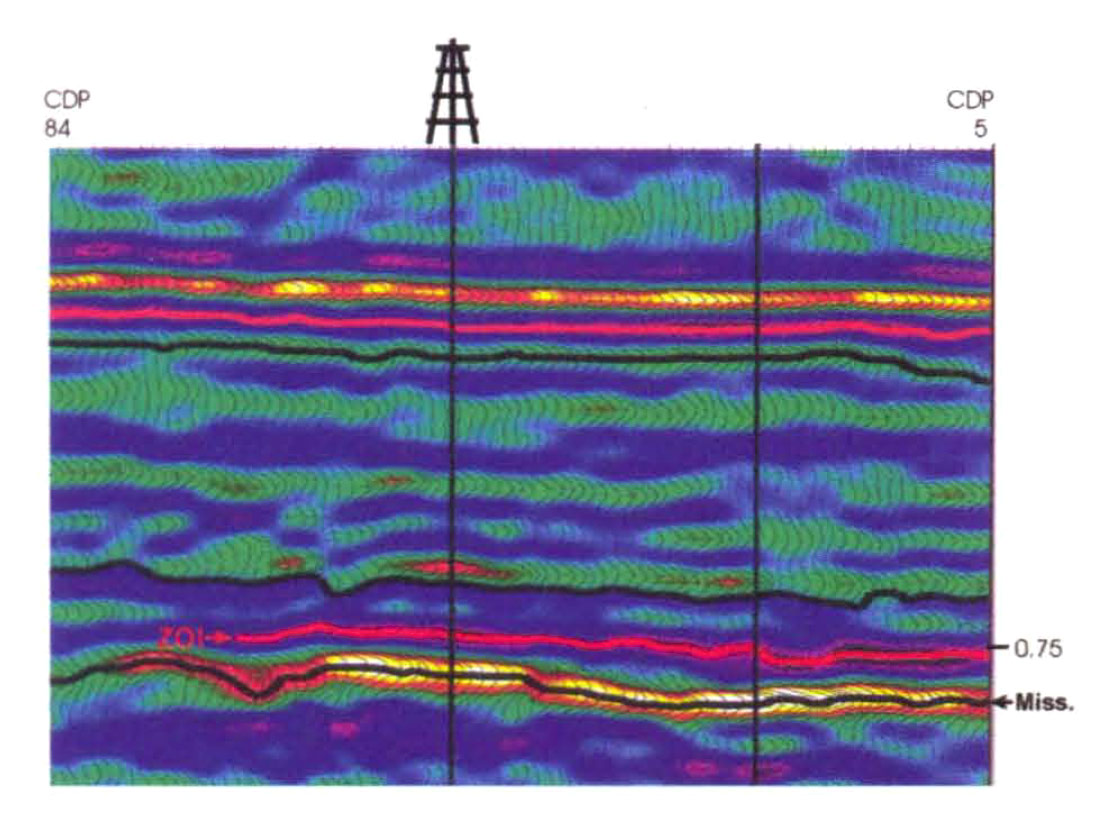
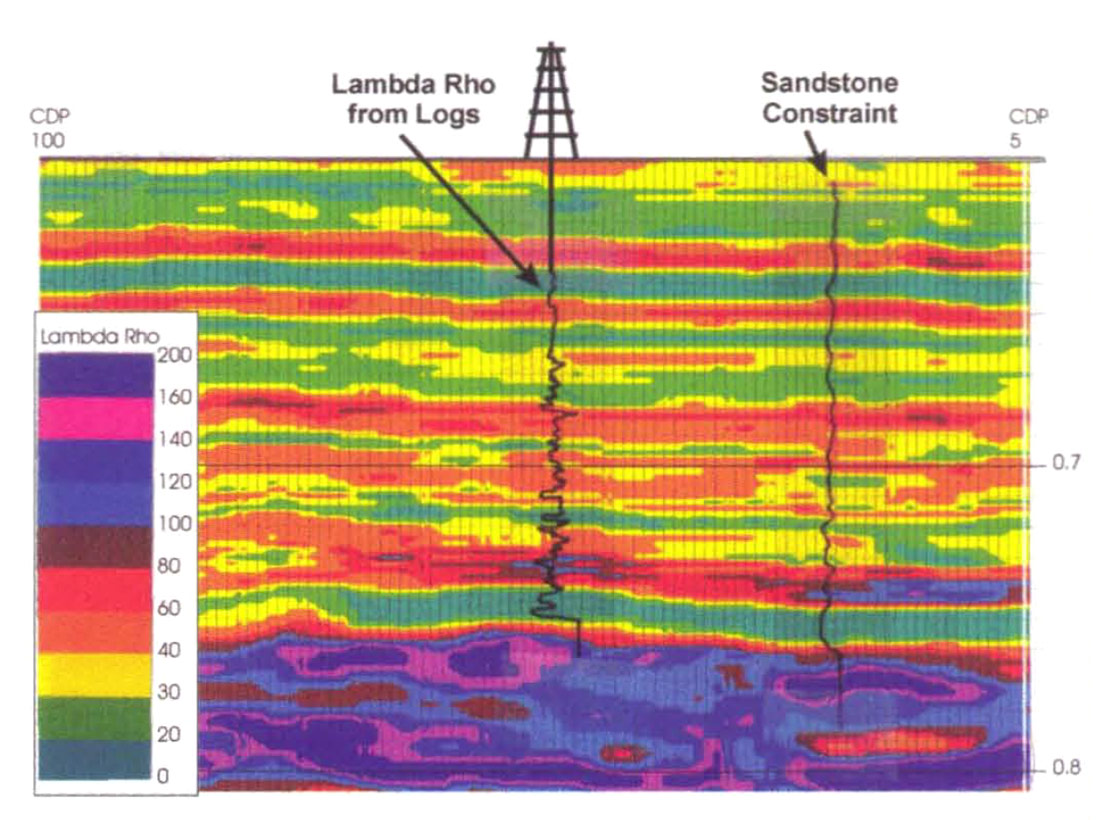
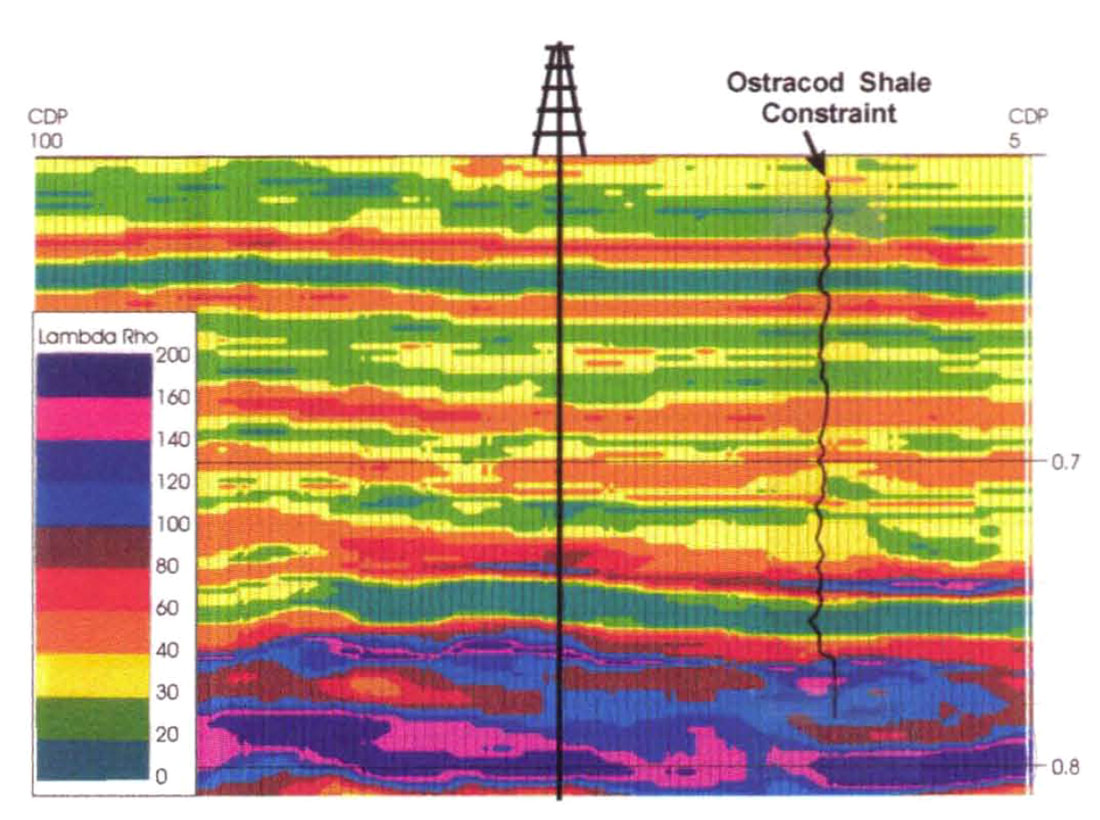
Calahoo Petroleum Ltd. recently drilled a cretaceous gas well in southern Alberta. The location was picked as a result of AVO inversion work that was performed on a 2-D seismic line. There was a lack of full waveform data in the area, so Calahoo recorded Baker Atlas's MAC tool to better evaluate the drilling results and the accuracy of the geophysical work. The seismic section with the well location marked is shown in figure 4. There is a significant amplitude increase in the trough just above the Mississippian level at about 0.75s. AVO inversion was performed on the seismic yielding the lambda-rho estimate illustrated in figure 5a. The low values of lambda-rho at 0.75s suggested the strong possibility of a gas sand at the well location. The large time-width of the anomaly was also important because there also exists a regional Ostracod shale in the area that could have low lambda-rho values??? The Ostracod shale in the area is typically only three or four meters thick, while a gas sand could be more than ten meters thick. An inverse modeling experiment was performed to determine whether the anomaly was more likely to be caused by an Ostracod shale or a thick gas sand based on this difference in thickness. In this experiment, the inversion was performed twice: once with a constraint that drove the solution towards an Ostracod shale solution, while the other inversion had a constraint that drove the solution towards thick gas sand. The results of this experiment are shown in figures 5a and 5b. The inversion results look similar for each case. Both solutions tend towards the prediction of a thicker anomaly than the Ostracod shale constraint. The data resisted being driven towards any solution where the anomalous zone was thin. This work lead to the prediction of a thick gas sand at the prospect rather than the Ostracod shale.
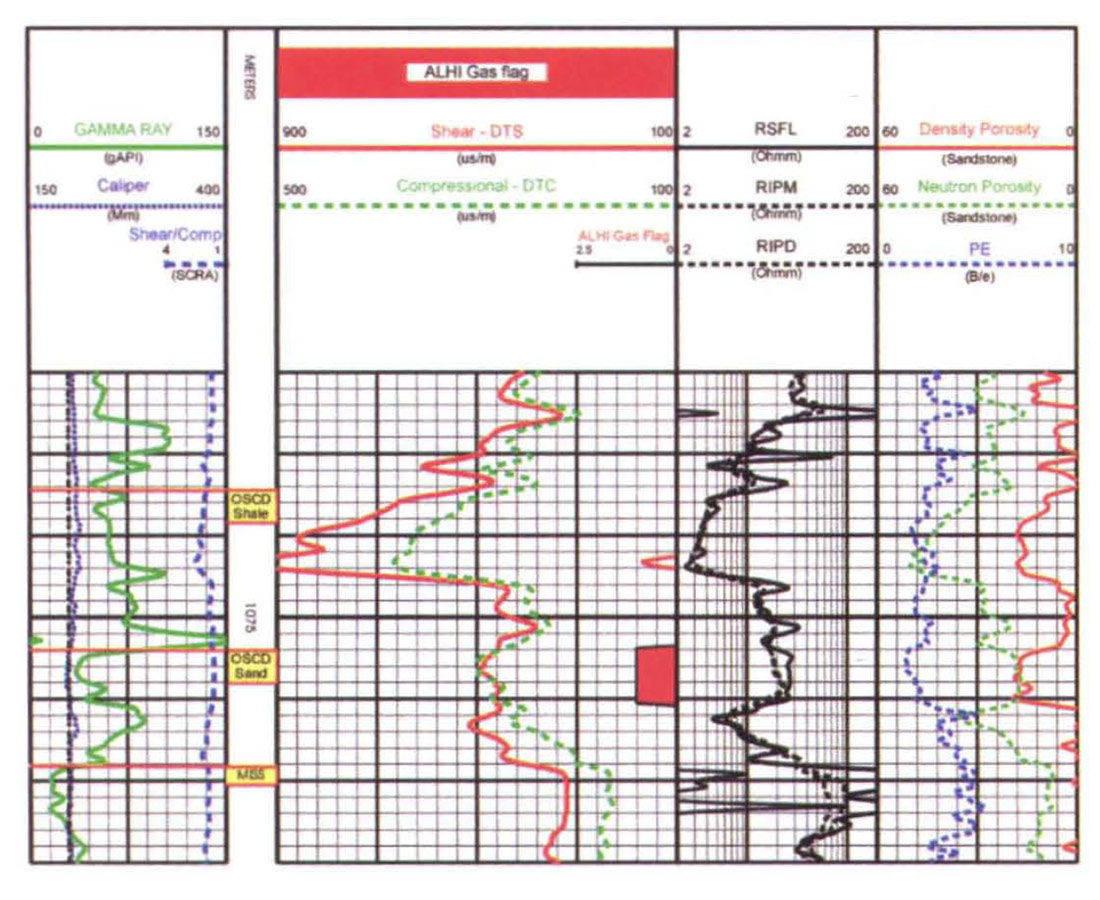
The well was drilled, and the results were somewhat unexpected: there existed an anomalously thick Ostracod Shale overlying a thinner sand unit in the zone of interest. The logs from the well are shown in figure 6. The sand is at 1077 to 1080.5m, and it is unclear on the neutron density and the resistivity curves whether the zone is gas bearing or not. The ALHI method was performed using the full waveform data recorded. The ALHI crossplot is shown in figure 3. A cluster of samples with anomalously low SCRA values was circled and subsequently flagged beside the logs shown in figure 6. The gas flag appears beside the sand zone under discussion. The well was cased and production tested with initial rates of 85,000 m3/d of gas.
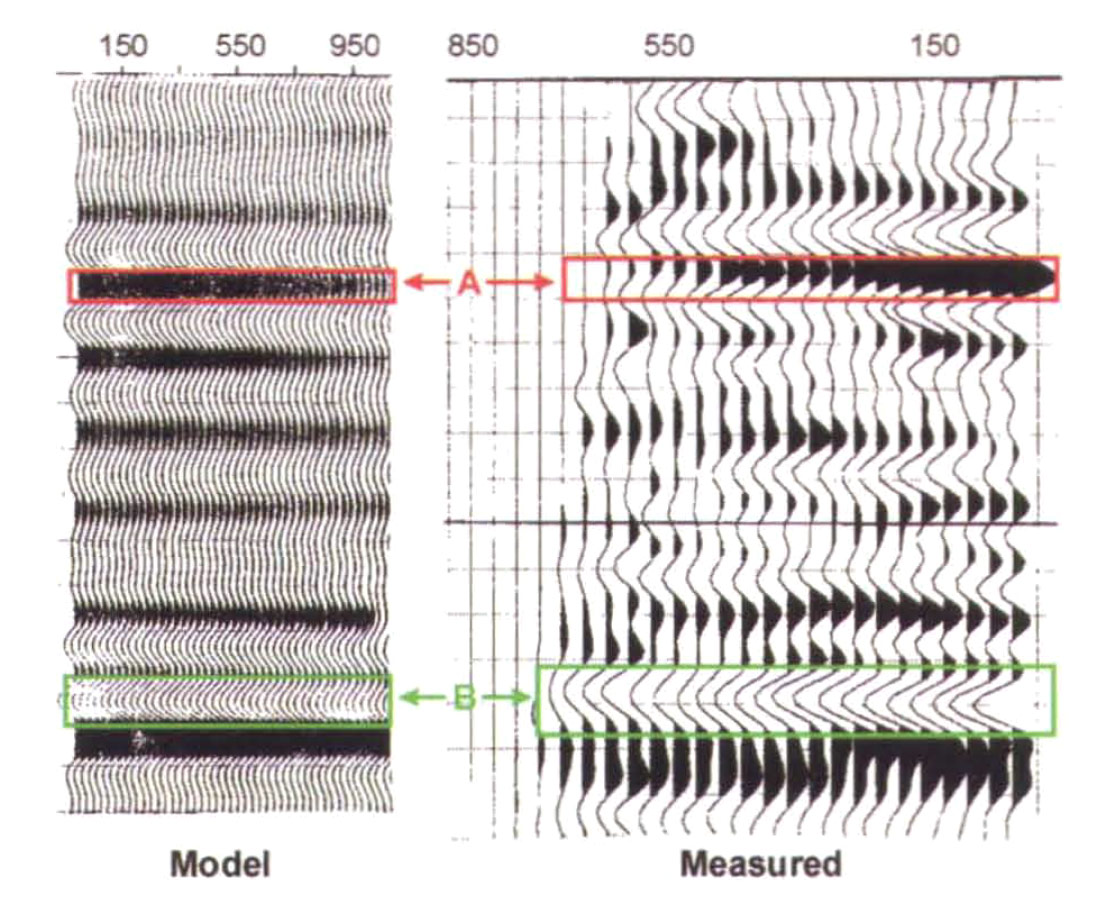
The question remained as to whether or not the AVO inversion work was in error. Two things were done to check this aspect of the geophysical work: the first was to create a synthetic multi-offset model to compare to the final processed gathers that were input to the AVO analysis, and the second was to overlay the Lambda-rho curve calculated from the full waveform acoustic log on to the Lambda-rho inversion from the seismic. Figure 7 shows the comparison of synthetic versus actual seismic gathers. The AVO character at the zone of interest on these gathers is similar enough that we must conclude that the data conditioning was performed adequately. The Log derived Lambda-rho overlay is illustrated in figure 5a, and is a good match to the seismic lambda-rho estimate. The reason for this is: the anomalously thick Ostracod shale, together with the thinner gas sand form the basis for the seismic anomaly, and constitute an unexpected third possibility that was not modeled for. This result is an interesting illustration of the problem of non-uniqueness in seismic interpretation. The modeling and inversion work that had been performed prior to drilling the well had focussed on the Simple question of gas sand versus Ostracod shale, and had never considered a third possibility that included unusual thicknesses of both. By integrating the techniques of AVO inversion and AVO modeling with measured multipole array acoustic data, ambiguities can be minimized.
Conclusions
The full waveform acoustic log is useful to exploration as a tool in formation evaluation, as well as a desirable element of data to be used in conjunction with AVO inversion work both prior to and after drilling exploration prospects. In the example illustrated here the full waveform data helped to identify a gas sand in the drilled well, and verified the validity of the AVO inversion performed prior to drilling the well. The full waveform acoustic log may play a role in the entire cycle of the AVO exploration paradigm.
Acknowledgements
We would like to thank Steve Dryer of Calahoo Petroleum, Yongyi Li and Jon Downton of Integra Geoservices inc., Ana Abad of Veritas DGC GeoServices, and John Parkin of Baker Atlas, for their assistance and encouragement in this project.


Join the Conversation
Interested in starting, or contributing to a conversation about an article or issue of the RECORDER? Join our CSEG LinkedIn Group.
Share This Article