Abstract
The influence of basement control on sedimentation through fault reactivation within the Western Canada Sedimentary Basin has been an important matter of research that lead to the Alberta Basement seismic Transects completed by Lithoprobe. However, due to the long seismic line lengths (about 40 km) and long recording times (about 16 seconds) required to acquire a seismic profile that extends into the basement, the resulting seismic data do not have the depth resolution to investigate any direct link between basement features and overlying strata. The purpose of this study is to add to the discussion on fault reactivation and basement control overlying sedimentation through the integration of topographic and airborne magnetic evidence. These datasets were interpreted jointly, and then 2.5D sections were modelled to provide some constraint on the depth to the top of the magnetic sources. Finally, the 2.5D results were integrated in 3D to show the geometry of the mapped faults. The 3D model presented here corroborates an early model for the Medicine Hat Block which comprises extensional crustal-scale ramps dipping to the west.
Introduction
The influence of basement control on sedimentation through fault reactivation has major ramifications for oil exploration strategies within the Western Canada Sedimentary Basin that directly lead to the Alberta Basement Transects of Lithoprobe (Edwards and Brown, 1999; Hope and Eaton, 2002; Lemieux, 1999). As Ross and Eaton (1999) state the mere coincidence of structures does not provide evidence for actual displacement. Studies undertaken in the Alberta Basin have been reported as providing evidence both for and against basement reactivation (Lemieux, 1999; Ross and Eaton, 1999). While small-scale studies seem to indicate that there has been basement reactivation in the Alberta Basin, large-scale studies seem to refute this.
The purpose of this study is to add to the discussion of fault reactivation and basement control overlying structure on southern Alberta by integrating topography and airborne magnetics as evidence. The key questions being addressed are: (1) does topography reflect shallow (sedimentary) structure; and (2) if it does, is shallow structure influenced by controlling basement features?
To accomplish that, we integrate ideas about topography as it relates to the surficial and subsurface geology of the region, potential field maps and basement structure. The rationale in which we base this work is as follows:
- High Resolution digital elevation models (DEM) contain information on the surface trajectory of faults and the differential elevation of sedimentary layering. These can provide evidence for fault displacements;
- Aeromagnetic surveys over basement covered by nonmagnetic sediments contain information on lithological contrasts in the basement and the morphology of the basement/cover surface;
- Therefore, integrating results from DEM and aeromagnetic modelling can provide direct evidence for basement reactivation.
Four sources of data are considered:
- Regional topography – 100 x 100 km topographic model produced using radar altimetry techniques (Markham, 2001).
- Potential field data – aeromagnetic survey of the same 100 x 100 km region as the topographic model (Markham, 2001).
- Surface geology – information based on descriptions of surficial geology as published by Beaney and Shaw (2000), Kulig (1996) and Westgate (1968).
- Basement geology of Alberta carried out using potential field and seismic data (from the LITHOPROBE study and the Geological Atlas of the Western Canada Sedimentary Basin), synthesized from studies by Burwash et al. (1994), Lemieux (1999), Lemieux et al. (2000), Pilkington et al. (2000), Ross and Eaton (1999), Ross et al. (1991) and Villeneuve et al. (1993)
Topography and magnetic data were interpreted jointly, and then 2.5D sections were modelled to provide some constrain on the depth to the top of the magnetic sources. Finally, the 2.5D results were integrated in 3D to show the geometry of the mapped faults.
Regional geology
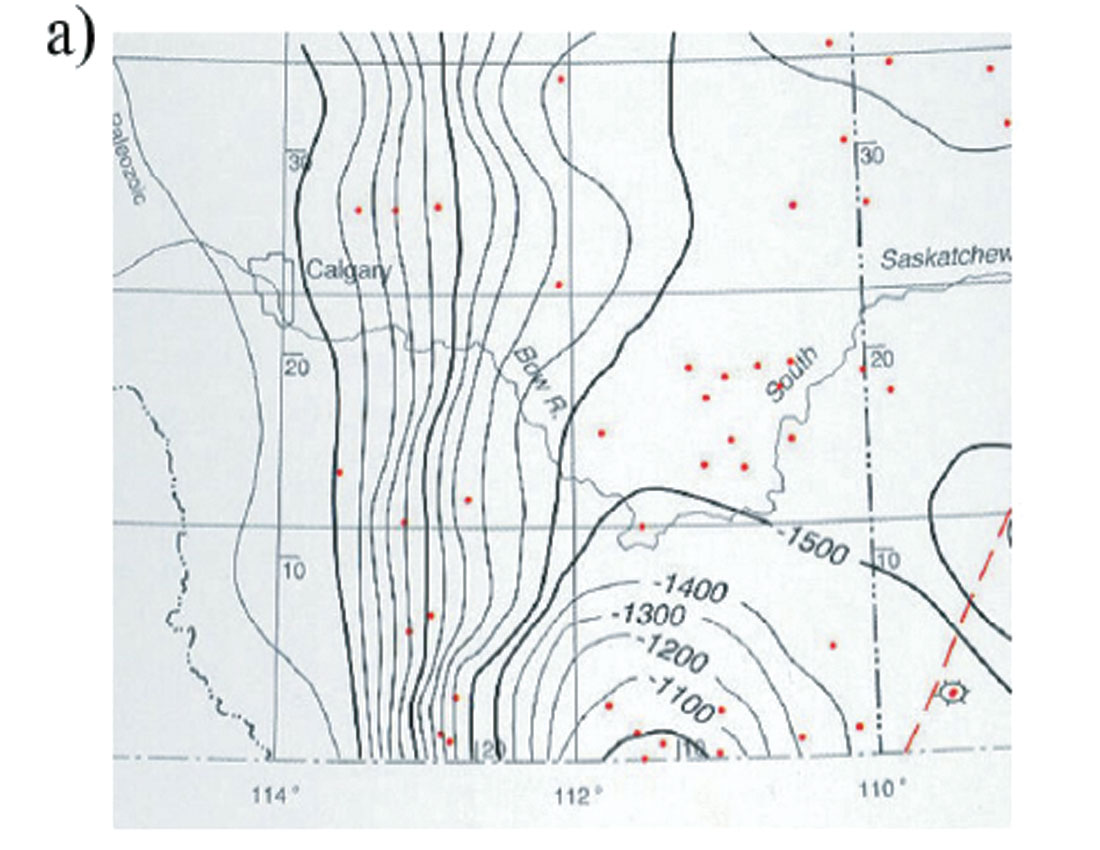
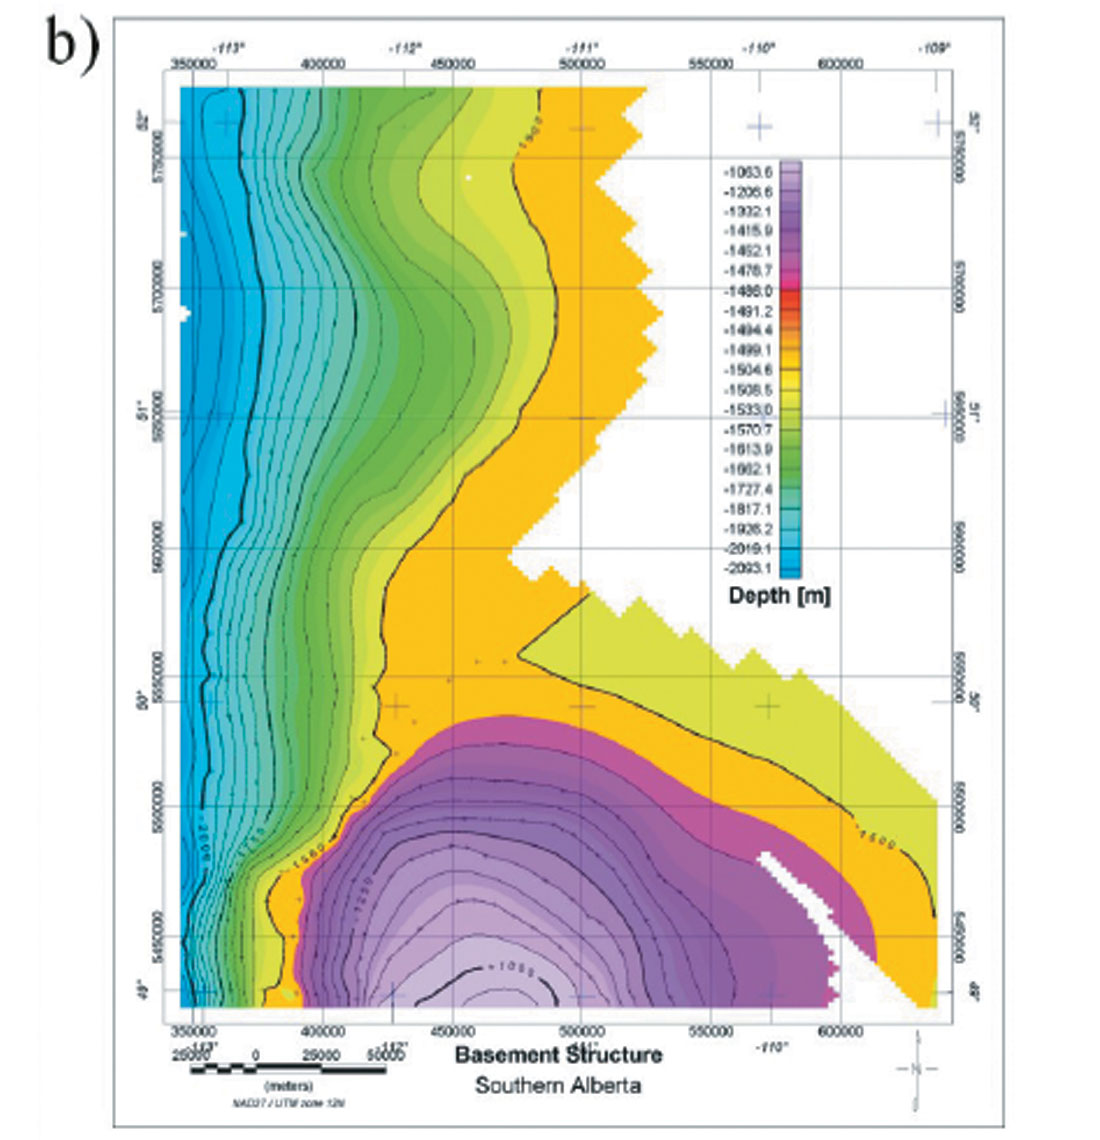
The study area is situated on the eastern flank of the Sweet Grass Arch, a structural anticline dividing the Alberta Basin in the northwest from the Williston Basin to the southeast (Figure 1a). East and northeasterly dipping beds overlying a deep, crystalline basement characterize the thick sedimentary section (Figure 1b). The geology of the study area can be broken into three distinct units (Beaney and Shaw, 2000; Westgate, 1968):
- Pleistocene glacial deposits.
- Phanerozoic sedimentary rocks of the Western Canada Sedimentary Basin, which overlay older basement rocks.
- Precambrian crystalline basement rocks, the continuation of Canadian Shield rocks.
The structure of these three distinct units is interdependent: structure in basement rocks may influence structure in the overlying sedimentary section, which may in turn have an effect on structure in younger glacial deposits. Each of these geological units is separated by an unconformity.
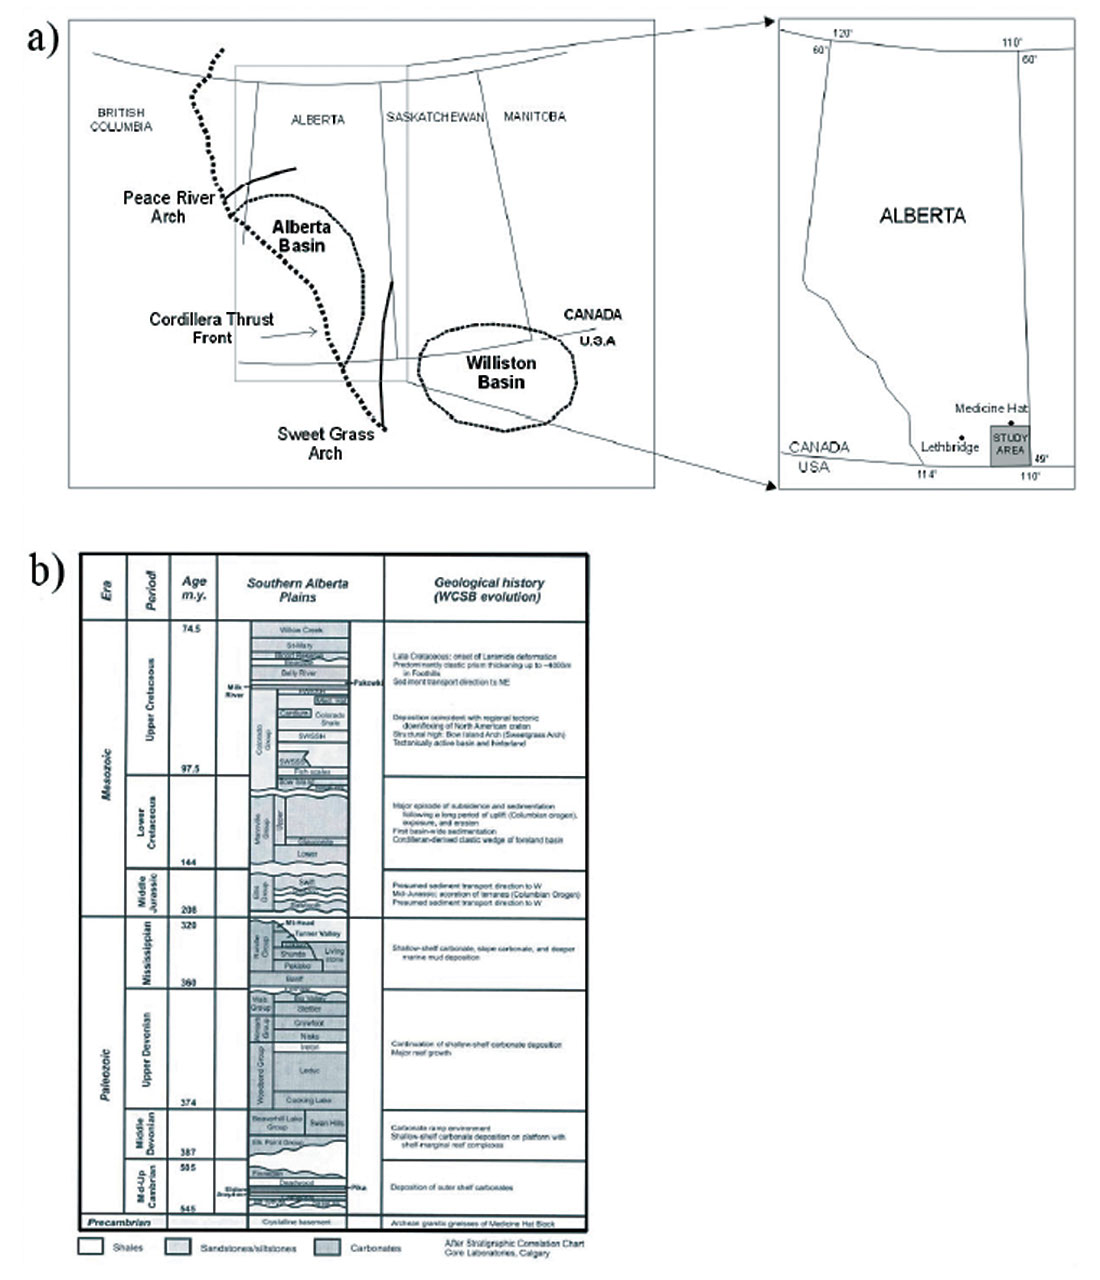
Crystalline basement rocks were formed by accretionary events that began in the Archean and ended during the Early Proterozoic (~1.8Ga). Phanerozoic cover rocks in southern Alberta range in age from Cambrian (545 Ma) to Upper Cretaceous (74.5 Ma), and are overlain by recent glacial sediments. Work by Kakreuth and McMechan (1988) suggests that about 2 km of sedimentary rocks deposited during the Mesozoic and Cenozoic have been eroded from the area since the Oligocene. If 2 km of sediments have been removed, then units beneath the recent overburden are a record of sedimentary structure and fault control as it occurred in the Cretaceous. If lineaments in topography expressed through overburden can be correlated with structure in underlying sedimentary rocks, it might suggest recent movement along those structures. At a minimum it confirms the presence of faults or joints in the subsurface. If these lineaments can then be linked to basement structure, it furthers the argument for basement control. This was noted by Westgate (1968), who recognized surficial lineaments that could not be explained by the direction of glacial movement. These nonglacial lineaments were described from aerial photographs as being several kilometers long, and intersecting or subparallel. Westgate attributed these lineaments to represent fault or joint traces reflected through unconsolidated glacial drift.
The Alberta Basement Transects of Lithoprobe (Edwards and Brown, 1999; Hope and Eaton, 2002; Lemieux, 1999; Ross and Eaton, 1999) provided good insights into the basement structure. However, there are a number of limitations with seismic data as used to provide a direct link between basement features and overlying strata, due to the long (about 40 km) seismic line lengths and recording times (about 16 seconds) required to produce a seismic profile that extends into the basement. Vertical resolution of the Lithoprobe data is about 30 metres for thin beds and fault displacements. Therefore, neither basement not sedimentary topographic features of 30 metres or less will produce reflector displacements; and also the structures must have a dip of less than 70 degrees to be properly resolved.
Airborne magnetics and topography
Total field aeromagnetic data were acquired along NS lines, 150 m elevation above the ground and 400 m spacing. The data were interpolated using a minimum curvature gridding algorithm and a grid cell spacing of 80 m (Figure 2; Markham, 2001).
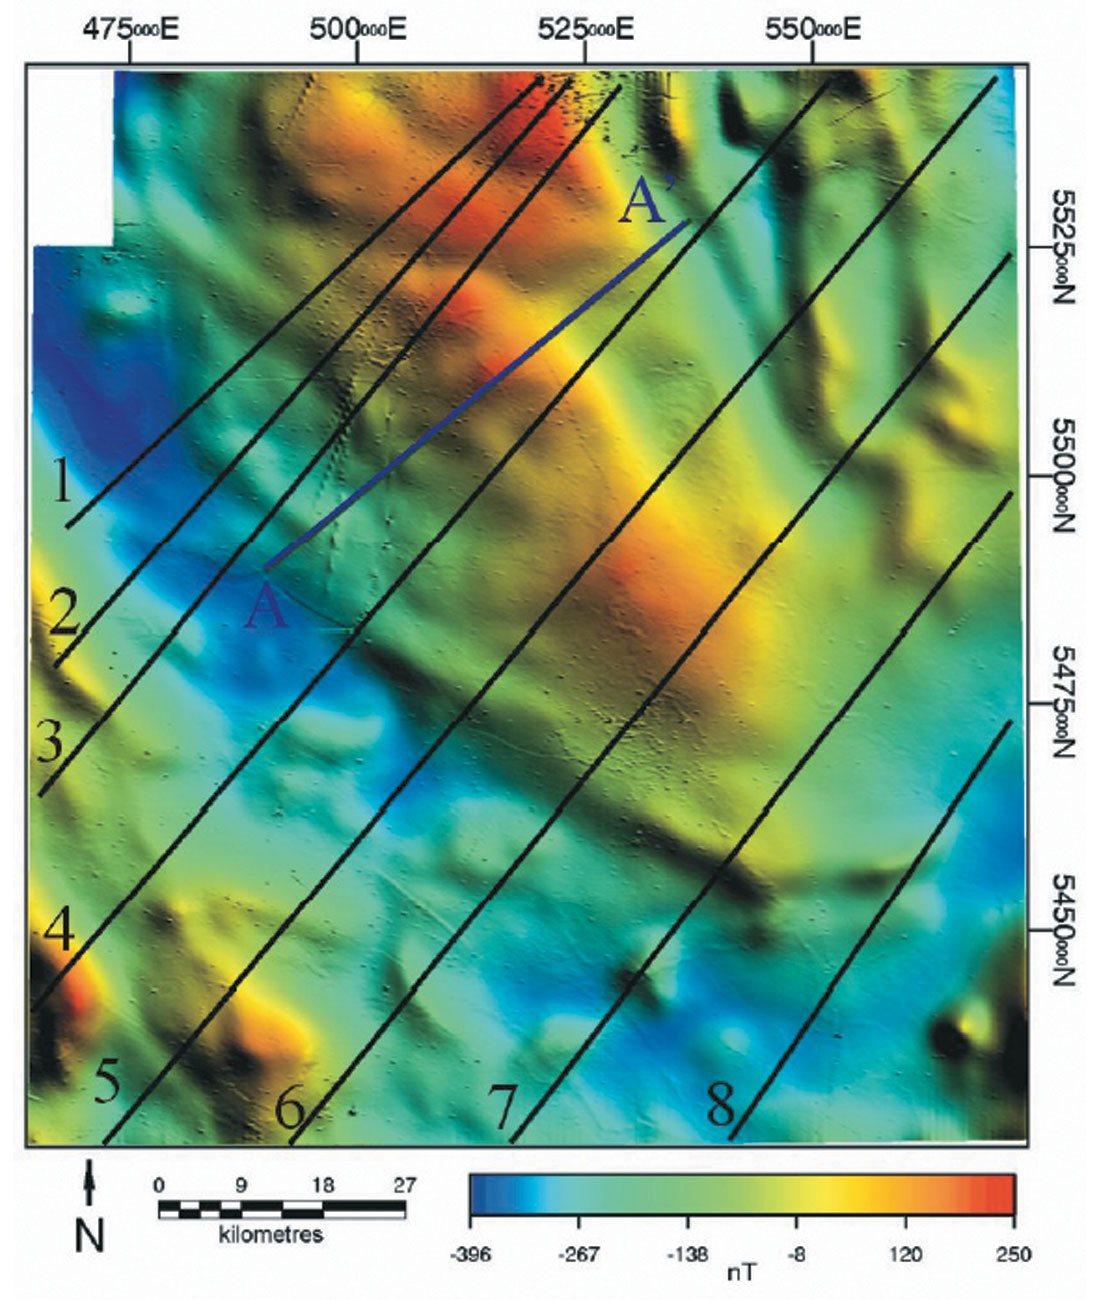
The most striking feature is a NW-SE trend, which has been described by a number of researchers (Leblanc and Morris, 1999; Lemieux et al., 2000; Pilkington et al., 2000; Ross and Eaton, 1999; Ross et al., 1994) as being primarily indicative of granitic basement sources, buried about 1.7 to 2.2 km under sedimentary cover rocks in the study area. In addition to this dominating fabric, a number of other magnetic textures characteristic of certain features in the study area were identified by Leblanc and Morris (1999). However, no attempts have been made to model the depth of the top of the magnetic sources before this study.
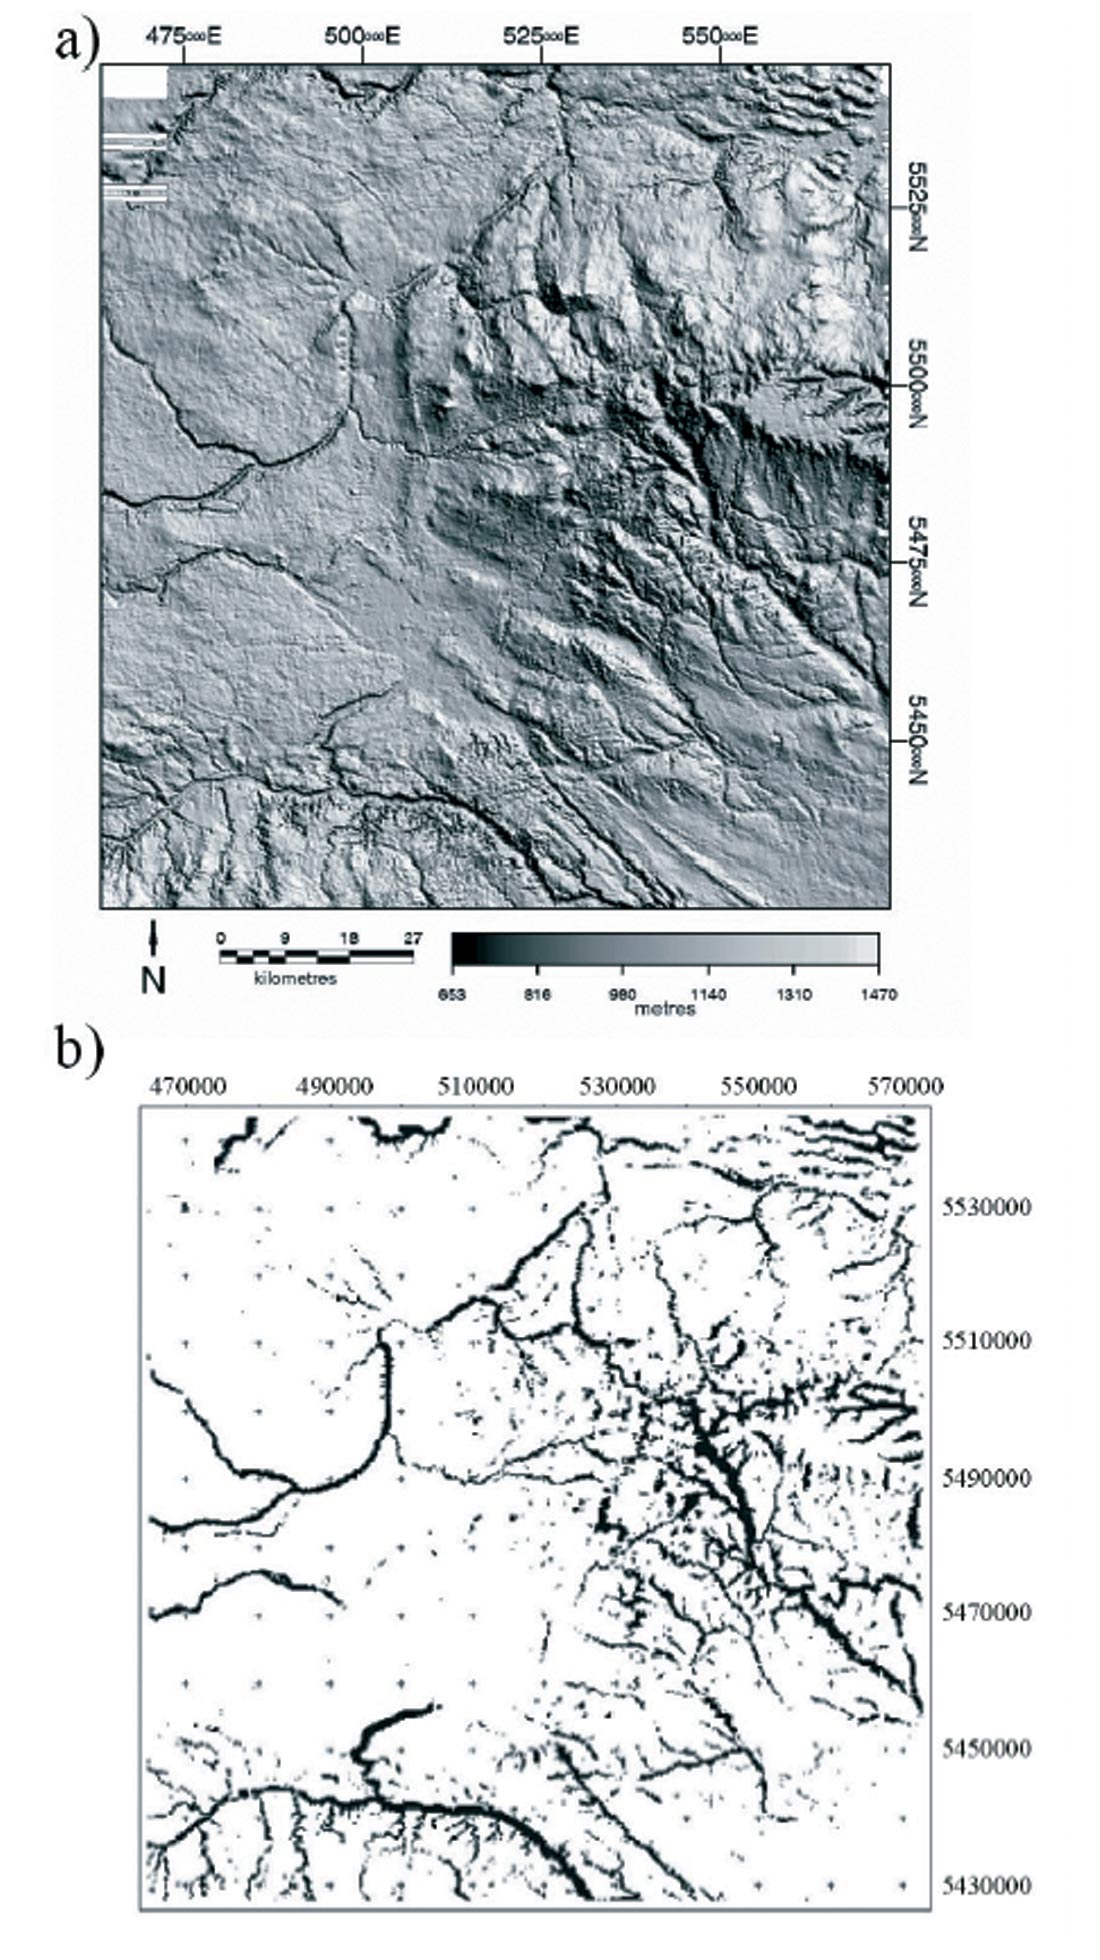
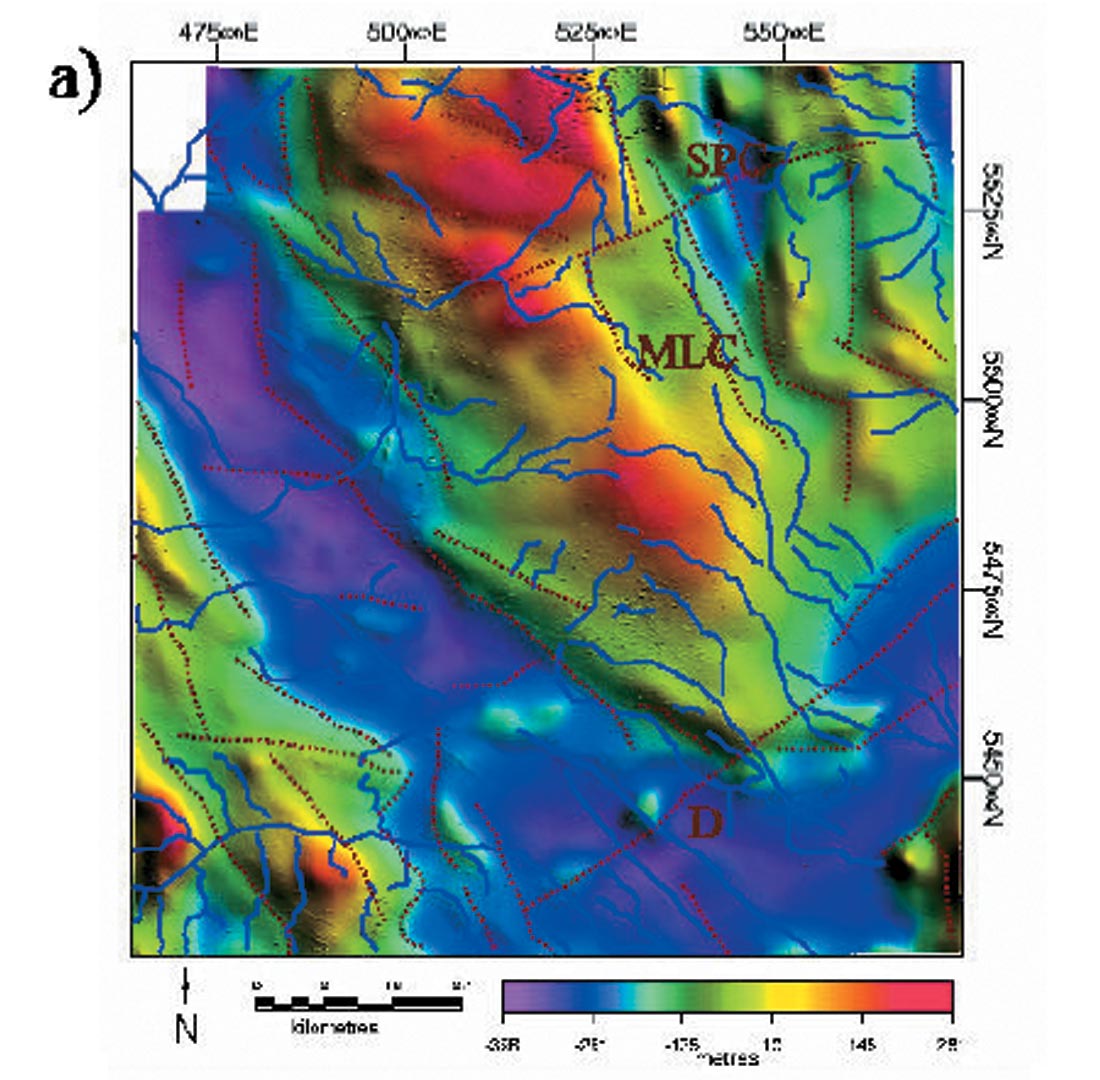
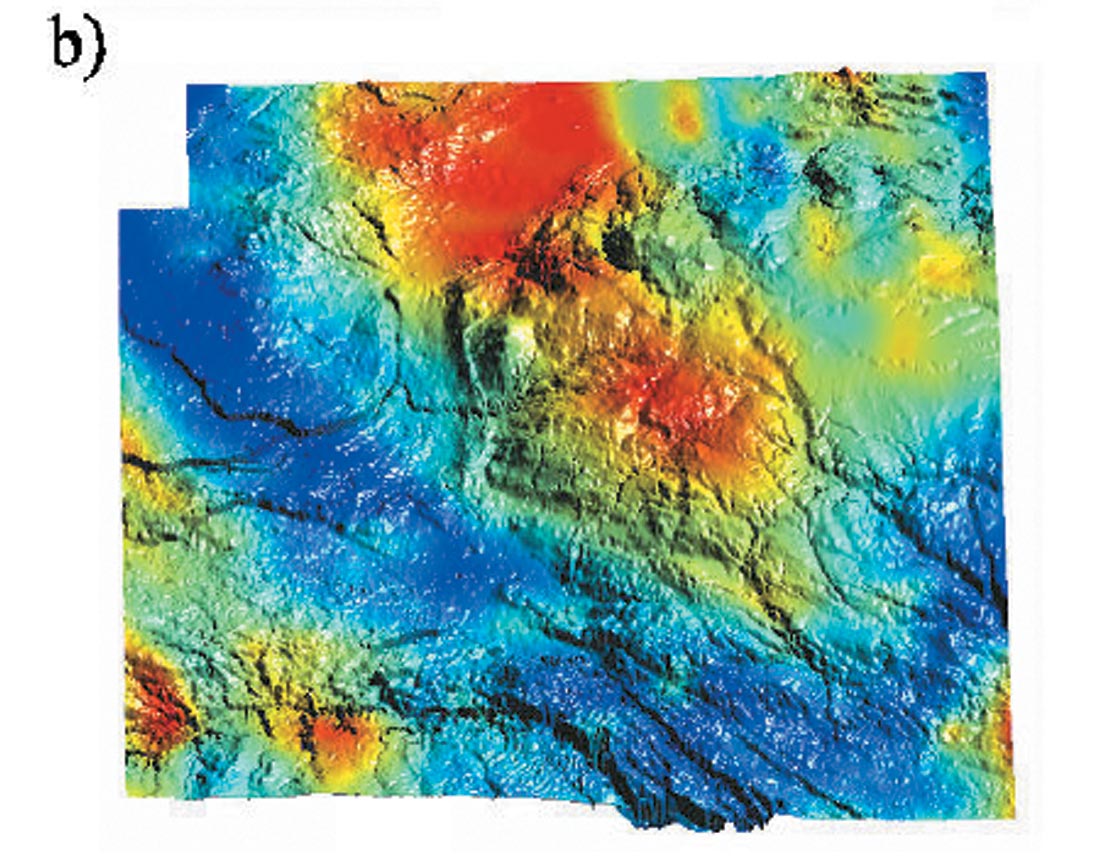
From the same airborne survey, elevation information was acquired by subtracting the radar altimeter data from the differential GPS elevation (Figure 3a; Markham, 2001). A regional topographic image of 100 x 100 km was created and used to identify surface lineaments. Lineaments were mapped semi-automatically by means of subtracting a low-passed version of topography from the raw topography (Figure 3b), and then manually by digitizing the main features (Figure 4a).
Both datasets were integrated as a shaded relief image (Figure 4b). This image shows a strong correlation between the magnetic data (colour) and the topography (relief).
Modelling results
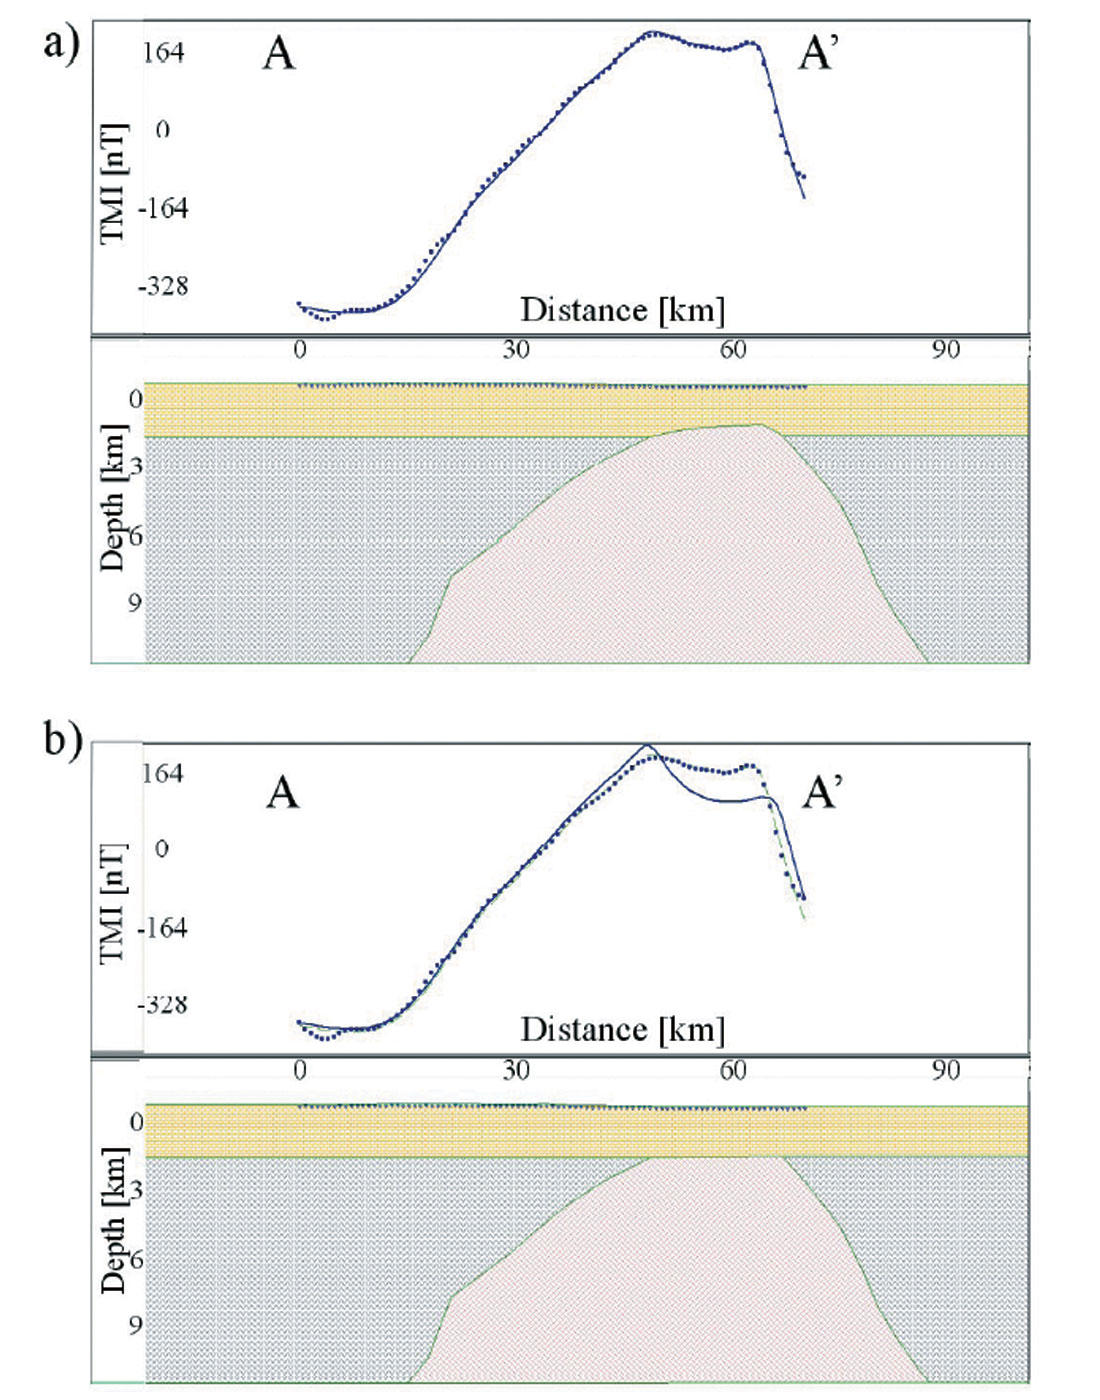
Figure 5 shows a model across the centre of the main magnetic anomaly (section AA’, see Figure 2 for location) of two different situations that resemble what is observed here: the first one shows uplifted basement with a thick sedimentary package on top. The model fits the data in great detail (Figure 5a). The second model shows a uniform sedimentary package above an eroded basement. The assumption of no basement uplift leads to a poor fit (Figure 5b). This simple model comparison provides direct evidence in support of basement reactivation.
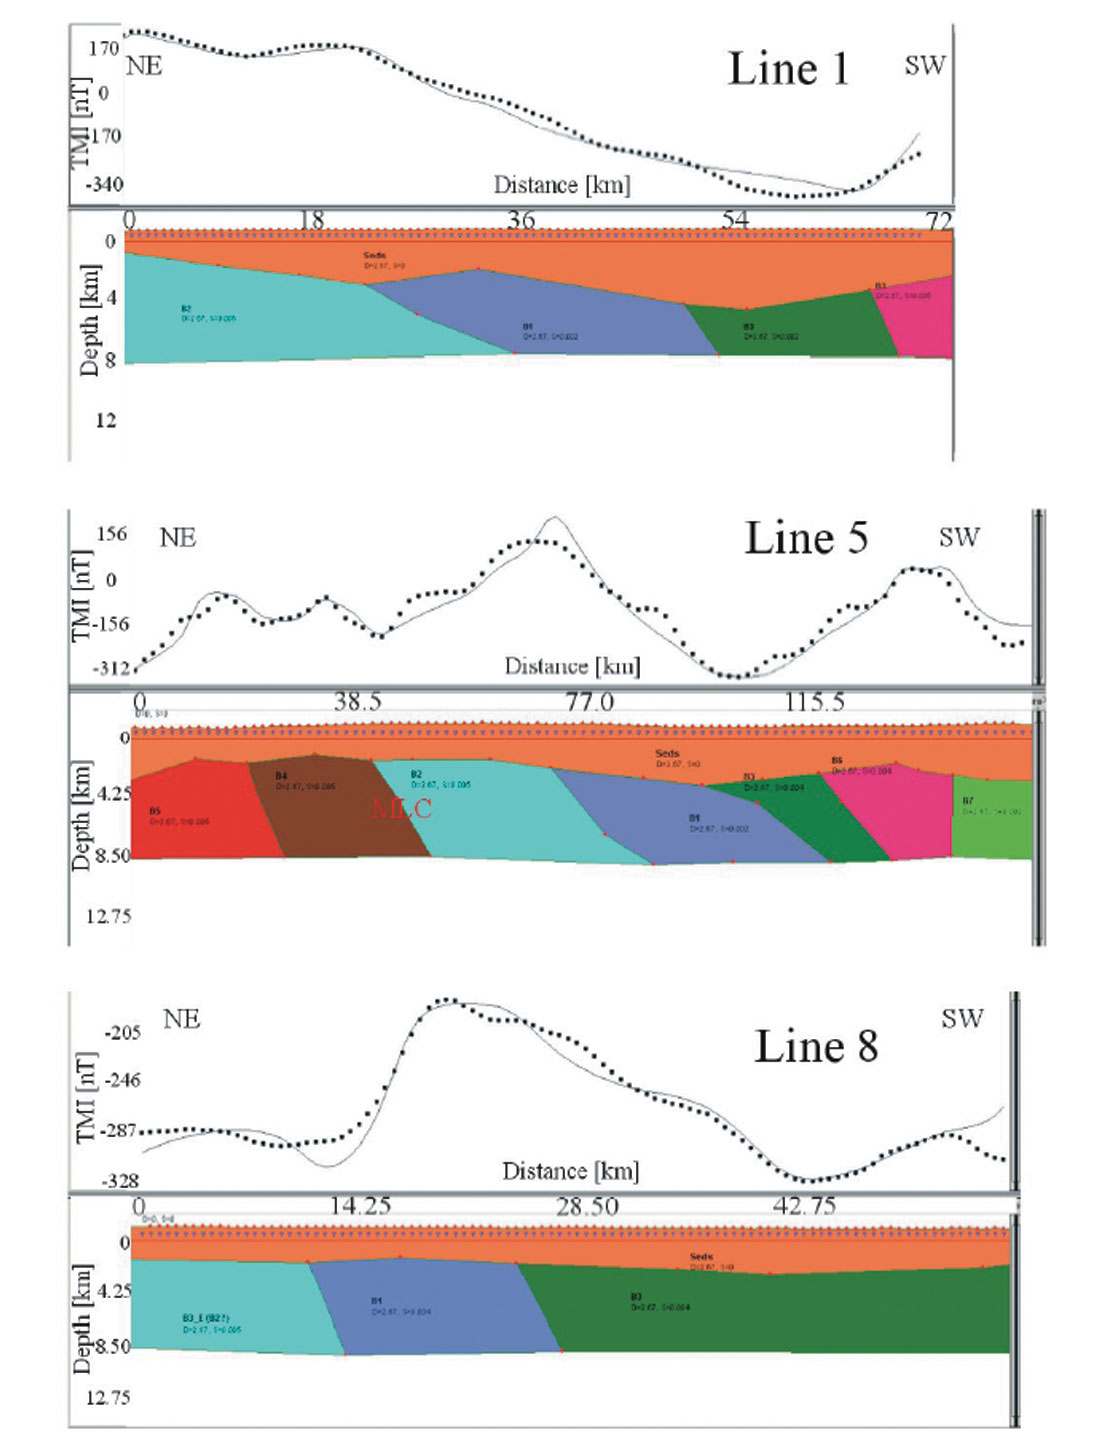
Using the same reasoning, we subsequently computed 2.5D magnetic models on 8 NW-SE sub-parallel profiles; each profile is perpendicular to the trend of the proposed fault structures (profiles 1-8 on Figure 2). As in the test model (Figure 5a), the sedimentary package overlaying the crystalline basement was treated as one uniform unit with no magnetic susceptibility (k=0.0 SI). That is, the magnetic sources were entirely attributed to the crystalline basement (Archean granitic gneisses of the Medicine Hat Block). Lateral variations in magnetization along the profiles were interpreted as lateral magnetization variations within the basement (Figure 6). The contact locations of the basement blocks were estimated from the gradient of the TMI profiles and also from the structural mapping done on the TMI map (Figure 4a). The purpose of these models was to determine the structure of the basement on a regional scale; therefore high-frequency anomalies which might be attributed to minor topographic variations of the sediment basement interface, or localised near surface magnetic property variations within the sedimentary sequence w e re not modelled. Any of these structures that correlate with surficial topographic features implies a reactivation of an older structure.
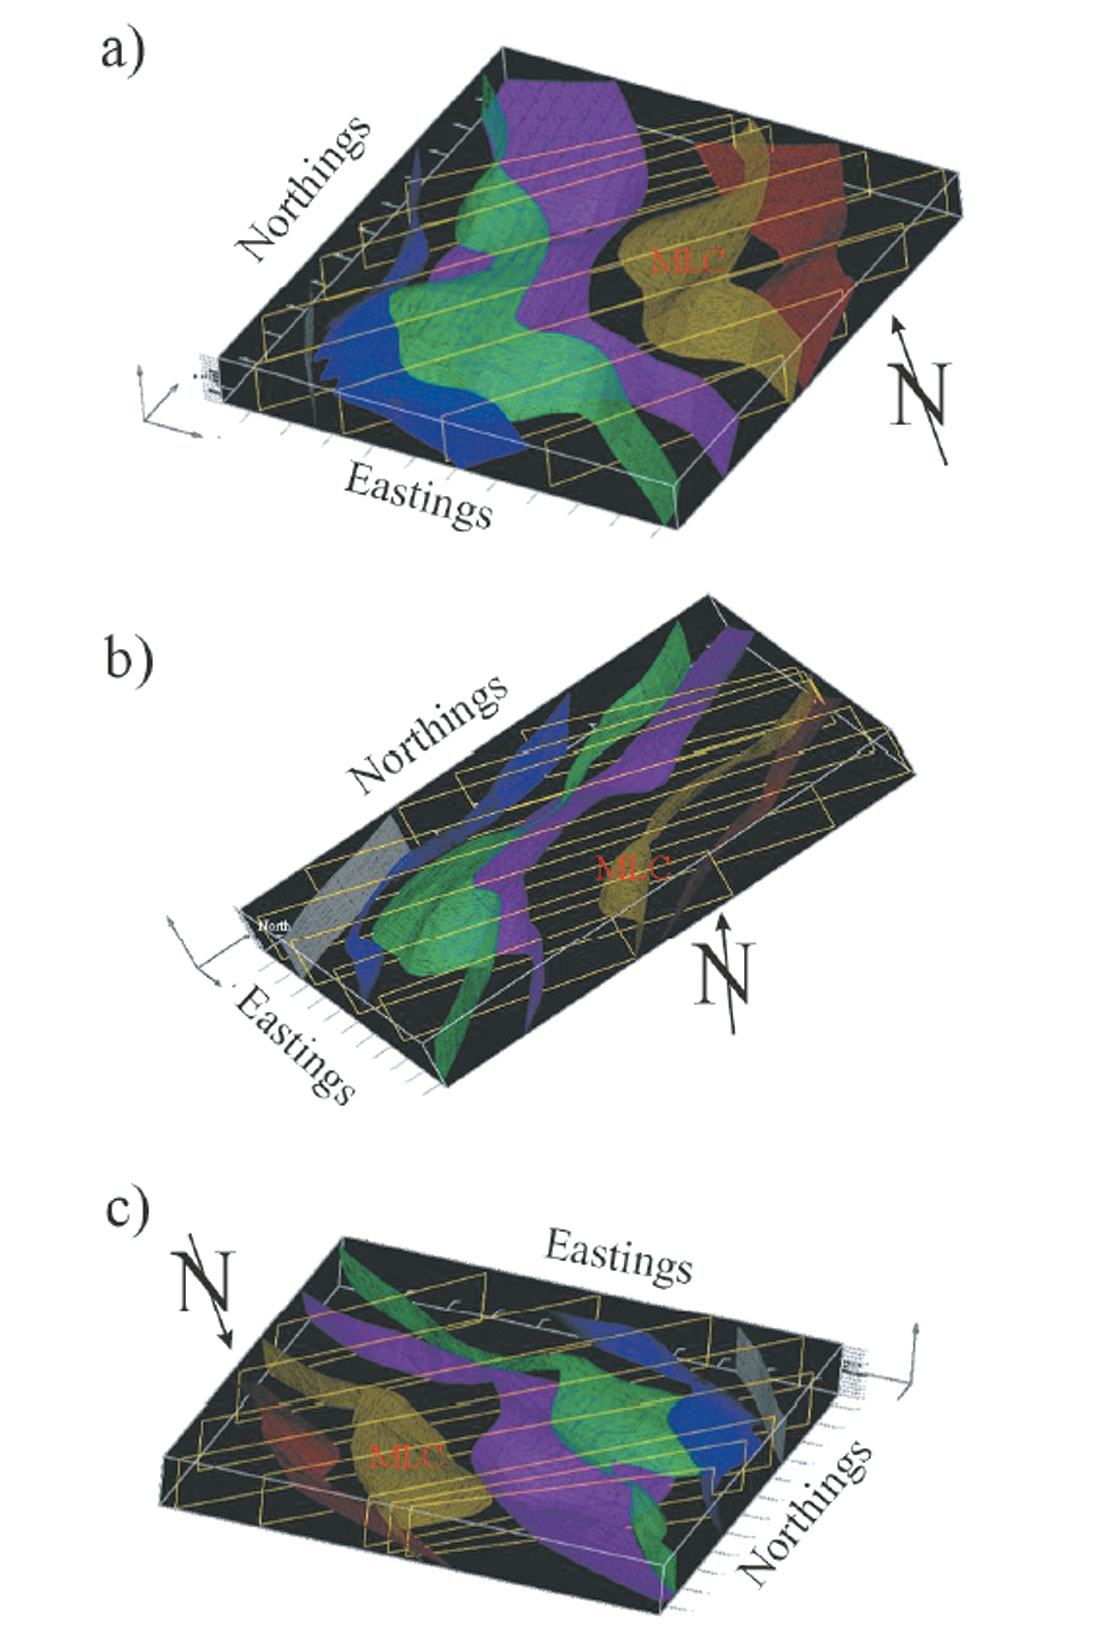
Finally we computed a 3D model that integrates the eight 2.5D sections in 3D. A 3D solid model of all the geological formations was constructed using Voronoi diagrams (Calcagno et al., 2006). Starting from a generated set of points issued from the data, this method computed a partition of space according to the nearest neighbour. The constructed solids are topologically closed and share common boundaries. Since the construction of the solid is automatic, the proposed solution allows iteration of the interpretation and model construction process until the model is deemed satisfactory. The 3D geological model (Figure 7) shows the geometry of the sediments and the mapped structures. The modeled faults show a consistent plunge to the east, which fits the regional basement structure, as observed by Burwash et. al (1994) and Lemieux et al. (2000).
Discussion and Conclusions
The lineaments identified from the TMI exhibit good correlation with the topographic image (see figure 4a for location). In particular, the one identified as Medicine Lodge Coulee (MLC), running northwest-southeast has both a topographic signal and a magnetic signature, as does the northeast-southwest trending lineament crossing the MLC (located south of the Seven Persons Creek, thus named SPC). The SPC lineament shows a subtle topographic signature. Another topographic lineament running sub-parallel to this feature is visible to the south (about 10 km south of the SPC, with similar orientation and shape). This lineament (D on Figure 4a) runs sub-parallel to the preglacial divide and also has a distinct relationship with topography (an approximate 1 km wide, 40 m deep feature). Note also that the river channels are generally oriented either northwest-southeast or northeast-southwest. As expected due to the different properties being mapped, not all the lineaments identified from the magnetic data are associated with a topographic feature, nor do all the topographic lineaments have a magnetic signature.
However, one of the most important features, the MLC lineament, was seen by both the 2.5D and 3D models.
All topographic features result from a wide range of environmental processes acting on different spatial and time scales. The more surficial ones, rivers, tend to flow along a path of least resistance. In the absence of fault influence the flat lying sedimentary strata of the study should produce denditric drainage patterns as seen in the channel tributaries. The large river systems (Milk River, Four Mile Coulee, Etzikom Coulee) run through deep, wide canyons (up to 5 km wide, 200 m deep). Many parts of these channels are oriented northwest-southeast and make up the topographic lineaments that correlate with the dominant magnetic fabric. The spatial extent of these channels and their orientation suggest that they might be controlled by subsurface faults.
The alignment of dominant surficial features (defined by topography) with basement fabric (defined by magnetics) in southern Alberta seems to support the evidence from Lemieux (1999) for basement control in the area, although the main length of the Southern Alberta Lithoprobe Transect (SALT) lines on that study are located west of the area of this study. Using seismic and potential field data (Lemieux et al., 2000) propose a crustal structural model for the Medicine Hat Block which comprises extensional crustal-scale ramps dipping to the west, which corroborate the main results of this work (Figure 7) and the regional basement structure by Burwash et al., 1994 (Figure 8).
Further control (well logs, petrophysical control, stratigraphic records or detailed seismic data) is needed to unequivocally relate the lineaments observed in topography with magnetic lineaments and faults in sedimentary strata. However, the current 3D model presents sufficient evidence for the relationship between surficial features with basement structures.


Join the Conversation
Interested in starting, or contributing to a conversation about an article or issue of the RECORDER? Join our CSEG LinkedIn Group.
Share This Article