The uniaxial compressive strength (UCS) is one of the most important geotechnical properties of rock and it has been widely used in geological and geo-mechanical engineering projects. In this study, UCS and other basic physical properties of 165 basalt samples at 55 different depths along zone of interest (ZOI) from MH-2B borehole were determined. We obtain a few strong correlations with relative high regression factors among sonic velocity and physical parameters. Empirical equations were then developed to predict the UCS, Young’s modulus, Poisson’s ratio, and density from the ultrasonic wave speeds. In order to validate the proposed correlations, we still need to perform a detail statistical analysis, such as ‘t’ and ‘F’ test.
Introduction
The uniaxial compressive strength (UCS) is perhaps the simplest measure of the compressive strength of rock. It is determined by simply applying an increasing compressive stress σ parallel to the axis of a cylindrical core sample until it fails catastrophically. Often, the axial and radial strains are measured at the same time and these allow for estimation of Young’s modulus E and Poisson’s ratio ν under pseudo-static loading. If the sample allows, one can also measure the angle of failure which can then be related to the material’s internal friction. Engineers use UCS in the planning and design of all kinds drilling and production projects for hydrocarbon and geothermal energy production and for greenhouse gas geological sequestration. Geoscientists use UCS to constrain stress magnitudes based on borehole breakout analysis.
However, obtaining the UCS values directly requires access to core. Core is often not available especially in hydrocarbon exploration that has placed a heavy emphasis on log evaluation in lieu of having actual material. As such, workers often assumed that the UCS can be estimated from proxy measures of sonic wave speeds (Horsrud 2001, Chang, Zoback, and Khaksar 2006) based on simply cross-plotting of parameters and curve fitting to produce an empirical correlation formula. The advantage of this approach is that one can then presumably employ sonic log measures of wave speed to predict UCS along the borehole. The disadvantage is that the UCS curve should be developed locally. One potential problem is that due to additional costs many operators are not carrying out proper due diligence and are assuming that published curves adequately describe the UCS parameters. Indeed, the authors have heard of cases where workers have preferred to use sonic log based values of UCS over actual careful laboratory measurements!
There are numerous correlations that have been proposed in the literature for this purpose, and each of them has been developed in a specific formation or a specific rock type, so that as just noted they strictly should not be directly applied in other regions. Hence, a correlation between sonic velocity, UCS and other physical properties in our pilot well needs to be developed, in order to provide correct information for future exploration in the same or close by areas. In this paper, a large number of ultrasonic pulse velocity (UPV) tests were conducted on a variety of selections of basalt samples from the MH-2B borehole near Mountain Home, Idaho, in conjunction with measurement of other rock physical and mechanical properties including density, porosity, UCS, Air permeability, Young’s modulus and Poisson’s ratio. We are applying these data to constrain the stress magnitudes at this site. Such studies have become increasingly important at the MH-2B borehole because this scientific drilling project serendipitously reached temperatures in excess of 130° C and as such became a potential commercial geothermal site (Shervais et al. 2014).
Background and Sample Collection
A research program called HOTSPOT, funded primarily by the U.S. Dept. of Energy and the International Continental Drilling Program (ICDP), was organized by a team of scientists to drill three different sites in the Snake River Plain of Idaho in order to obtained data to better understand the geothermal energy potential as well as carry out more fundamental scientific investigations of that igneous province. All three boreholes reached depths of about 1900m with high core recovery using standard wireline coring techniques. High temperatures as well as substantial artesian flow rates were discovered in the Mountain Home well MH-2B and this necessitated further investigations to better assess the energy potential. We performed detailed geophysical analysis during drilling, such as high-resolution shallow surface and vertical seismic profile (Liberty et al. 2015), extensive borehole geophysical logging (Schmitt et al. 2012) and numerous laboratory tests with core samples.
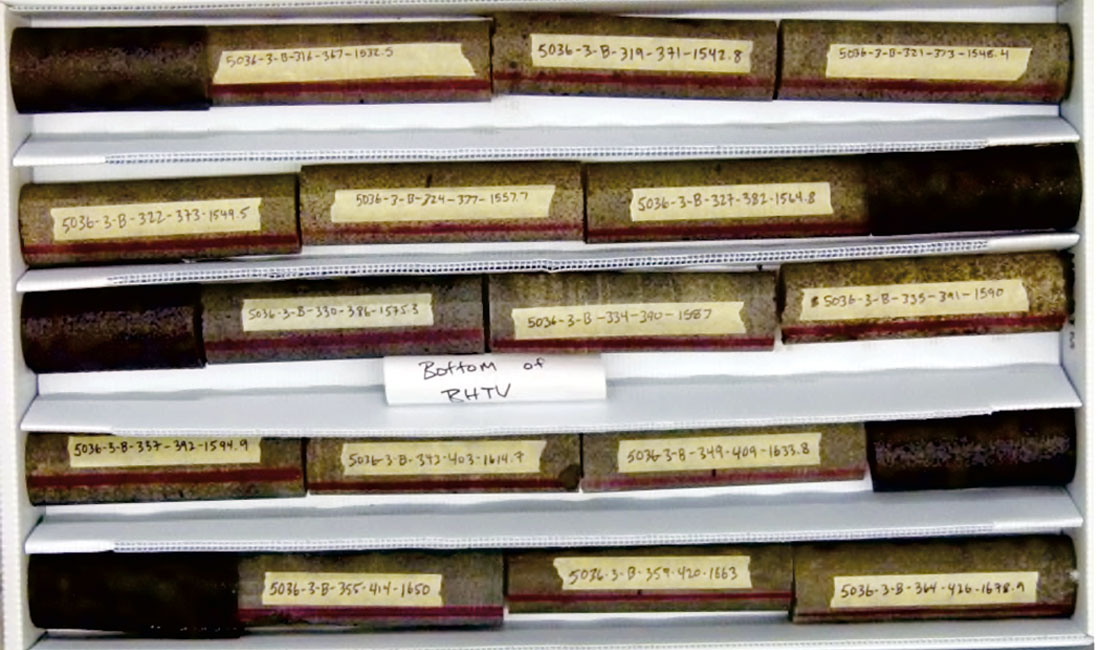
The MH-2 borehole was drilled in the western Snake River Plain (SRP) and was cored between June 2011 and February 2012 on the Mountain Home Air Force Base outside Mountain Home, Idaho (Armstrong et al. 2013). Whole-rock core was recovered from the entire depth of the borehole with greater than 90% recovery. For our experimental purpose, we collected 165 core samples over the zone of interest (ZOI, from 1,280m (~4,200 ft) to the total depth (TD) of 1,821 m (5,976) ft) at 55 different depth locations (Figure 1). Three samples were collected at each selected depth in order to determine the reproducibility of the test results.
Methodology
Ultrasonic Pulse Velocity Measurements
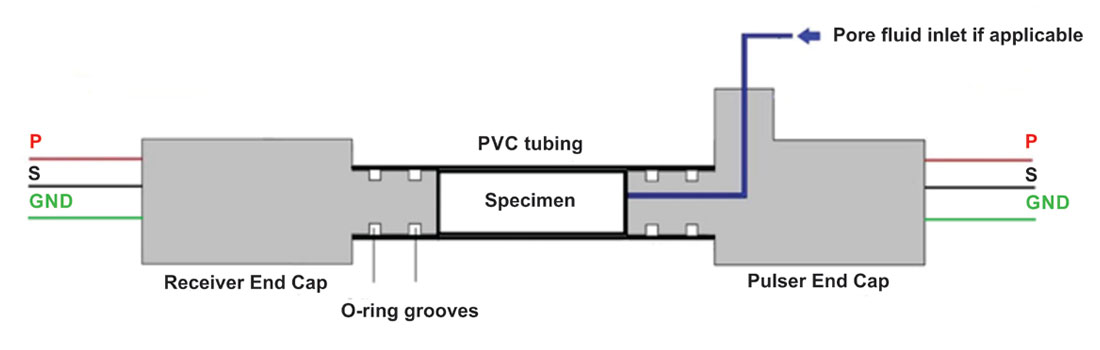
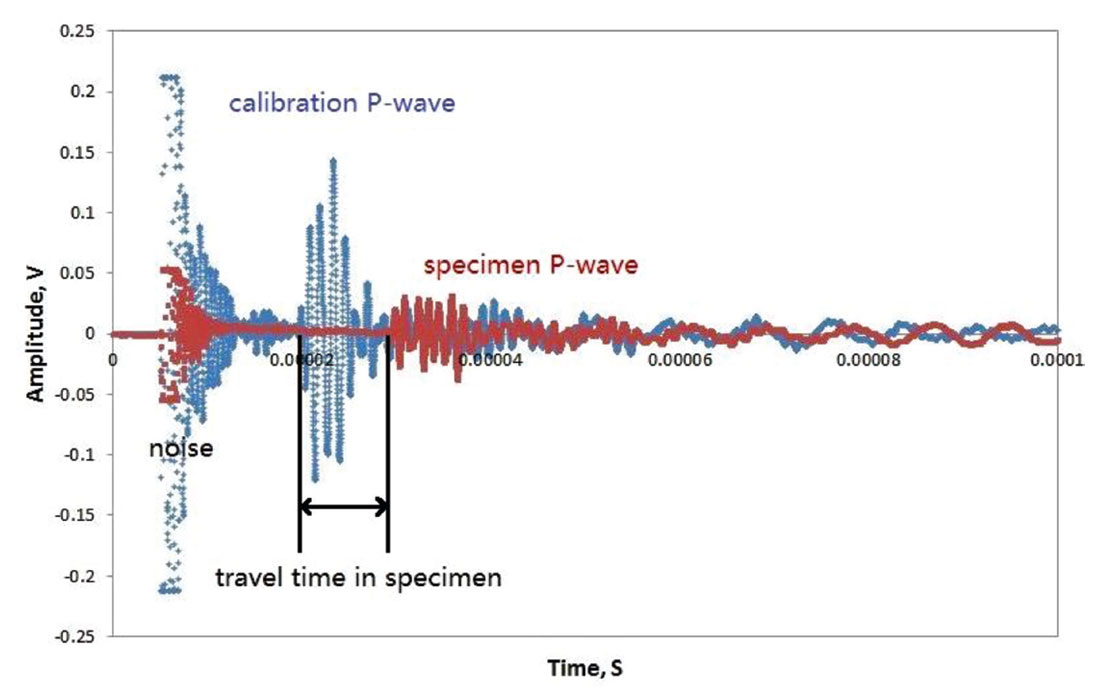
In the UPV measurement, a core sample is placed between a pair of piezoelectric ceramic transducers. The transmitting transducer is excited by application of a fast-rising (5 ns) high voltage step that generates an elastic wave that propagates through the specimen to be recorded by the receiving transducer (Figure 2). This is the conventional ‘time-of-flight’ ultrasonic measurement technique that is well known in the literature. A recent description of our ultrasonic methodologies including calibration procedures may be found, for example, in (Martínez and Schmitt 2013, Njiekak et al. 2013). Briefly, however, the transit time through the rock core sample held at a given hydrostatic confining pressure is simply the difference between the calibrated transit time through the end-caps and the total transit time through the end-caps with the sample sandwiched between them. The wave speed is then the simple ratio between the measured sample length and this transit time (Figure 3).
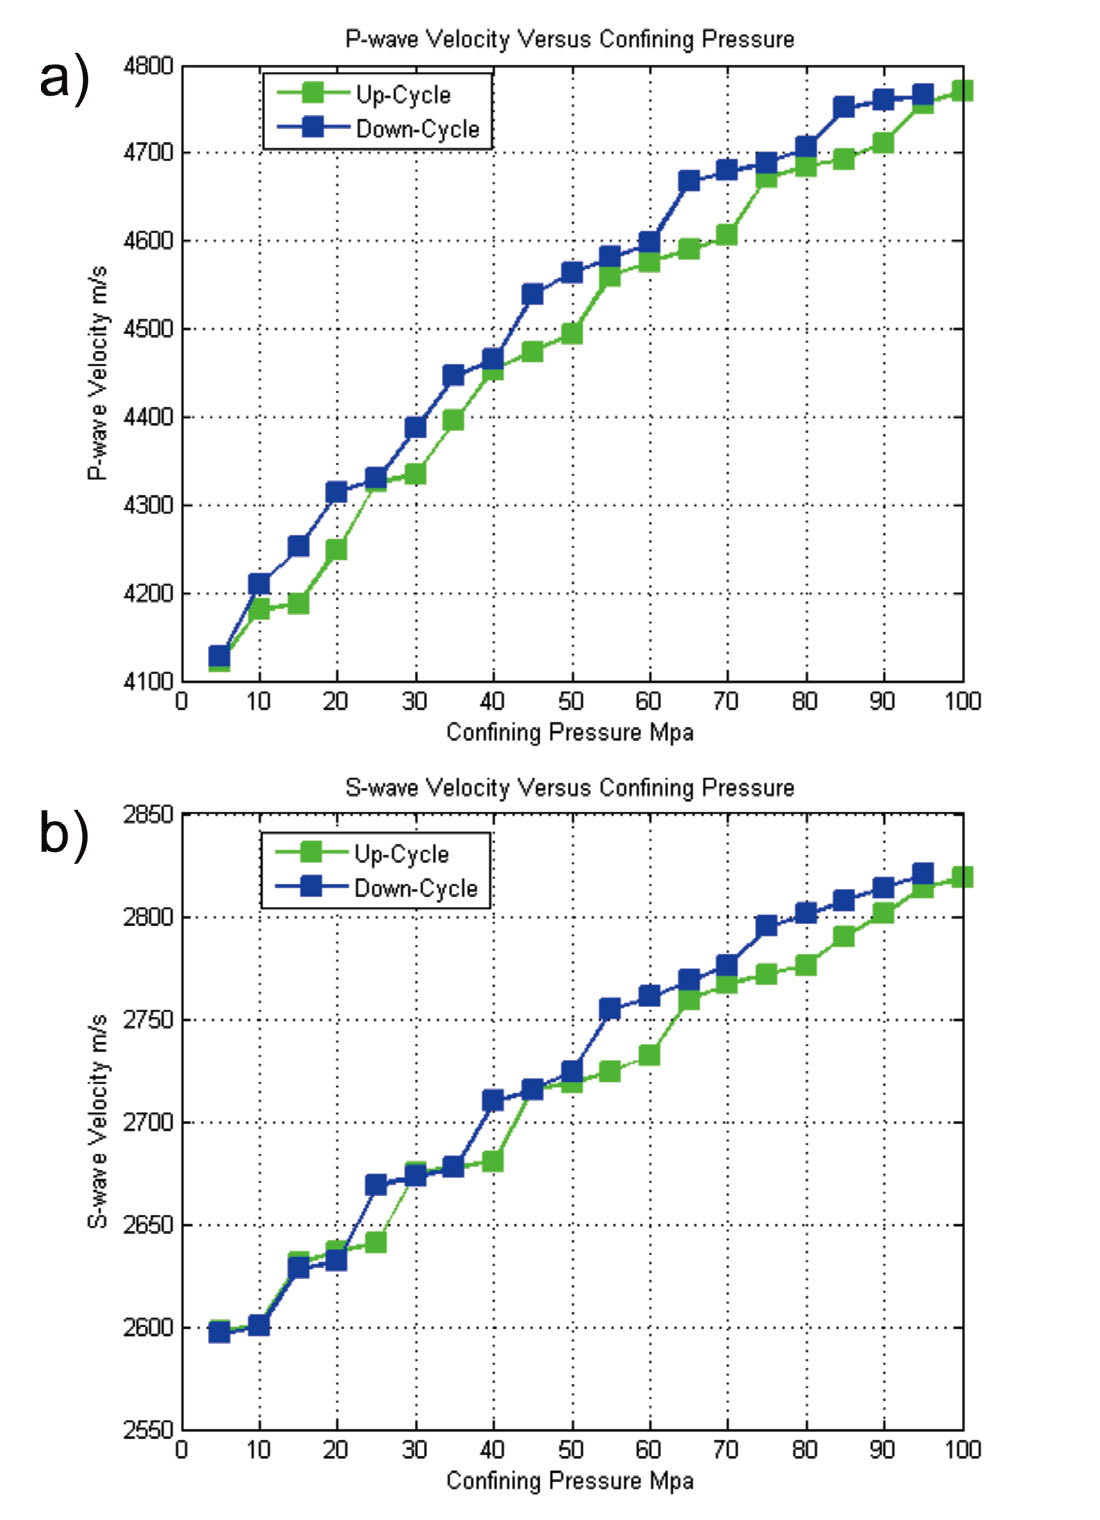
In general, velocity rises with increasing confining pressure, and this effect is probably due to pores/cracks closure and hence increases the density. For example, for the sample MH-233-4250.75-C with 8.22% porosity, the P- and S-wave velocities changed much faster and dramatically while at low confining pressure. This is because at low effective pressure, cracks are open and easily closed with an increase in pressure (Figure 4). Both P- and S-wave speeds were measured, but only P-wave velocities as measured at 50 MPa of hydrostatic confining pressure are provided in this preliminary report.
Uniaxial compressive strength (UCS) test
The uniaxial compressive strength, or UCS, test is a destructive technique for determining the uniaxial compressive strength of intact rock core specimens. In rock mechanics and engineering geology, the UCS test and Brazilian test (providing tensile strength) are considered to be the most widely used methods to obtain rock strength properties. Uniaxial compressive strength values (σf) were calculated using the following simple formula:

where Ff is the force applied by the hydraulic cylinder to the sample at the time of catastrophic failure, A is the area of the ends of the sample, and σf is uniaxial compressive stress at failure that is equal to the UCS. Under the assumption that the material is isotropic one can also determine the Young’s modulus E.

and Poisson’s ratio ν

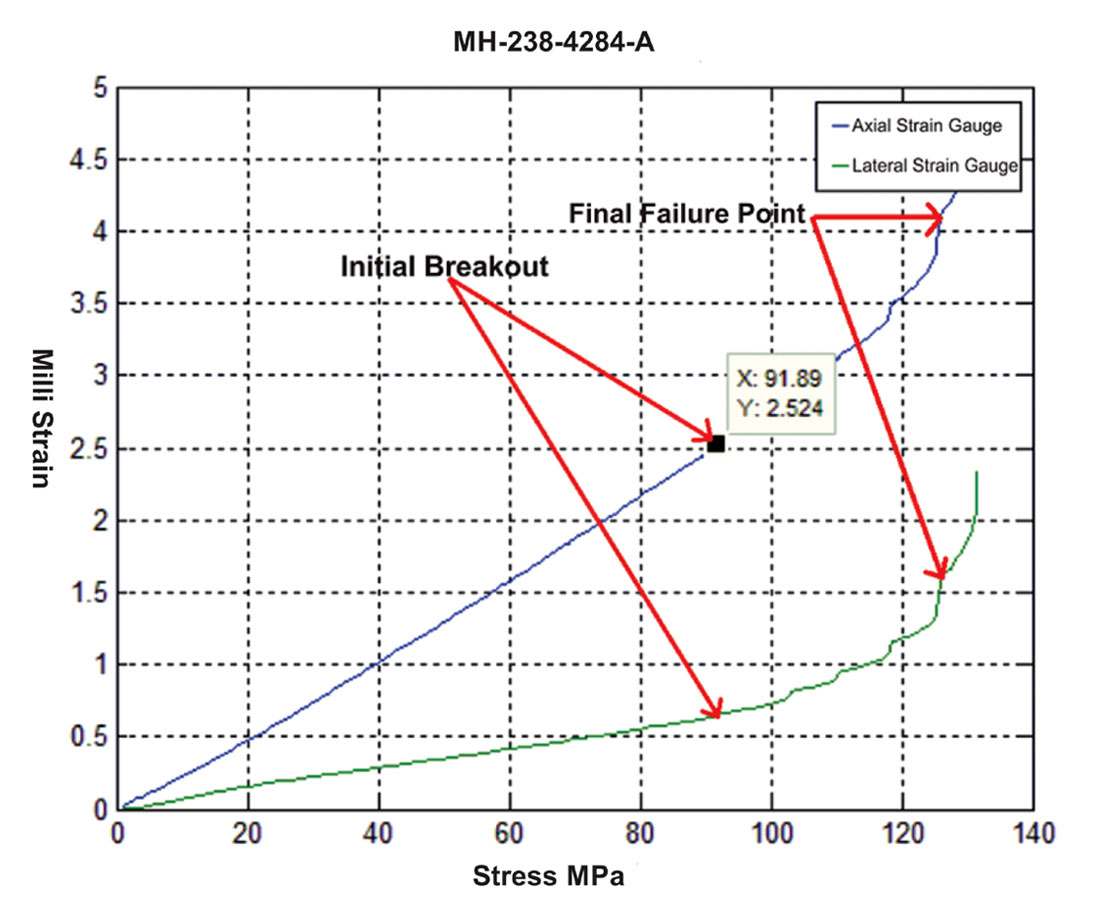
where εaxial and εradial are provided by the strain gauges mounted parallel and perpendicular to the cylindrical sample’s axis, respectively (Figure 5).
Sample Preparations and Test Procedures
In this study, the selected samples were cylindrical with a similar dimension of 1.85 inch diameter and 2 inch height. The two ends of the cylinder were precision ground to be parallel to better than 100 μm (~0.004 in) parallel between the two ends. Before the UCS test, each sample was measured for dry bulk density, grain density, and pneumatic permeability. Dry bulk density was determined by measuring the dimensions of the sample with high precision calipers and its mass with a high precision scale. Grain density was measured using a He pycnometer. Due to the low matrix porosity and low matrix permeability the values for both dry bulk density and grain density are considered overestimates due to disconnected and isolated pore space within the sample. All of the rock samples were fitted with strain gauges aligned parallel and perpendicular to the cylindrical sample’s axis. The strains measured from these provided quasi-static measures of both Young’s modulus E and Poisson’s ratio ν.
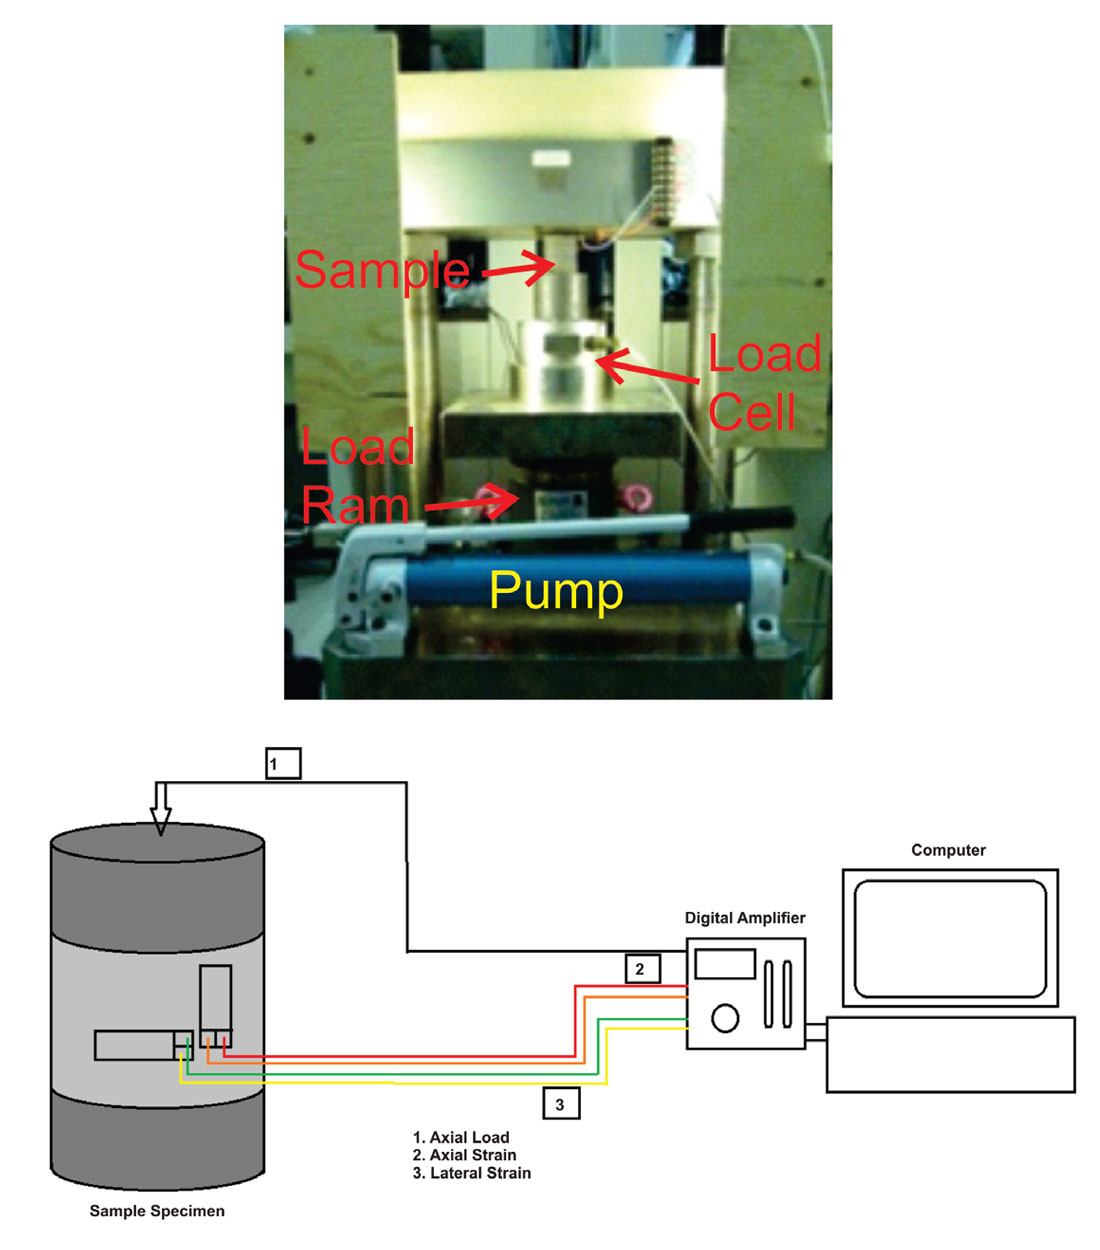
Prior to the UCS tests, the samples were kept under vacuum at temperatures of about 70° C for 24 hours in order to remove any free remaining water in the pore space. Upon removal and cooling to room temperature, the samples were centered in the uniaxial press and the strain gauges were wired for digital strain recording. The experimental setup consists of horizontal and parallel upper and lower platens, a hydraulic cylinder connected to a hand pump, a lower riser, and a load cell, (Figure 6). The uniaxial load was applied through a hand pump that moved the hydraulic forcing cylinder. A continuously increasing load was applied to the sample until it reached failure. Measured outputs include the load as given the load cell, the pressure within the hydraulic loading cylinder, the power source excitation voltage, and the variations in voltage from the axial and lateral strain gauges. A video record of each experiment was also made in order to better examine the progress to failure and to observe the failure plane angles prior to catastrophic rupture of the sample. All data was stored in the recording computer for further analysis.
Preliminary Results
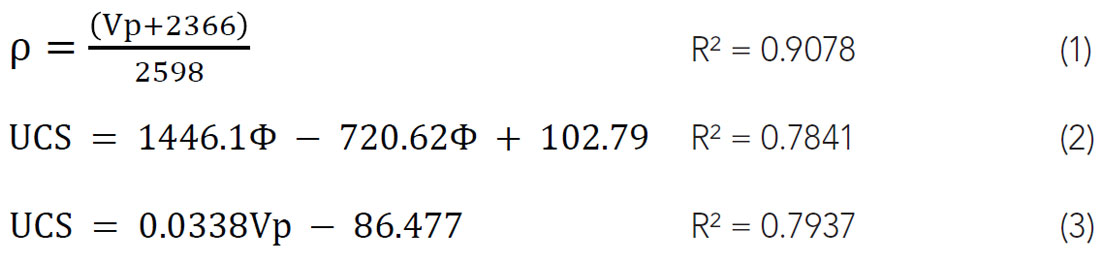
In this section we provide some of our preliminary correlation functions between a number of the measured petrophysical properties, the P-wave speeds, and the UCS. As the data analysis is still in progress, these results represent only about 30% of the complete data set obtained. The equation of best fit line with the values of 95% confidence and correlation coefficient R were determined for each test results. It can be seen from Fig.7a, there is a linear relationship between P-wave velocity and bulk density for all samples, with a strong correlation R = 0.9078.
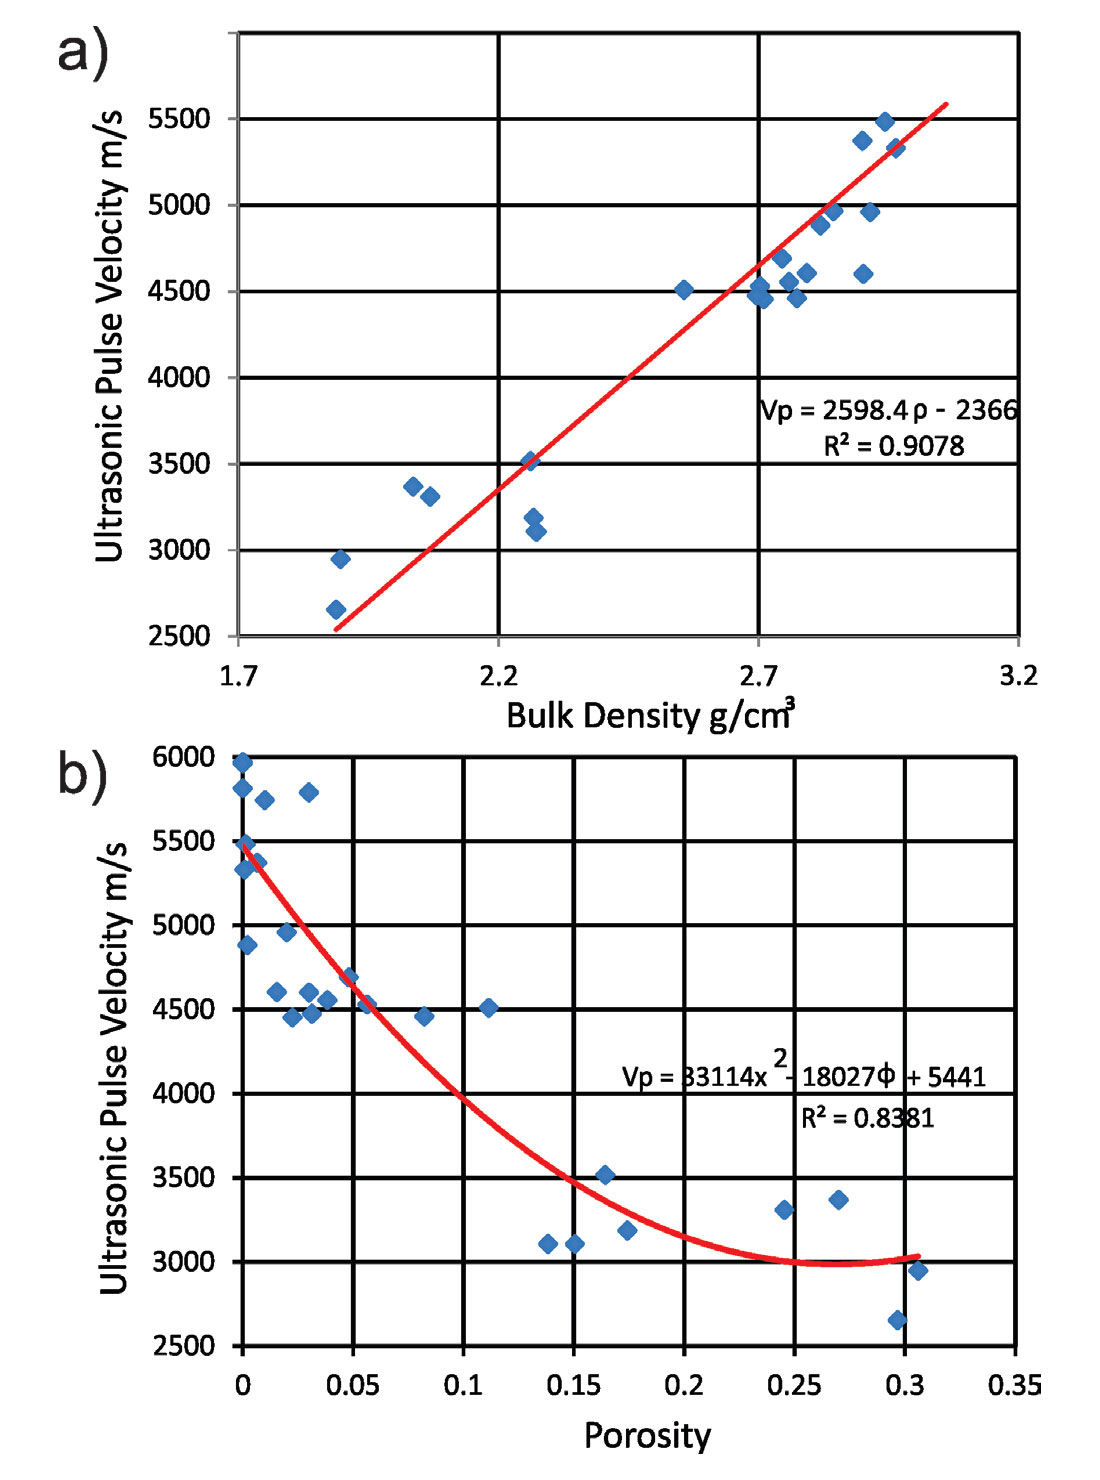
As we noticed, the effective porosity is a control factor of rock strength while we were doing the UCS measurements, most of the sample with relatively high porosity tend to break at very early stage of test with extremely low strength. On the other hand, all strong solid sample nearly all associate with extremely low or no porosity. Hence, we tried to correlate porosity with both ultrasonic velocity and uniaxial compressive strength. As shown in Figure 8b, the porosity and UCS has a good correlation with regression factor R = 0.7841, and also in Figure 7b, the porosity and P-wave velocity has even better correlation of R = 0.8381. This good news encouraged us to try to link UCS to UPV results using porosity as a media parameter.
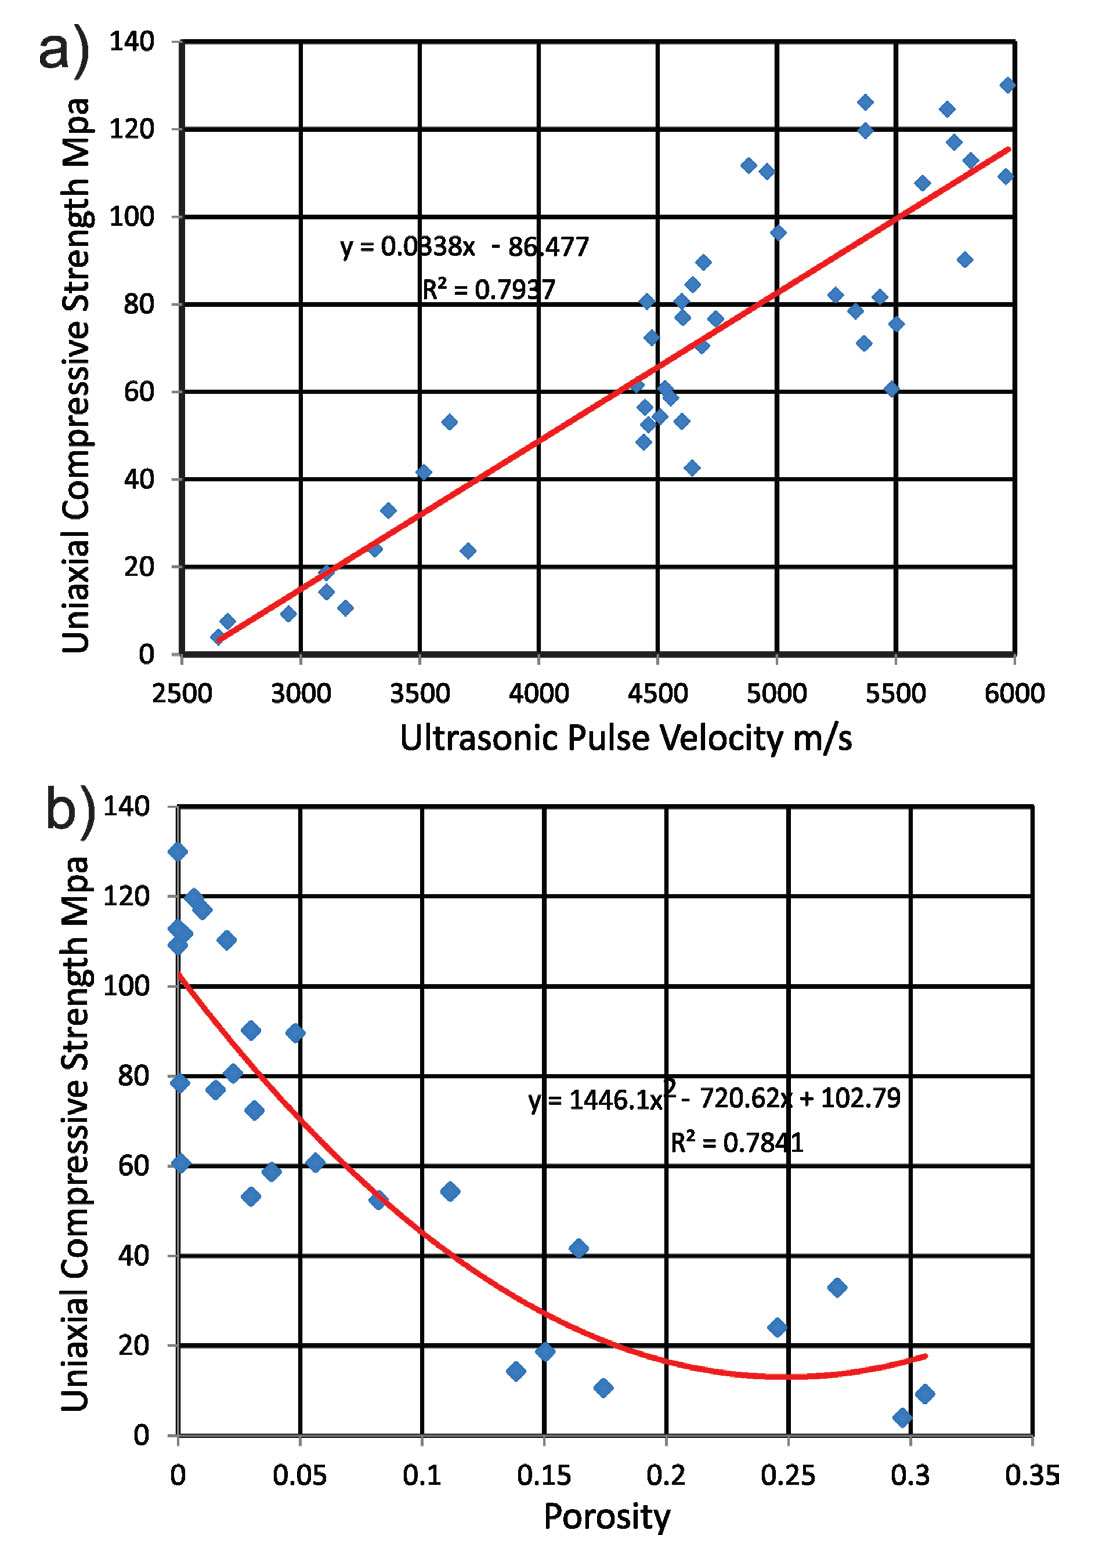
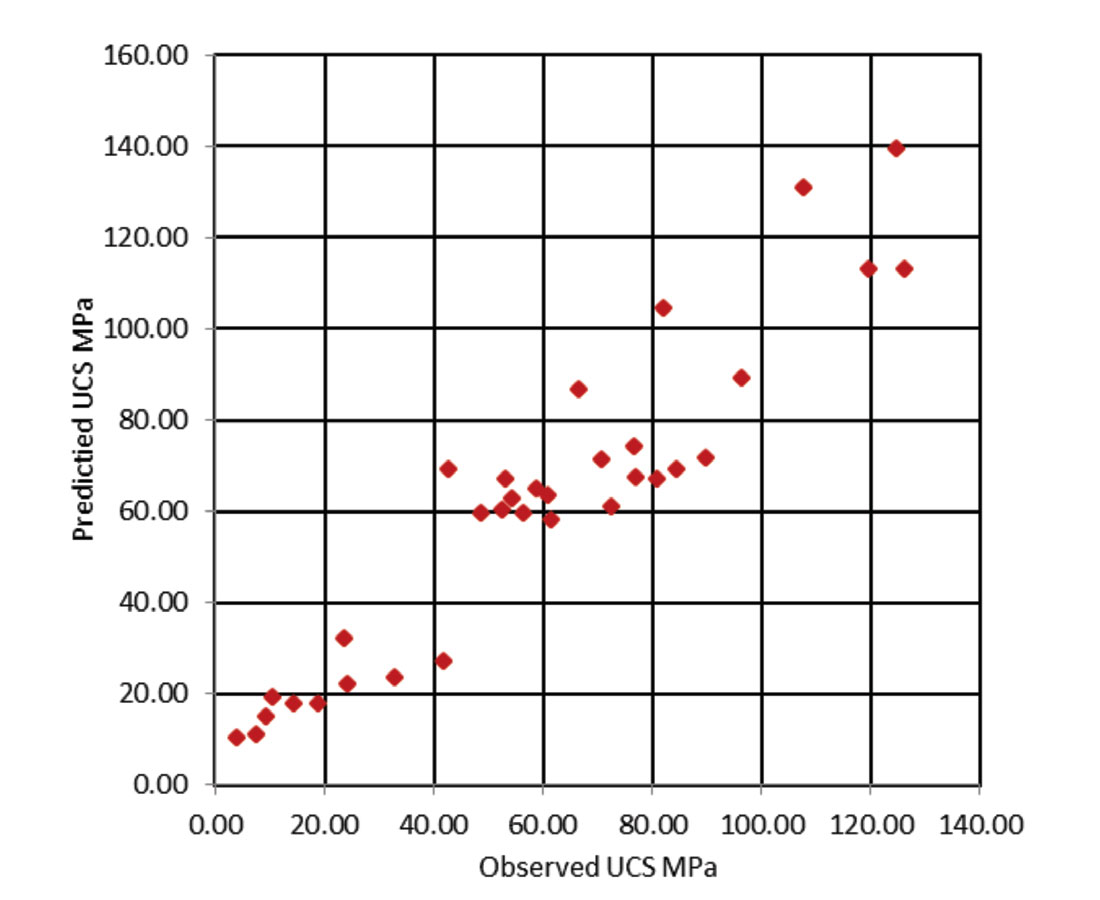
In Figure 8a, we plot P-wave velocity as a function of uniaxial compressive strength, and again we obtained a strong linear relation with correlation coefficient R = 0.7937. In order to verify our proposed equations, we compare the observed UCS from lab measurements with the predict value using empirical equation (3). Here as shown in Figure 9, the observed versus predicted data plots almost follow a straight diagonal line, which indicate a good correlation.
Conclusion
The correlation relationship between ultrasonic velocity, density, porosity and UCS for samples of basalt were determined,
Such correlations may provide a good estimation in related or similar geological setting regions for bulk density, porosity, and uniaxial compressive strength, which in many cases could avoid time-consuming and tedious lab test methods. Statistical analysis still needs to be done, in terms of verification and validation.


Join the Conversation
Interested in starting, or contributing to a conversation about an article or issue of the RECORDER? Join our CSEG LinkedIn Group.
Share This Article