Summary
In this paper, we introduce a newly developed technique to process potential field data as an alternative to Fourier and wavelet based techniques. This new technique is called the Empirical Mode Decomposition (EMD) and was recently developed by Dr. Norden E. Huang at the NASA Goddard Space Flight Center (Huang et al., 1998). The EMD method is different from the Fourier and wavelet transforms because it handles nonlinear and non-stationary signals.
The Fourier transform (FFT) is designed to work with linear and stationary signals. The wavelet transform, on the other hand, is well-suited to handle non-stationary data, but it is poor at processing nonlinear data. Additionally, the basis functions used in FFT and, to some extent, wavelet transforms are fixed and do not necessarily match the varying nature of signals and this will lead to the loss of some useful information in the signal. Since potential field data a re in general nonlinear and non-stationary in nature, we expect limitations in processing the data using FFT or wavelet methods.
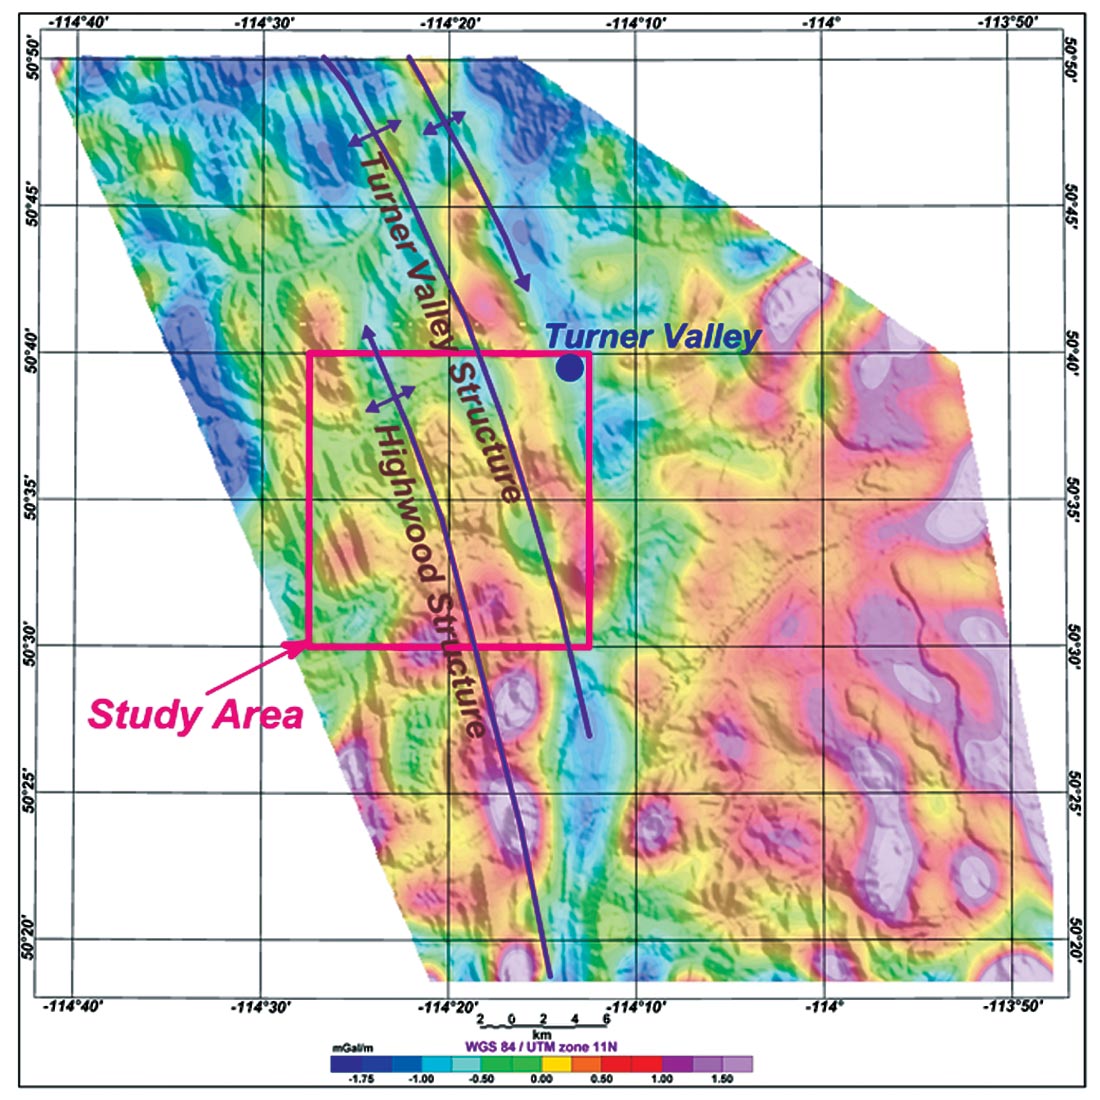
This work applies the EMD technique to process potential field data using airborne gravity over the Turner Valley area in the foothills of Alberta, Canada (Figure 1) in order to improve noise removal and thereby enhance the gravity signal.
Introduction
Airborne gravity surveys are becoming more common in the oil and mining industries. However, the quality of the results is limited by the level of noise introduced into the data during acquisition. We lack processing techniques that effectively remove noise from airborne gravity data. Traditionally, FFT and more recently, wavelet transform have been used to separate the noise from the signal. However, these data are non-stationary and nonlinear, and therefore neither FFT nor wavelet transform are really appropriate for this application. We have tested the EMD technique because we feel that EMD is more appropriate to process this type of data.
The data selected to test the EMD method is derived from an AIRGrav survey flown over the Turner Valley region of Alberta in the summer of 2001 by Sander Geophysics Ltd. (Peirce et al., 2002). The data set consists of over 12,000 line km of airborne gravity data flown on 250 m spaced east-west traverse lines and 1000 m spaced north-south control lines. The survey was flown with drape elevation that varies from 250 m height in the plains to over 500 m height in the mountains. After full processing on a line by line basis the data were leveled and the standard Bouguer reduction corrections, including outer terrain corrections using a reduction density of 2.67 gm/cc, were applied. Figure 1 shows the first vertical derivative of the filtered complete Bouguer anomaly.
Study area
The area selected for this study is located within the red box of Figure 2. The study area flanks the eastern edge of the Rocky Mountain where it is dominated by north-south trending faults associated with the foothills region (Fig. 2). The eastern side of the area consists of flat lying sediments. The Turner Valley region in general is a well-established area for oil and gas production and was the site of the first Alberta oil boom in the 1920’s. New discoveries are still being drilled in the structure and in sub-thrust plays where accurate depth mapping from seismic data is a challenge. The principal producing zones are from porous Mississippian aged carbonate rocks carried in overthrust structures.

Methodology
The EMD technique is part of a process known as the Hilbert–Huang Transform (HHT) that consists of two main elements: the EMD and the Hilbert spectral analysis. The EMD generates the intrinsic mode functions (IMFs) from the data, and the Hilbert spectral analysis generates a “timefrequency- energy” representation of the data, based on the IMFs. In this study we are only concerned with the EMD part of Hilbert–Huang Transform (HHT).
The EMD is an adaptive decomposition technique with which any complicated signal can be decomposed into a definite number of high-frequency and low frequency components by means of a process called “sifting”.
The sifting process decomposes the original signal, S(x), into a number of intrinsic mode functions (IMFs) according to the following formula:
n
S(x) = rn(x) + ci( x)
i =1
where, ci(x) represents an IMF, and rn(x), is the residual after the n IMFs have been extracted.
These IMFs have well-behaved Hilbert transforms and are defined as functions that:
- have the same number of zero- crossings and extrema, and
- the mean value of the upper and the lower envelopes is equal to zero.
A sifting process extracts IMFs from the signal iteratively in order to obtain a component that satisfies above mentioned conditions. The sifting process separates the IMFs with decreasing order of frequency, i.e., it separates high frequency component first and the low frequency component at the end.
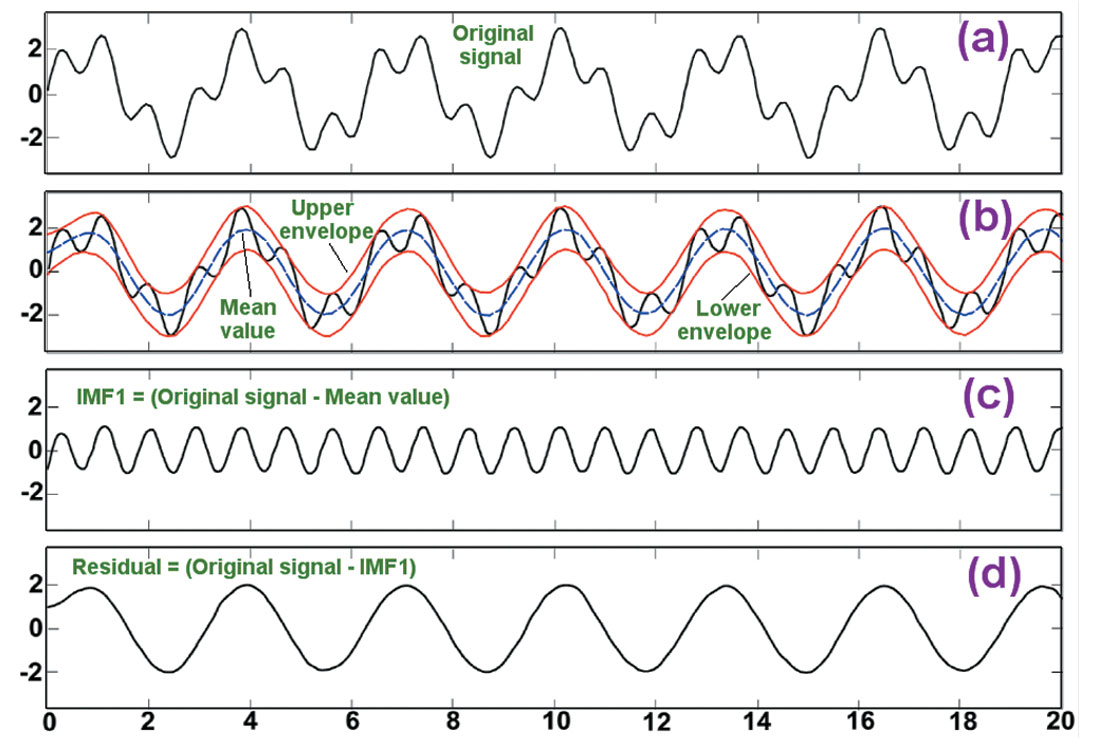
The EMD technique (Huang et al., 1998) is illustrated in Figure 3 for a simple signal consisting of two superposed sine waves. The decomposition of the signal into IMFs is performed as follows:
- Identify the positive peaks (maxima) and negative peaks (minima) of the original signal.
- Construct the lower and the upper envelopes of the signal by the cubic spline method (red).
- Calculate the mean values (blue) by averaging the upper envelope and the lower envelope.
- Subtract the mean from the original signal to produce the first intrinsic mode function IMF1 component.
- Calculate the first residual component by subtracting IMF1 from the original signal. This residual component is treated as a new data and subjected to the same process described above to calculate the next IMF.
- Repeat the steps above until the final residual component becomes a monotonic function and no more IMFs can be extracted.
Figure 3 clearly illustrates that by using EMD we have successfully reconstructed the two superposed sine waves in the original signal.
Generally speaking, the sifting process produces a set of IMFs that represent the original data vector broken down into frequency components from highest to lowest frequency. If all of the IMFs for a given signal are added together, the resulting “summation” signal is a near perfect match for the original signal (i.e., with little or no leftover), yielding a high level of confidence in the EMD results.
We have used a Matlab code written by Dr. Patrick Flandrin of Centre National De Recherche Scientifique (CNRS) in Lyon, France (Flandrin et al., 2004) to compute the EMD of the Turner Valley airborne gravity data.
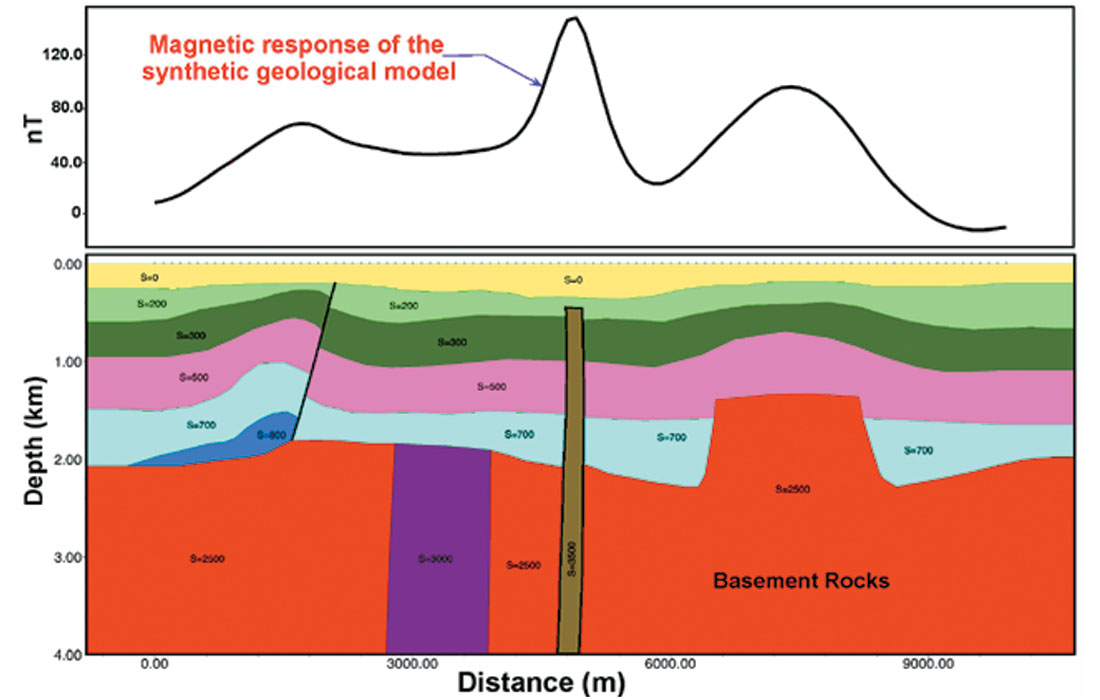
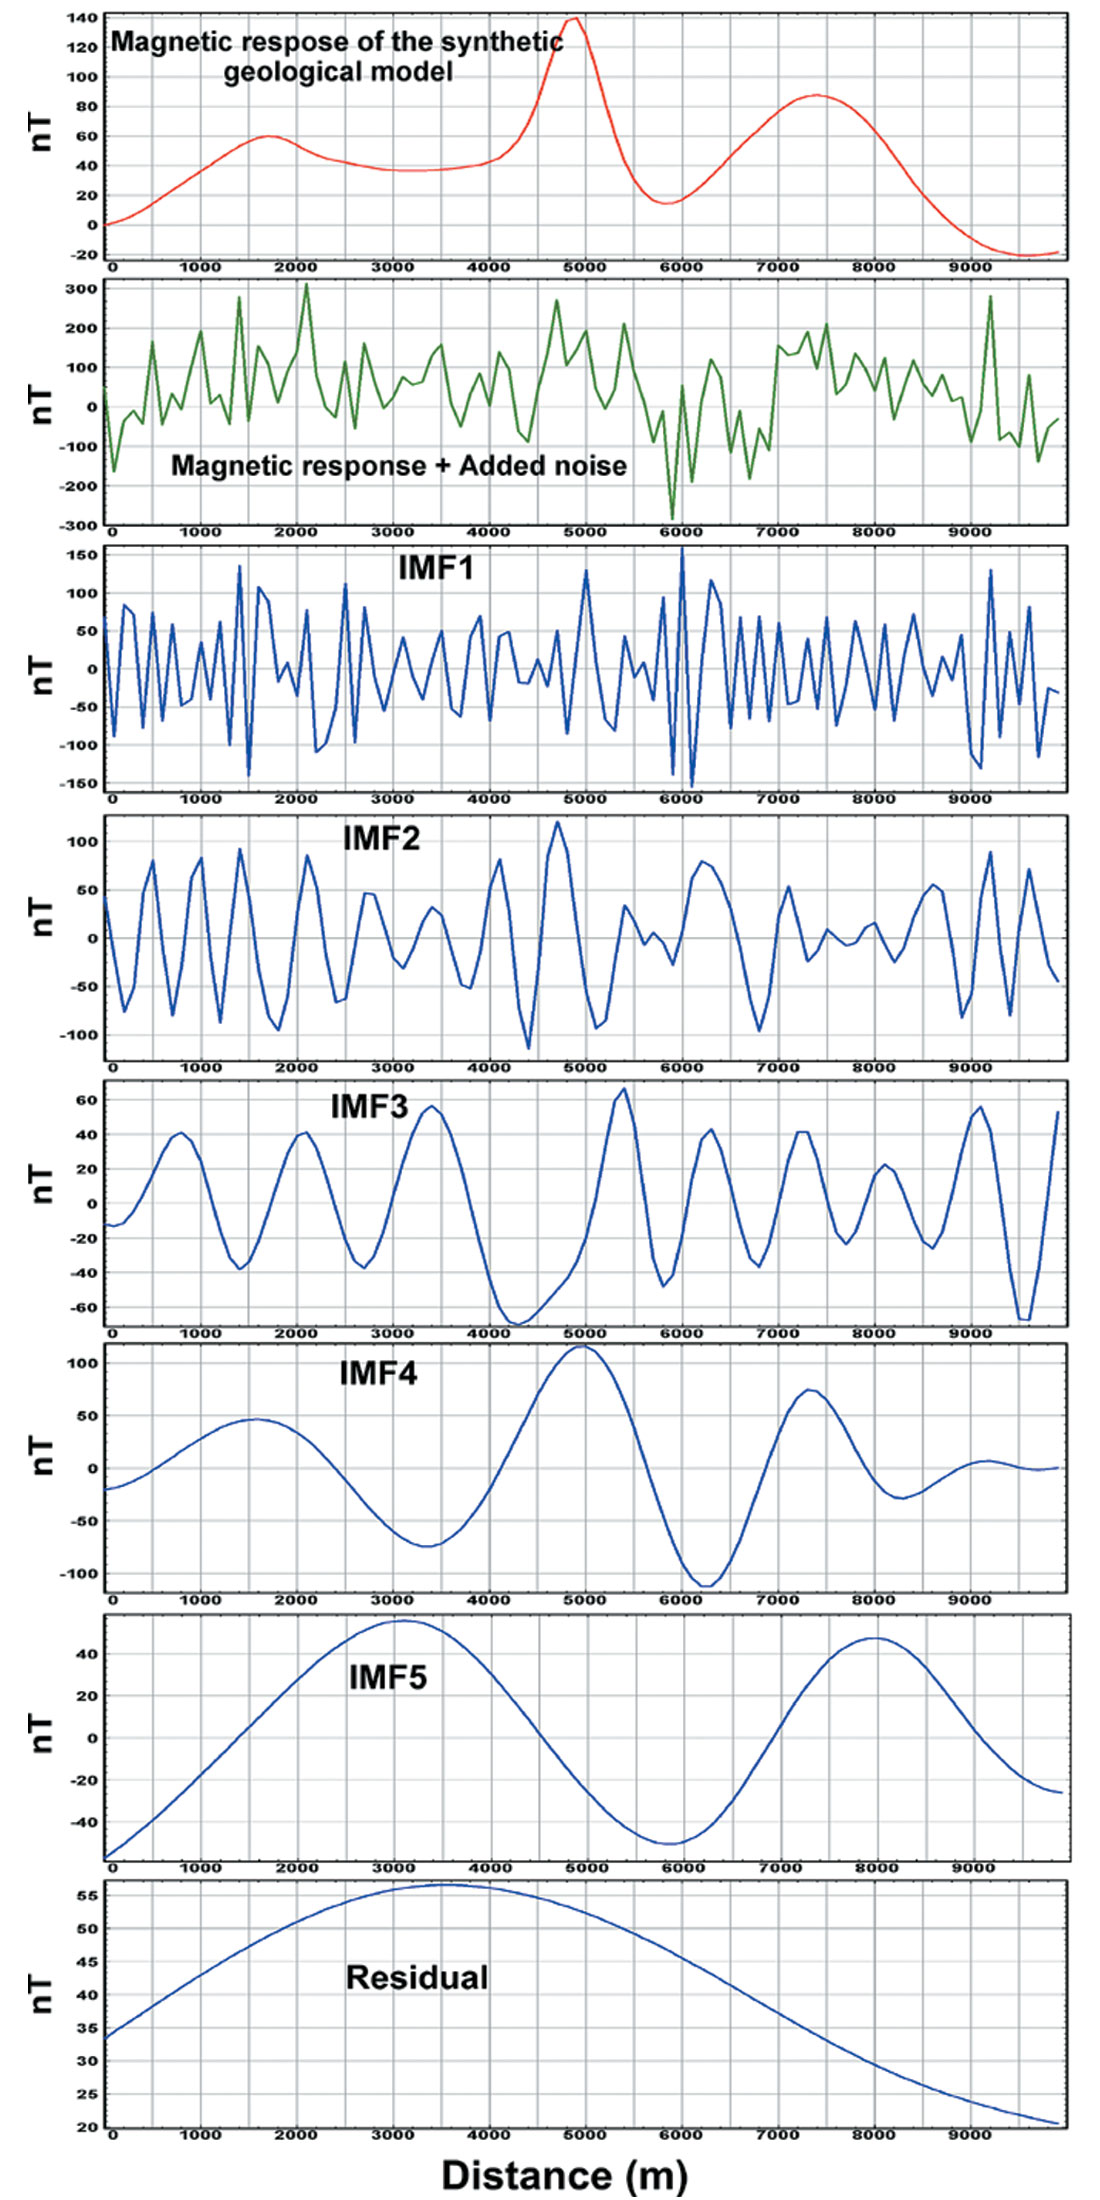
EMD decomposition of a synthetic geological model
In order to examine the efficiency of the EMD technique to separate noise from the data and to recover the original signal in the data we have performed a simple test. We have constructed a hypothetical geological model (Fig. 4) and calculated its magnetic response. We have used magnetic data instead of gravity data for demonstration purpose because magnetic response is sharper than gravity response of the same model. We have added random noise to the generated total magnetic field from the model to a degree that the noise completely masked the original signal (Fig. 5, second panel from the top). Then we ran EMD on the noisy profile and plotted the results. EMD was able to recover (quite well) the original signal from the noisy data (i.e., IMF4 of Fig. 5).
EMD test on Turner Valley airborne gravity survey
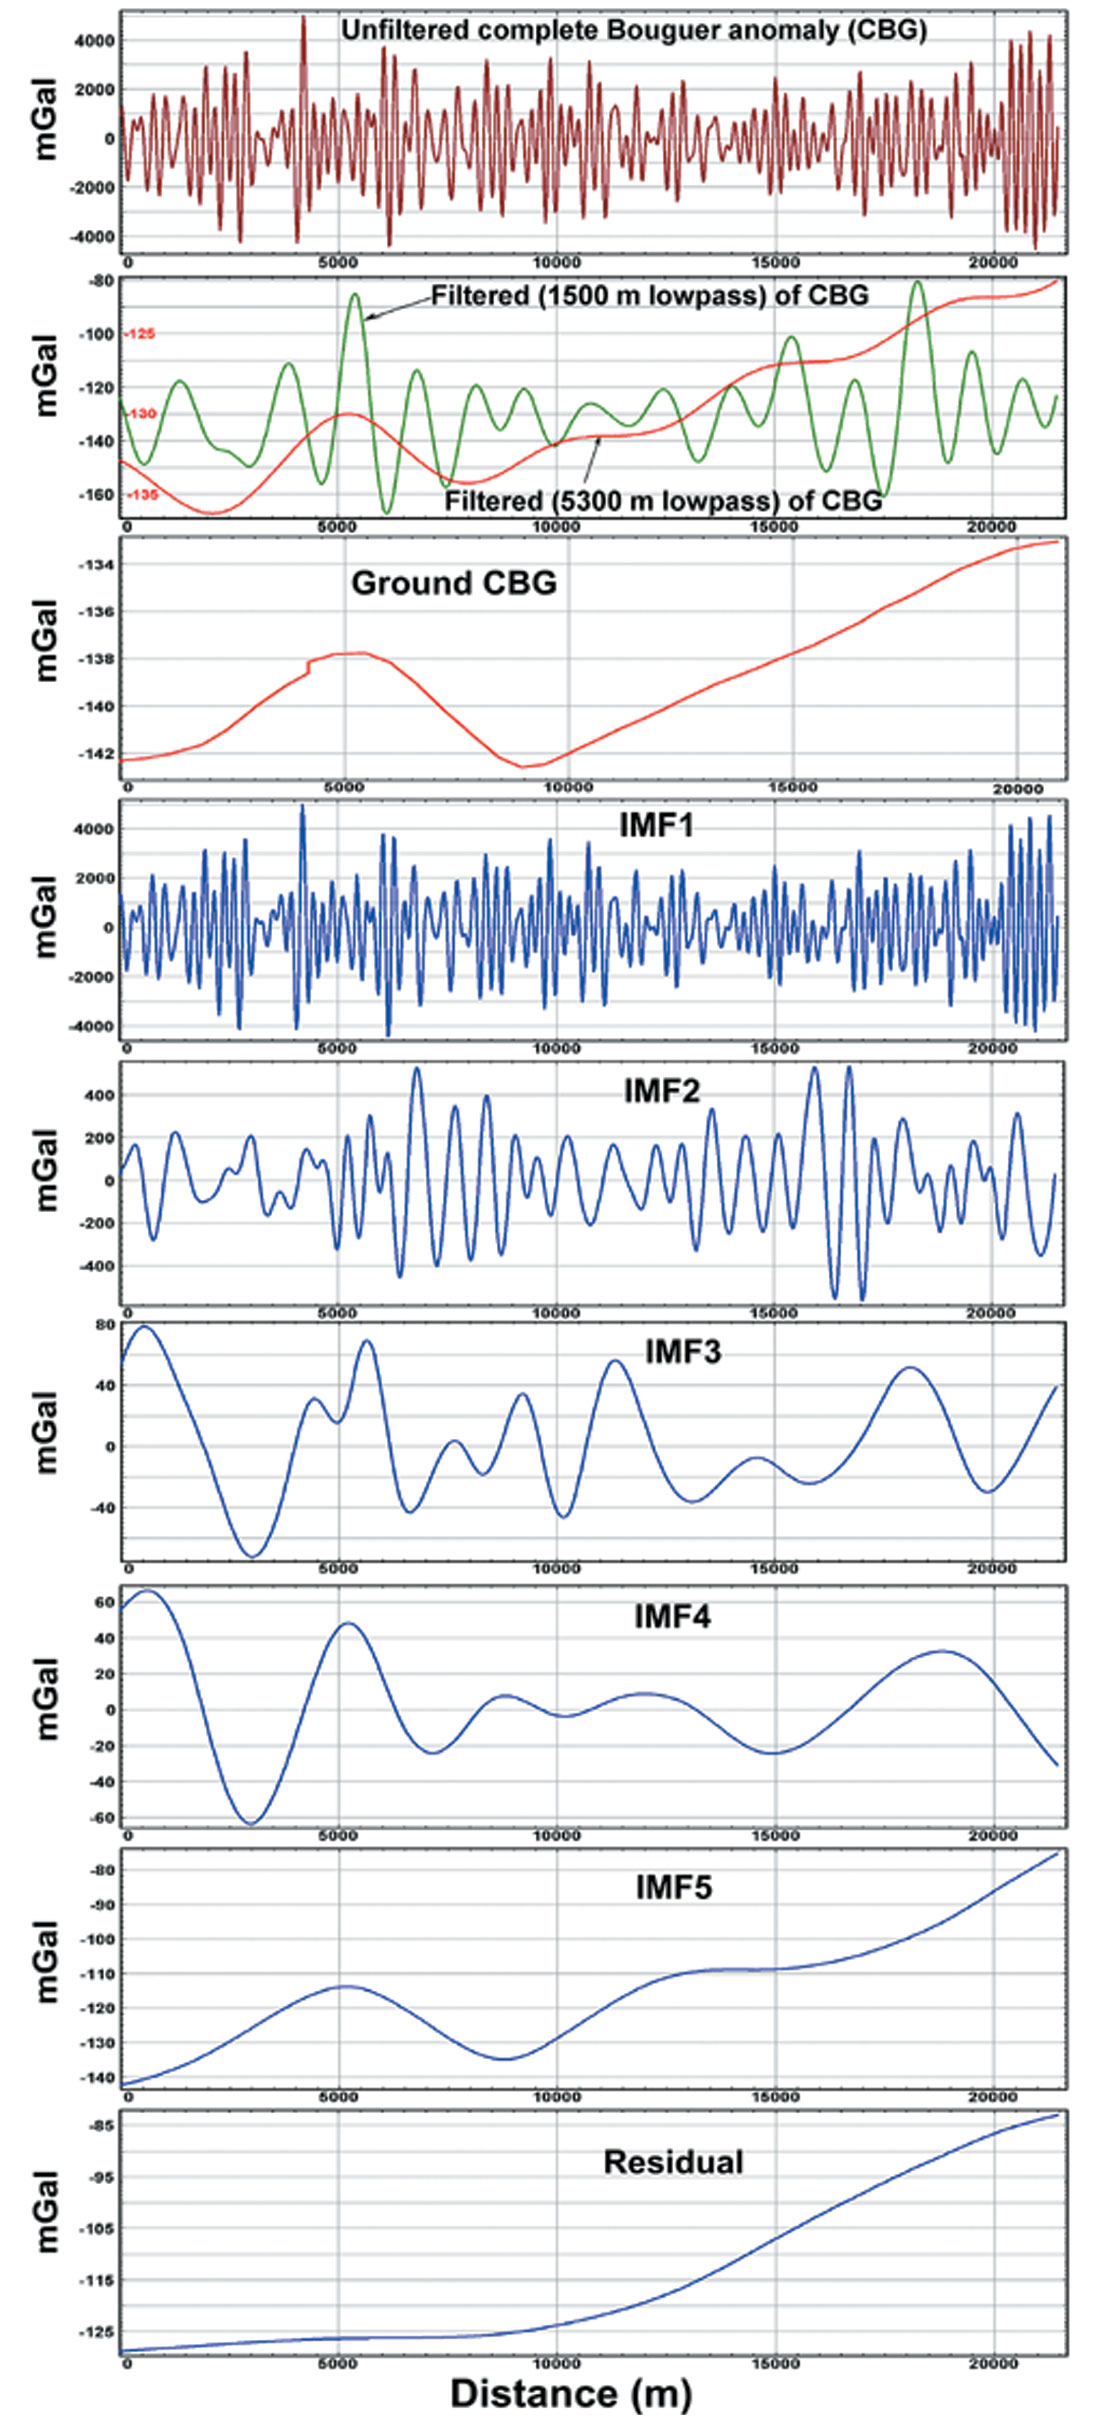
We have selected a segment of a ground gravity line that coincides with a portion of Line 902500 of the airborne gravity survey (blue line in Fig. 2) in order to test EMD decomposition. The results are shown in Figure 6. Figure 6 also shows the complete Bouguer gravity of the ground gravity line as well as the unfiltered and filtered (1500 m and 5300 m lowpass) profiles of the airborne gravity for comparison. The results show that the main components of the ground gravity profile are contained in IMF5, with perhaps some additional contribution from IMF4. These results provide us with some confidence in the technique. Figure 6 also shows that most of the high frequency components, including noise, are contained in IMF1, IMF2 and to some extent IMF3 whereas the low frequency components are confined to IMF4 and IMF5.
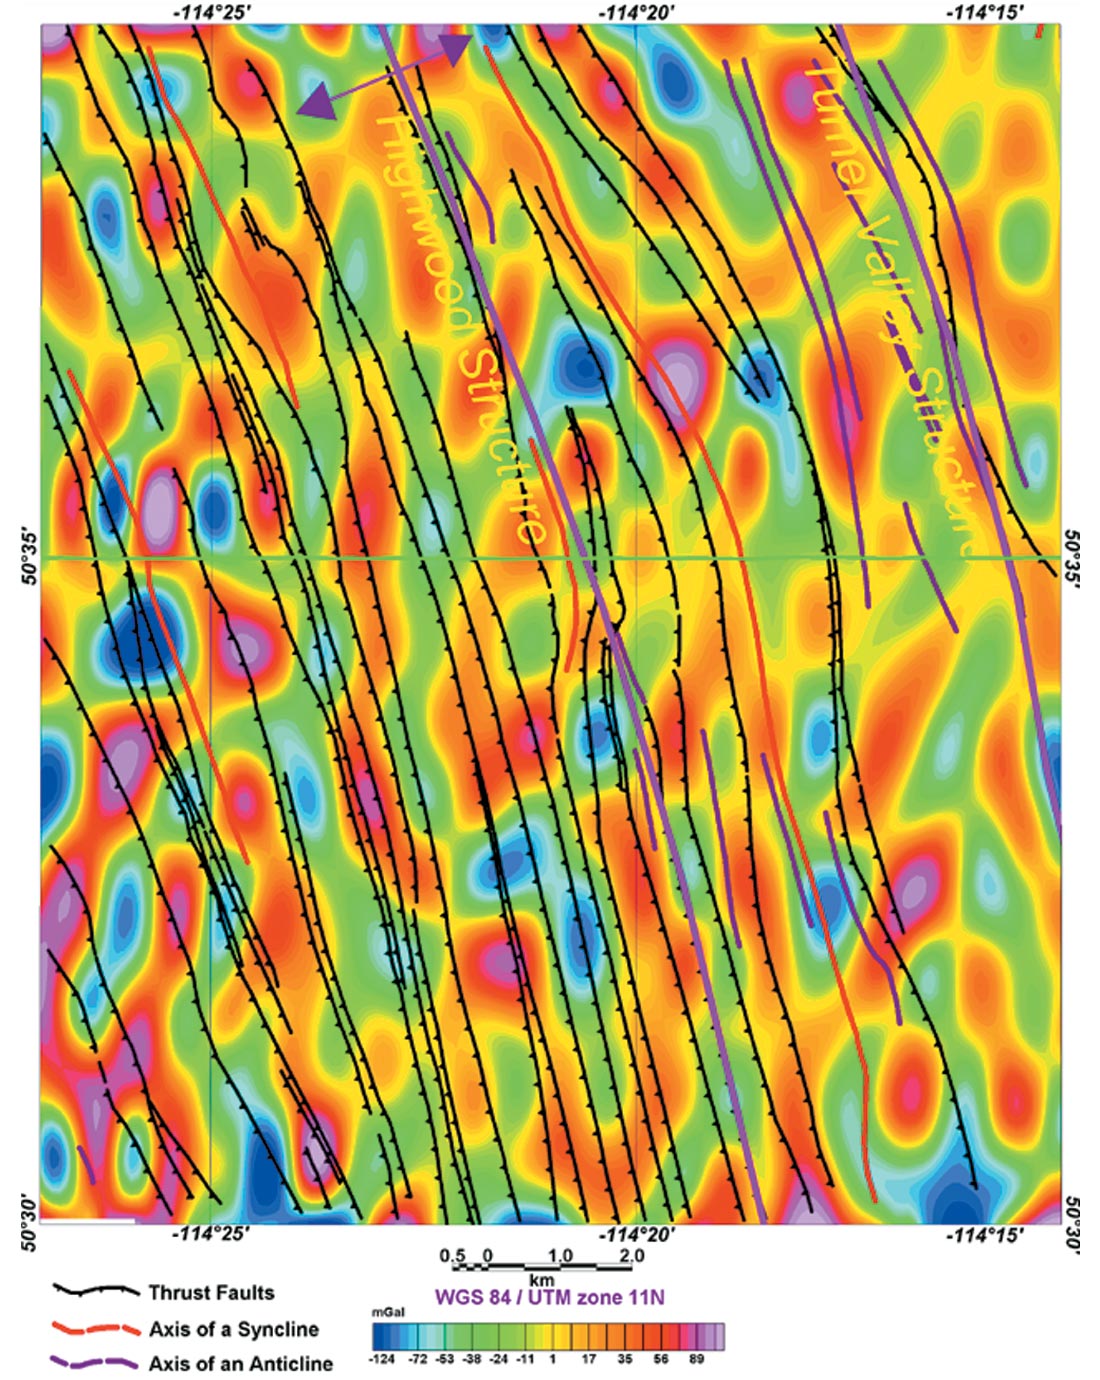
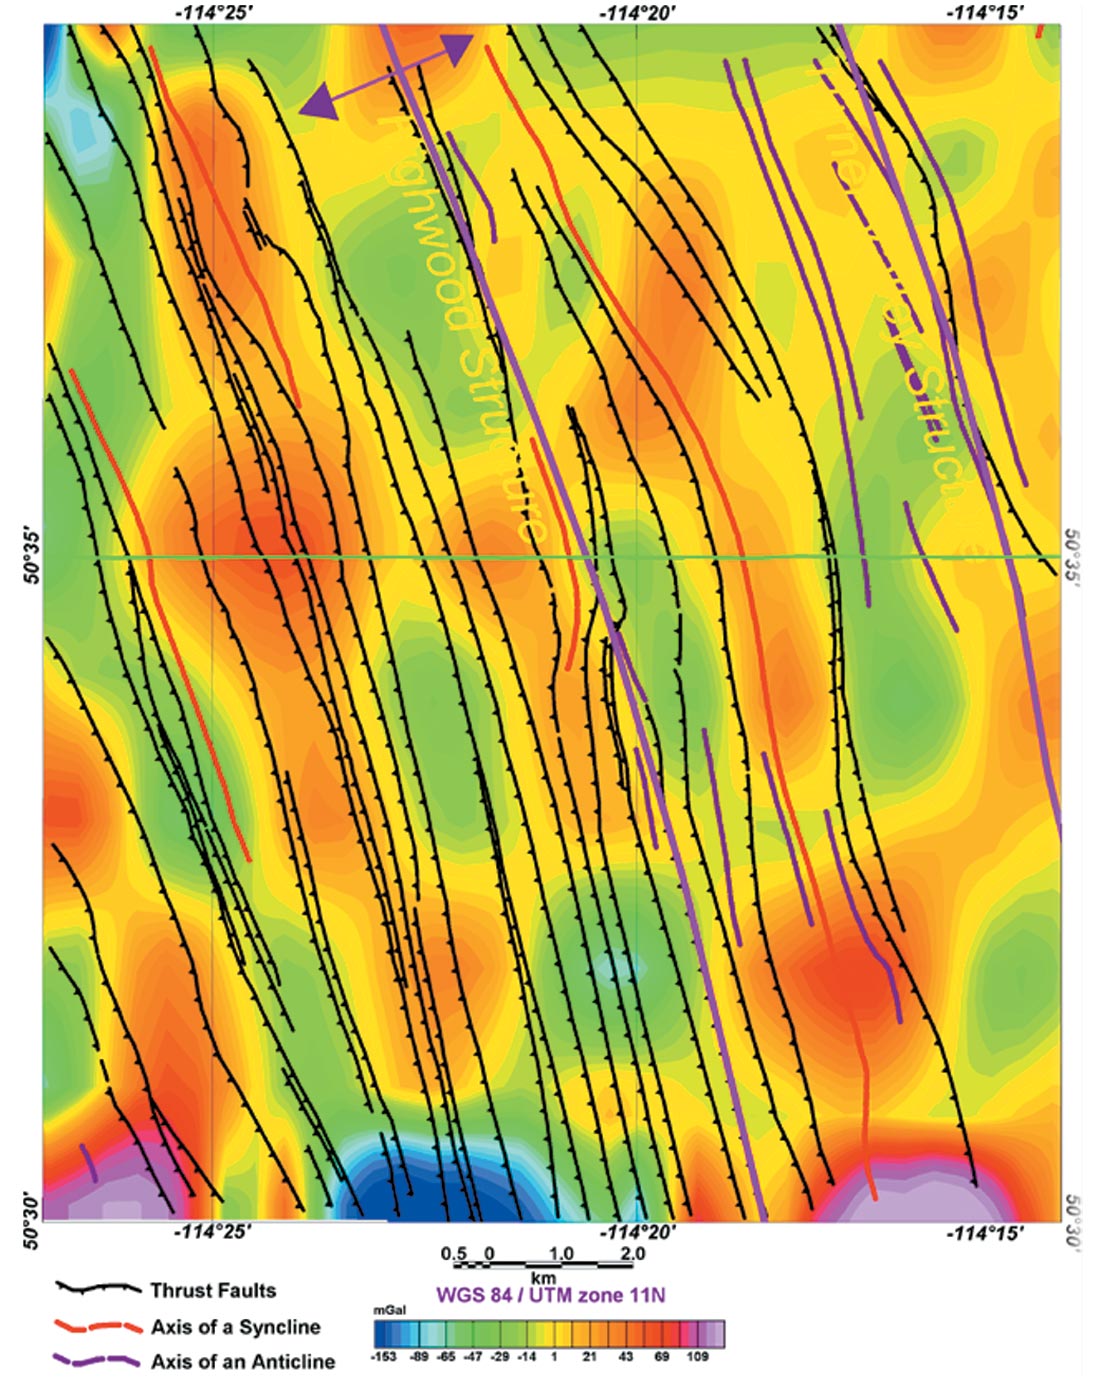
Then we used the EMD method to process the line data of the airborne gravity survey that covers the red box area shown on Figure 2. Based on our results of EMD decomposition of the test lines (Fig. 6) it appears that the useful geological information are probably contained in IMF4 and IMF5. For this reason, we have gridded and contoured the IMF4 and IMF5 components (Figs. 7 and 8, respectively) and compared the results with the 5300 m lowpass (Fig. 9) and the first vertical derivative (Fig. 10) of the original dataset. The results clearly indicate that the EMD decomposition is more resolving and reveal anomalies that coincide with the prominent geological structures in the area.
Conclusions
A newly developed technique called EMD was tested on airborne gravity data from the Turner Valley airborne gravity survey in west-central Alberta as an alternative to standard FFT and wavelet analysis techniques. This new technique is powerful at analyzing nonlinear and non-stationary signals such as airborne gravity data. It decomposes the signal to a summation of zero-mean AM-FM components, called Intrinsic Mode Functions (IMF). These IMFs show the main components of the analyzed signal.
The initial results of our test is encouraging and show that there is some application potential in isolating noise from airborne gravity data and to detect meaningful geological information that might have been masked by the amount of noise in the data. This technique can be used as an alternative to lowpass filtering of airborne gravity data because it appears to better preserves anomaly amplitude and wavelength.


Join the Conversation
Interested in starting, or contributing to a conversation about an article or issue of the RECORDER? Join our CSEG LinkedIn Group.
Share This Article