As geoscientists and engineers, and like most other professionals, we take pride in using our education and experience for the betterment of society. In developed countries, the value of such work on water supply projects may not be so obvious, where we take for granted that our communities will always have access to a ready supply of safe drinking water, and that we have built enough resilience to avoid running out of water should catastrophe strike. In Canada, we have some experience with these issues, including in some First Nations communities, where inadequate infrastructure and industrial contamination (e.g., Grassy Narrows) have led to shortages of safe drinking water. However, it is rare that we are tasked with finding water in the face of a large-scale humanitarian disaster. Yet, such a situation presented itself to our team of geophysicists in 2017, when the United Nations High Commission for Refugees (UNHCR) requested geophysical surveys for an emergency water supply project in southeastern Bangladesh. Here, upwards of 800,000 Rohingya people (ReliefWeb, 2018) are crammed into refugee camps and makeshift settlements, and are enduring a worsening health crisis because they don’t have a reliable source of safe drinking water.
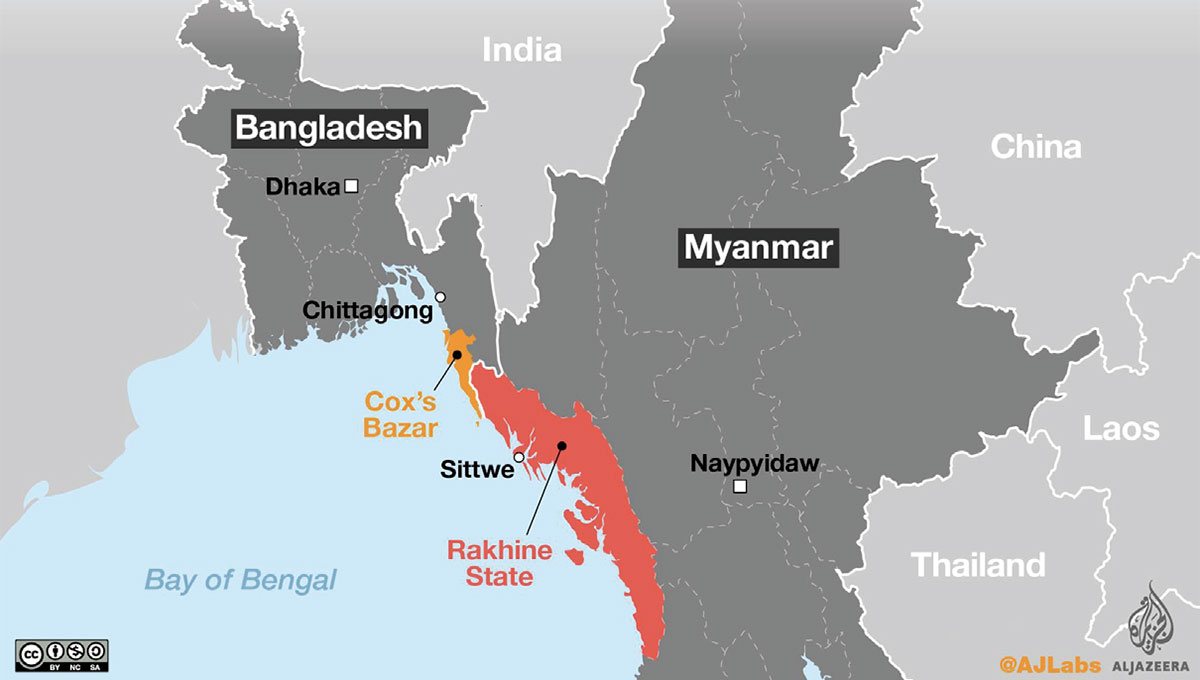
Since the 1970s, and as a result of ongoing persecution and ethnic violence, Rohingya (largely Muslims) have been forced from their native home in Northern Rakhine State in Myanmar. Most of those fleeing have crossed the border into Bangladesh and now reside in refugee camps and makeshift settlements close to Cox’s Bazar (Figure 1). The most recent exodus began on August 25, 2017, after the Myanmar military began a violent crackdown and clearance operations of Rohingya villages. Since that time, approximately 693,000 Rohingya people have arrived in Bangladesh (OCHA, 2018), flooding the existing camps near Cox’s Bazar and creating their own makeshift settlements. The majority of the new arrivals are concentrated around the Kutupalong and Balukhali makeshift settlements, although tens of thousands more have settled in and around the Nayapara refugee camp and Leda makeshift settlement further to the south. Most of those who fled the violence travelled for several days on foot, while others were forced to make dangerous water crossings in overcrowded boats, across the Naf River that separates Myanmar from Bangladesh’s Teknaf Peninsula (Figure 2). They came with the barest of possessions and arrived requiring immediate access to the basic necessities of life: security, food, shelter, and water.
Together with the Government of Bangladesh, the International Organization of Migration (IOM), and various international NGOs, UNHCR has been tasked with delivering emergency aid to the hundreds of thousands of Rohingya displaced into Bangladesh. This includes the supply of emergency shelter kits, food rations, the construction of latrines, and the installation of new water wells to meet the drastic increase in demand for drinking water.
Most of us think of Bangladesh as a densely populated, low-lying country that is periodically subject to flooding during seasonal monsoons. It is hard to imagine water scarcity being an issue in such a place. Yet, in the vicinity of the Nayapara and Leda camps on the southern Teknaf Peninsula (Figures 2 and 3a), a combination of unfavourable hydrogeological conditions and inadequate infrastructure means that there is insufficient surface water or groundwater storage to meet the demands of the camps during the pronounced dry season, when rainfall is rare. In order to supplement the dwindling water supply from the existing water reservoirs and shallow hand-pumped water wells, the IOM and UNHCR’s Water Sanitation and Hygiene (WASH) sectors have proposed the siting of new water wells that will hopefully tap deeper, high-yielding aquifers. Because the local geology is complex and poorly understood, geophysical investigations were proposed to help locate and map potential aquifers.
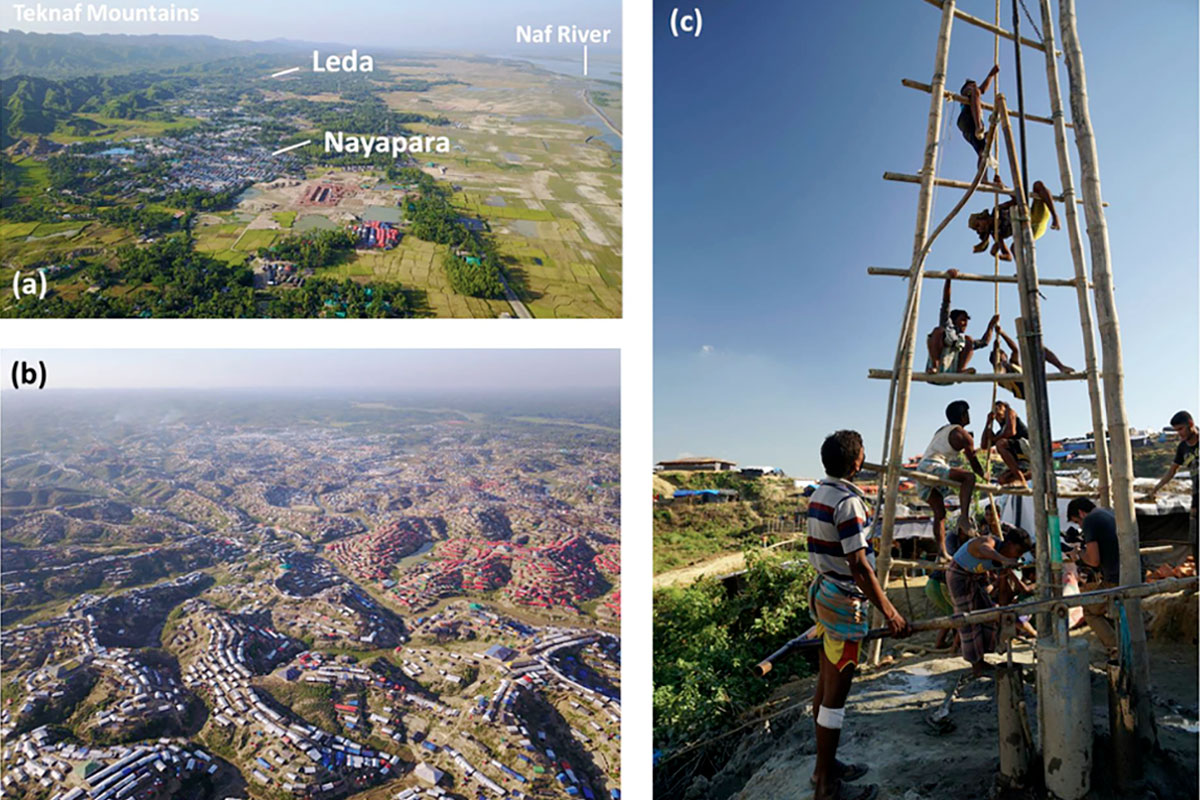
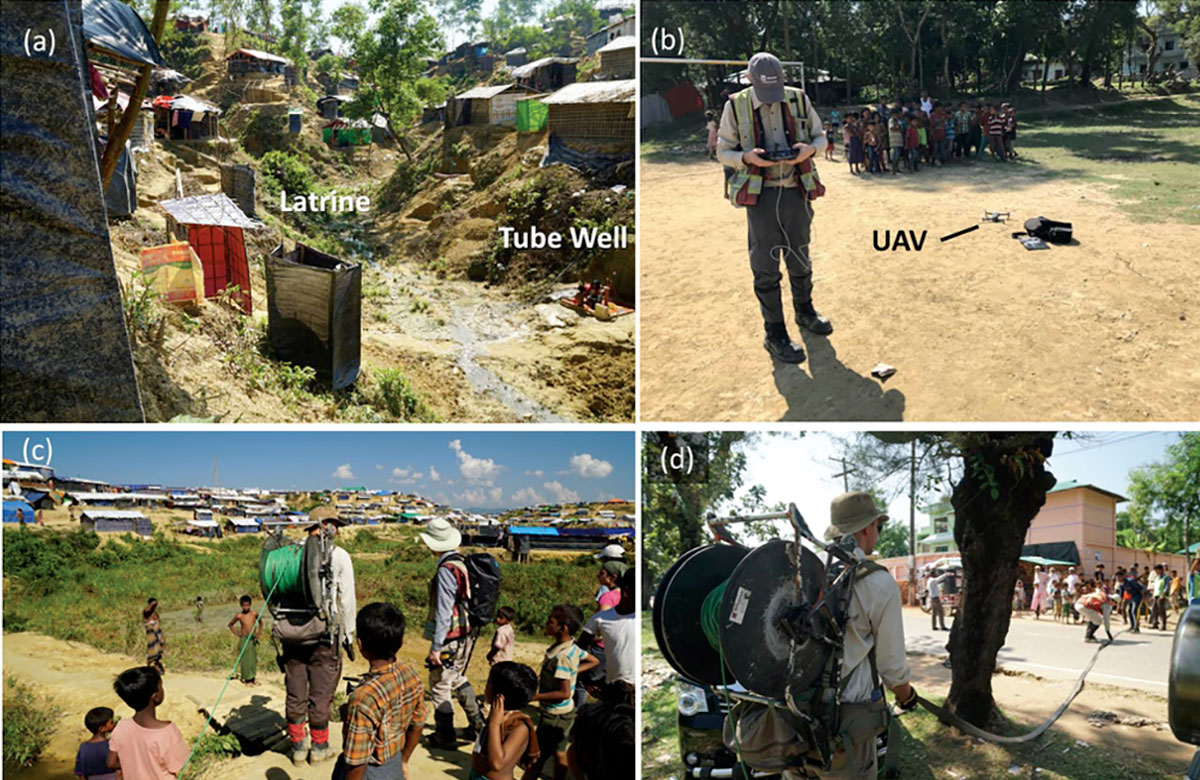
Further to the north, relatively extensive shallow aquifers have been exploited for the immediate water supply needs of the Kutupalong and Balukhali “mega camps”, as they have been termed, and thousands of shallow (< 10 m depth) hand pumps have been installed by well-meaning NGOs (Figures 3b and 3c). Unfortunately, in the rush and chaos of the emergency relief action, and due to the cramped and squalid conditions in the camps (space is as low as 8 square metres per person; UNHCRa, 2018), the majority of the water wells have become contaminated by human and animal waste. Where they are in use, many of the latrines and “sludge disposal pits” are overflowing, and waste is leaching downgradient to hand pumps or into groundwater recharge areas (e.g., Figure 4a). Compounding the problem is that many Rohingya are reluctant to use the available latrines, and open defecation is rife throughout the camps.
With the widespread contamination of the shallow wells, and consequent impending threat of waterborne diseases like typhus, dysentery, and cholera, aid agencies have been instructed to develop water wells into deeper aquifers that are less susceptible to surface contamination. In support of these efforts, our team was requested to undertake a geophysical survey within areas of the Kutupalong and Balukhali settlements to help find and map deeper aquifers.
So we found ourselves, in October of 2017, and at the behest of UNHCR and Oxfam (our in-country NGO facilitator in Bangladesh), scrambling at short notice to pull together a team and geophysical equipment for a three-week field groundwater exploration program in Bangladesh. Despite the usual logistical challenges associated with working in another country on an accelerated timeline, somehow our crew of 5 field staff arrived with 19 of our 23 pieces of checked luggage in Cox’s Bazar by the end of October.
The use of geophysics in groundwater exploration programs is well documented (e.g., Goldman and Neubauer, 1994), including for water supply to refugee camps (e.g., Bauman et al., 2017). In this article, we will focus on the unique challenges of data acquisition within and around the densely populated Rohingya refugee camps, and show how the results of our survey were rapidly analyzed and disseminated to the various stakeholders who were tasked with developing new water wells within the camps.
Geological and Hydrogeological Setting
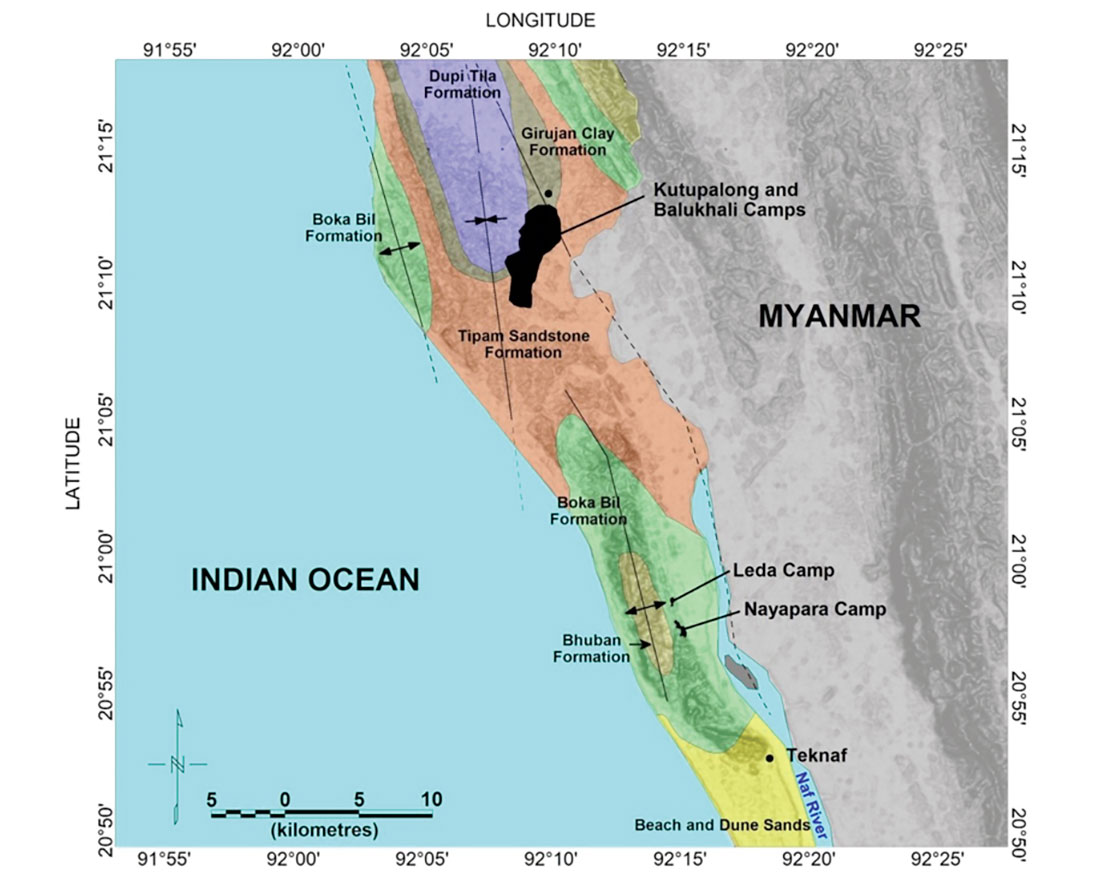
The geology of the Teknaf Peninsula comprises Miocene to Pliocene aged sedimentary rocks (sandstones, shales, and conglomerates) that were deposited in the Bengal Basin (Najman et al., 2012; Afroz, 2012). This layered sequence of sedimentary rocks has been deformed by ongoing plate tectonics such that the sequences are folded and faulted and, in general, the bedrock units of the Teknaf Peninsula form an anticline that plunges to the north (Figure 2; Burrows and Van Dijk, 2017). Uplift and erosion of the anticline have left units of the Tipam Sandstone, Boka Bil, and Bhuban Formations exposed in the mountain chain that extends along the Teknaf Peninsula.
The Kutupalong and Balukhali makeshift settlements are located at the northern end of the peninsula, where the regional fold forms a ‘bathtub’ like syncline and Tipam sandstone units are exposed (Milnes, 2017; Figure 2). The Nayapara and Leda camps are located on the coastal plains to the east of the north-south trending mountain ranges. The area surrounding the Nayapara and Leda camps is underlain by a cover sequence of intercalated alluvial fans from the mountains, and clay-rich Naf River estuarine deposits (Milnes, 2017; Figure 2). Beneath the cover sequence, the bedrock units are understood to be either Tipam sandstone or more clay-rich sequences associated with the Boka Bil Formation (Burrows and Van Dijk, 2017). Although monsoon rains bring up to 4 500 mm of precipitation a year, during the pronounced dry season, which extends for 5 months between November and April, any rainfall has a negligible impact on recharge of groundwater aquifers or surface water reservoirs (Burrows and Van Dijk, 2017).
Geophysical Survey around the Nayapara and Leda Camps
Travel between our hotel in Cox’s Bazar and the UNHCR-operated Nayapara and IOM-operated Leda camps involved a long daily journey south, down the mountainous and picturesque western side of the Teknaf Peninsula (overlooking supposedly the world’s longest sand beach), through the bustling town of Teknaf in the south, and back north up to the camps. Before reaching the camps, you pass through at least one government checkpoint, and are greeted by a mass of refugees, as they wander to and from the UNHCR aid distribution center set up along the highway that passes by the camps. Although officially confined to the camps, the Rohingya have no choice but to spread out and intermingle with the uneasy Bengali locals in the surrounding communities, who themselves barely make a living farming tiny plots of rice or working the clay soil into kiln-fired bricks.
The Nayapara camp was established in the late 1990s, whereas the Leda camp was constructed in 2008, to take in additional Rohingya refugees during a later wave of migration. The IOM now operates Leda camp and UNHCR takes responsibility for Nayapara camp. By September, 2017 the population of both camps had swelled to over 77,000 people (UNHCRb, 2017).
As of April 30, 2018 (ReliefWeb, 2018), the refugee population in the Leda and Nayapara camps had reached 100 352 people. By the time we had completed our survey work in November, 2017, water for the entire Nayapara camp was still supplied exclusively from a single reservoir with a capacity of only 70,000 to 80,000 m3, far short of the required water volume of 1.9 million m3. Even before the most recent influx of new arrivals to the camp, high evaporative losses and silting of the reservoir during later parts of the dry season meant that water often had to be trucked in to the camp (Milnes, 2017). Immediately surrounding the camp, shallow suction-type tube wells are used for most of the year, but declining water tables render them useless over much of the dry season. Hence the desperate need to supplement the existing water supply by siting new water wells into deeper aquifers with sufficient yields to meet the demands of the camp throughout the dry season.
Our working hypothesis was that a relatively extensive aquifer or aquifers underlie the coastal plain between the camps and the Naf River to the east. To detect and map these features, we undertook an electrical resistivity tomography (ERT) survey with a proposed depth of investigation of up to 100 metres below ground surface (mbgs). We expected that any fresh water saturated, sand-dominated aquifer units would exhibit relatively high electrical resistivities relative to clay-dominated or salt water saturated units.
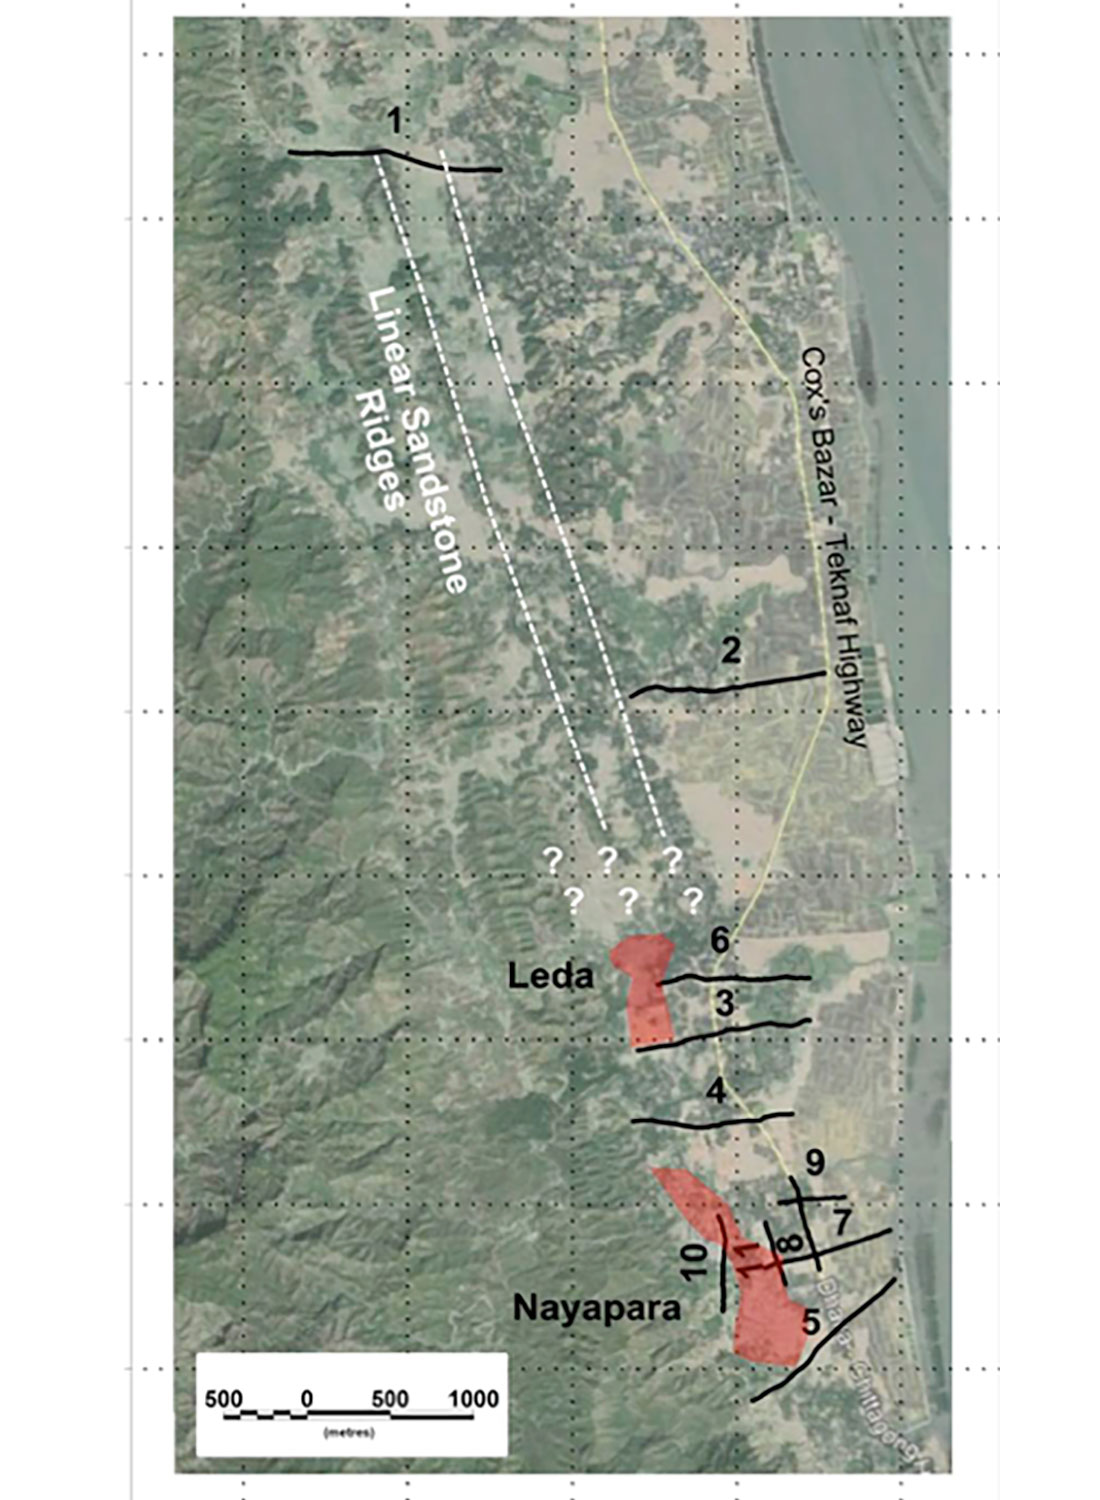
An initial 1,300 m long, east-west line was acquired across two north-northwest to south-southeast (NNW-SSE) striking ridges of sandstone that outcrop approximately 5 km north of Leda camp (Figure 5). Our objective was to determine the depth and lateral extent of the sandstone units as they extend under the cover sediments forming the coastal plain. This was also a convenient place to survey along an existing road through rice paddies, and to test our equipment in a relatively quiet location, before working around the more populous areas of the camps to the south. We also used this area to test our compact UAV quadcopter (Figure 4b), which was used to shoot high-resolution aerial images of our survey areas. By using photogrammetry software, we were able to use the images to create georeferenced orthophotos of areas of interest (e.g., lower panel of Figure 6). This would prove to be an invaluable reconnaissance and mapping tool in the more densely populated areas of the refugee camps, where there were few open spaces to survey within, and existing satellite imagery (i.e., Google Earth) was too out of date to show the rapid recent expansion of shelters and other infrastructure.
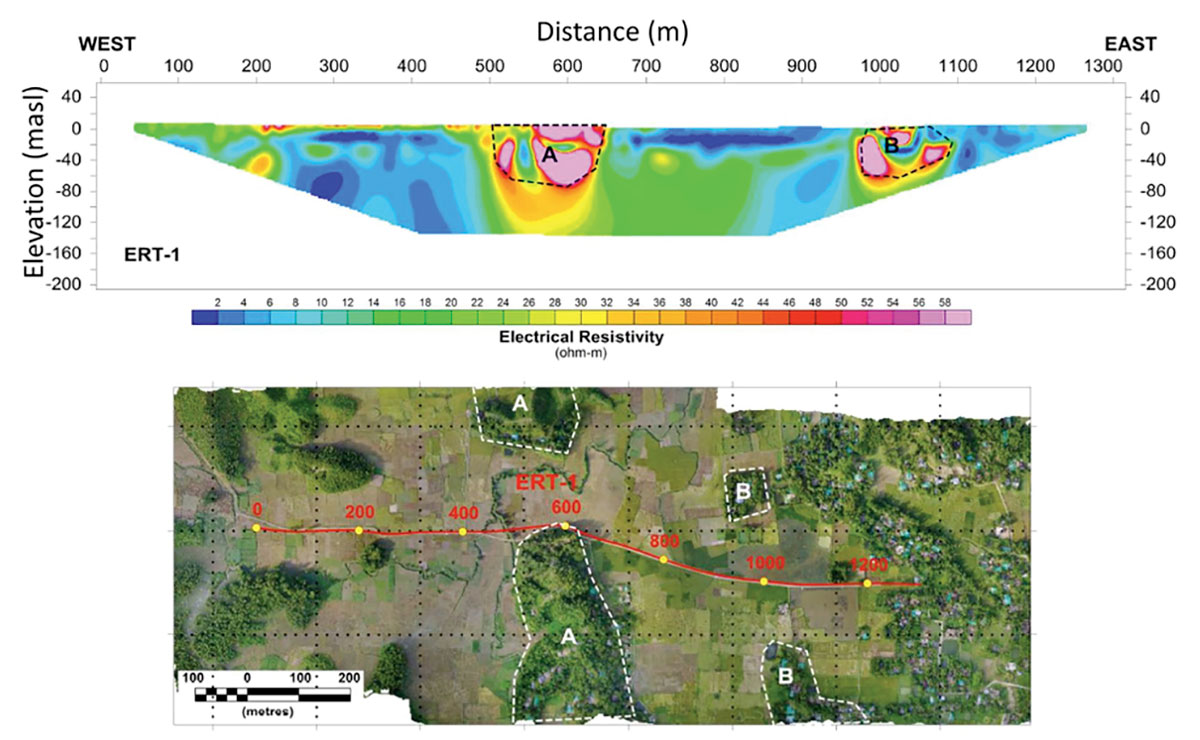
The ERT data were measured using a 12-channel ABEM Terrameter LS resistivity system and a minimum electrode spacing of 10 m. We opted to use an expanded gradient array geometry, which enables a high density of measurements to be collected in a relatively short time frame, and provides a good compromise between horizontal and vertical resolution of targets (Dahlin and Zhou, 2004). All of our ERT data sets were processed using commercially available RES2DINV tomographic inversion software. The resulting 2D cross-sections (e.g., Figure 6) are displayed as colour-shaded grids, with warm colours (reds and pinks) indicating relatively high resistivity features, and cool colours (blues) showing low-resistivity (or high-conductivity) features.
The resistivity cross-section for ERT-1 reveals that the high-resistivity sandstone units underlying the ridges (pink units A and B) are surrounded by low-resistivity clay-rich units (blue colours), and that the sandstone extends to depths of only up to 60 mbgs (upper panel of Figure 6). The high-resolution UAV-based orthophoto over the survey line (lower panel of Figure 6) shows that these sharply defined features coincide with the tree-covered linear ridges that extend to the north and south of the line. On a larger scale, satellite imagery (Figure 5) shows that these ridges likely extend further to the south, where they pass close to the Leda and Nayapara camps.
Although the data from ERT-1 did not indicate that the sandstone units are laterally extensive in an east-west direction, the aerial imagery suggests that they are continuous over large distances to the north and south, and may have the capacity to store a significant volume of groundwater.
A second ERT line (ERT-2) was acquired further to the south to assess the subsurface geology under the recent cover of river sediments forming the coastal plain to the east of the linear ridges. Indications from the resistivity cross-section for this line were that potential sand units were present under the coastal plain, but these sand units were likely more susceptible to salt-water intrusion from the Naf River, and that any water well installed into these aquifers may be too far from the camps to provide a cost effective water supply.
In order to precisely map the subsurface sandstone units A and B closer to the camps, we obtained additional ERT lines 3 through 11 (Figure 5). To complement our geophysical work with ground truth information, we undertook a water well survey to determine locations, approximate depths of existing wells, and their likely yield. In general, the existing shallow hand-pump wells were classified as low productivity, whereas deeper wells (with depths greater than 10 mbgs) that often utilized motorized pumps were considered to have sufficient yield to be classed as high productivity wells. Most of the private well owners were willing to share this information, thanks to the charm of our local Bengali drivers / translators / security guards, Abdur and Shajahan.
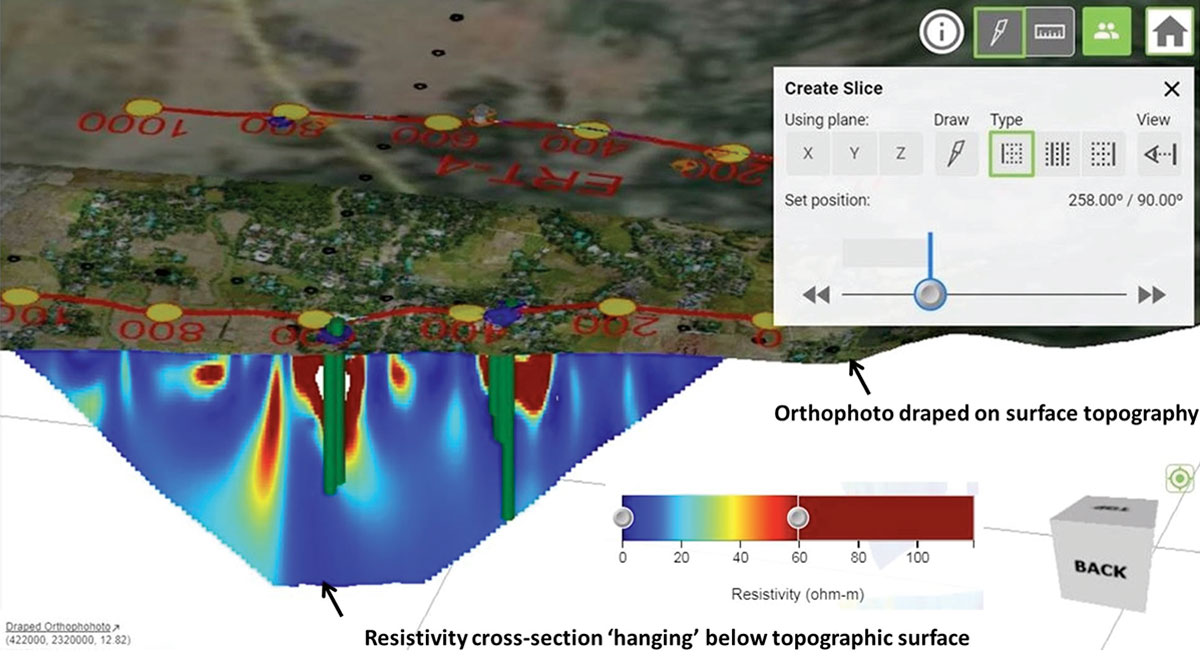
Given the multiple sources of georeferenced information (well locations and approximate depths; ERT cross-sections; topography and aerial imagery), we needed a way to integrate the information into a 3D model from which we could then use to make interpretations and visually communicate our findings to the various stakeholders (UNHCR and IOM staff, NGO drilling contractors, etc.). We also needed to use this model to make day to day decisions on proposed ERT line locations. All of our data were imported into Steno3D cloud-based 3D modelling software (now rebranded as Leapfrog View), which enables interactive 3D geological models to be displayed in a web browser. An example rendering from a slice through our model along Line ERT-3 is shown in Figure 7, and shows how two clusters of relatively high productivity water wells (green cylinders) coincide with two relatively high-resistivity zones that are interpreted to be sandstone aquifers. At other locations along this line, only shallow hand-pump wells could be found that appeared to have very low yields, likely only drawing water from less permeable clay-rich units.
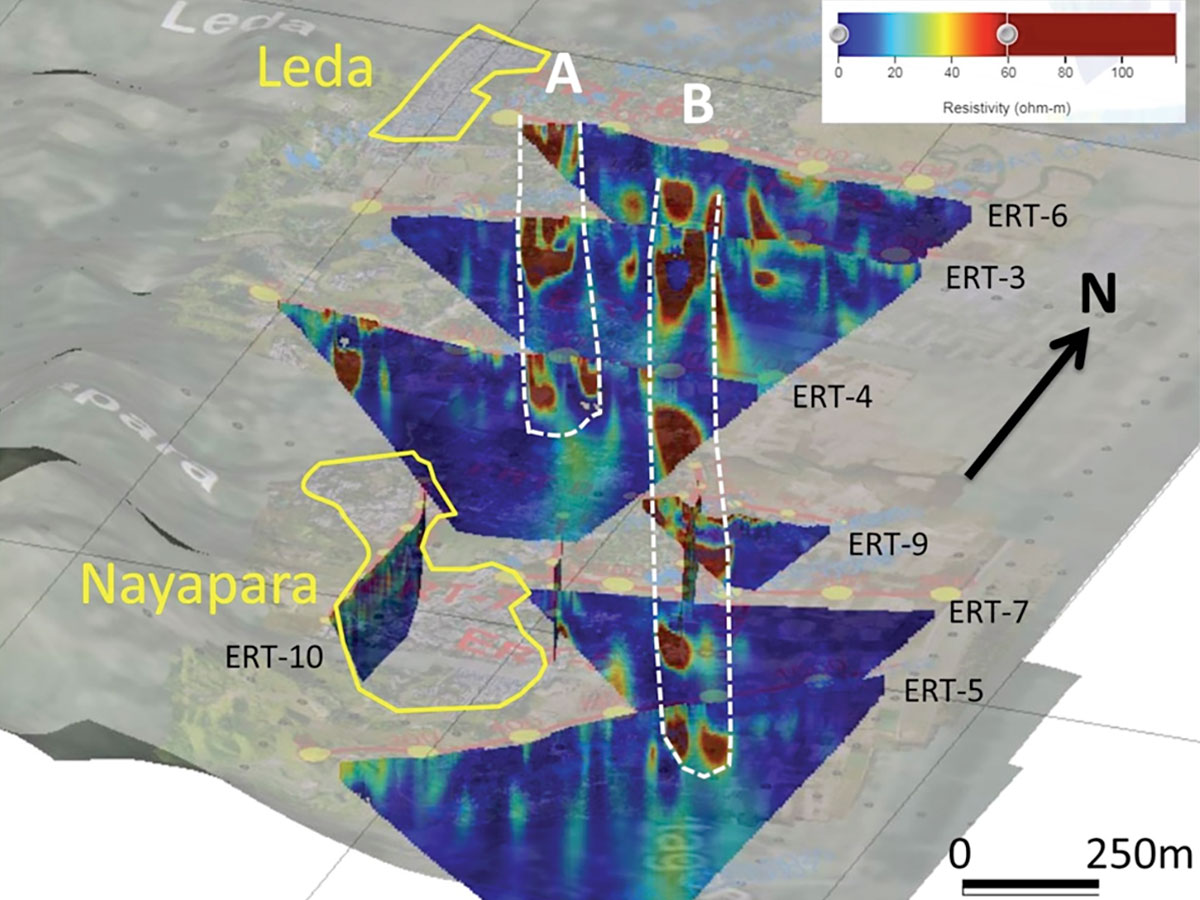
Having proved that the resistive zones were also good candidates for targeting water wells, we focused our efforts on mapping these two sandstone units in detail around the camps. From the remaining lines, we were able to map the extents of the two linear sandstone units, A and B (Figure 8), and established favourable locations for drilling wells to test these two aquifers (at the time of writing, drilling of test wells had just been completed).
In addition to mapping the two major sandstone units, a single ERT line was acquired alongside the main reservoir within Nayapara camp for the purpose of mapping the shallow soil layers beneath the reservoir (ERT-10; location shown in Figure 8). The results indicated that the reservoir was underlain by relatively impermeable clay-rich units. With this information in hand, UNHCR considered engineering works to deepen the reservoir to increase water storage for the camp.
Geophysical Survey of the Kutupalong and Balukhali Settlements
Having honed our geophysical operations around the Nayapara and Leda camps, we were dispatched to ground zero for the Rohingya refugee crisis: the colossal Kutupalong and Balukhali settlements. Whereas areas around Nayapara and Leda were largely accessible by road, the makeshift arrangement of thousands of new shelters at Kutupalong, over hilly terrain, was completely impenetrable by any kind of motorized vehicle. On our first day at Kutupalong we had barely driven into the main camp entrance before having to disembark on foot with all of our equipment. Thankfully, we had no shortage of Rohingya helpers willing to carry batteries or electrodes for hundreds of metres, along the narrow pathways and over rickety bamboo bridges to our survey areas.
Walking through the camp is awe inspiring. From up high, the views are of thousands of shelters extending as far as the eye can see in any direction. Like a scene out of Star Wars on some barely inhabitable desert planet, the landscape has been denuded of vegetation and replaced with a densely packed arrangement of never ending bamboo and tarpaulin shelters. Not even the best computer-generated imagery could do this scene justice. Only after viewing camera footage from our drone did we start to get an appreciation of the sheer scale of the settlement: a sprawling tent city of more than 600,000 people (more than the entire populations of Regina and Saskatoon combined).
Considering that we knew virtually nothing about the hydrogeology of the area, our first objective was to complete an approximately west to east transect across the width of the settlement, and perpendicular to the regional geological strike of the bedrock units. Because the layout of the settlement was virtually unknown and evolving on a daily basis, we relied on our UAV to obtain georeferenced aerial images from which we could plan our survey lines. For most lines, we were able to take advantage of open, linear corridors along valley bottoms, and weave our way through gaps between shelters (e.g., Figure 4c).
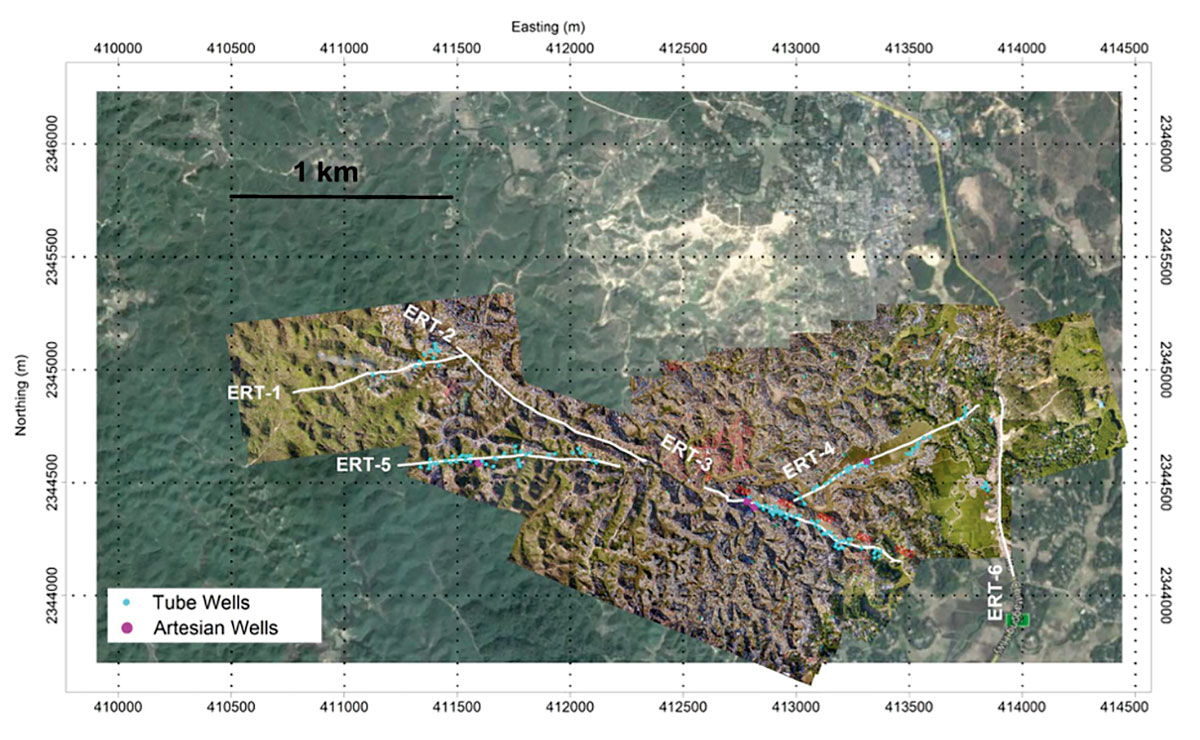
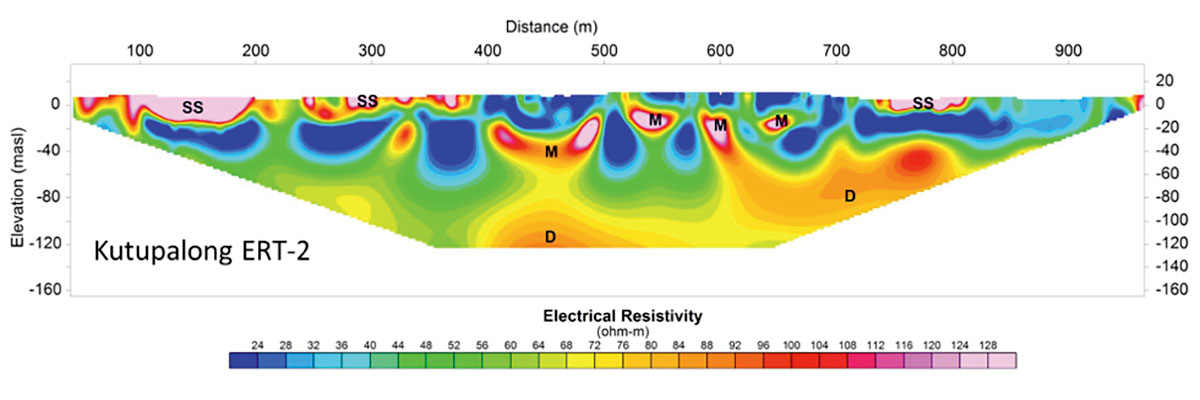
Kutupalong ERT lines 1, 2, and 3 provided an initial semi-continuous transect across the camp (Figure 9). The processed resistivity model for ERT-2 is shown in Figure 10, and provides a representative cross-section of the shallow (depths of less than 120 mbgs) geology underlying the settlements. Similar to the ERT lines from Nayapara and Leda, we interpreted relatively high resistivity zones (orange to pink colours) as sand-dominated aquifer units, and low resistivity zones (blue colours) as clay-rich aquitards. Three different types of potential aquifers were inferred: a surficial sand layer (SS), moderately deep aquifers (M), and deep aquifers (D). At the time of the geophysical survey, a few lithology logs from boreholes located north of our ERT lines indicated that the shallow geology comprised a sequence of alternating sand-dominated and clay-dominated layers (WaterAid, 2017; lithology logs shown in Figure 11).
The surficial sand layer generally only extends to depths of about 10 mbgs, and is absent in some areas of the camp. This layer is probably the primary aquifer that supplies water for the majority of the shallow tube wells in Kutupalong. Unfortunately, because it is unconfined, the surficial sand aquifer is also unprotected from surface contamination associated with human and animal waste. In November of 2017, a water quality survey by the World Health Organization (WHO) and the Bangladesh Department of Public Health of tube wells and households within Kutupalong and Balukhali found that more than 86% of water samples were contaminated with E. coli bacteria (Reuters, 2017). Major outbreaks of dangerous waterborne diseases like cholera and typhoid have been kept at bay, but only thanks to widespread vaccination campaigns in the camps (UN News, 2018).
As shown in Figure 10, the moderately deep and deep aquifers (M and D) would be far better candidates for water well installations because they are confined beneath relatively impermeable, more clay-rich layers that would inhibit surface water contamination into the underlying aquifers. Analysis of additional ERT lines 4 to 6 showed that some of the moderately deep aquifer layers we had imaged did extend to surface, which would put them at risk from contamination in some areas.
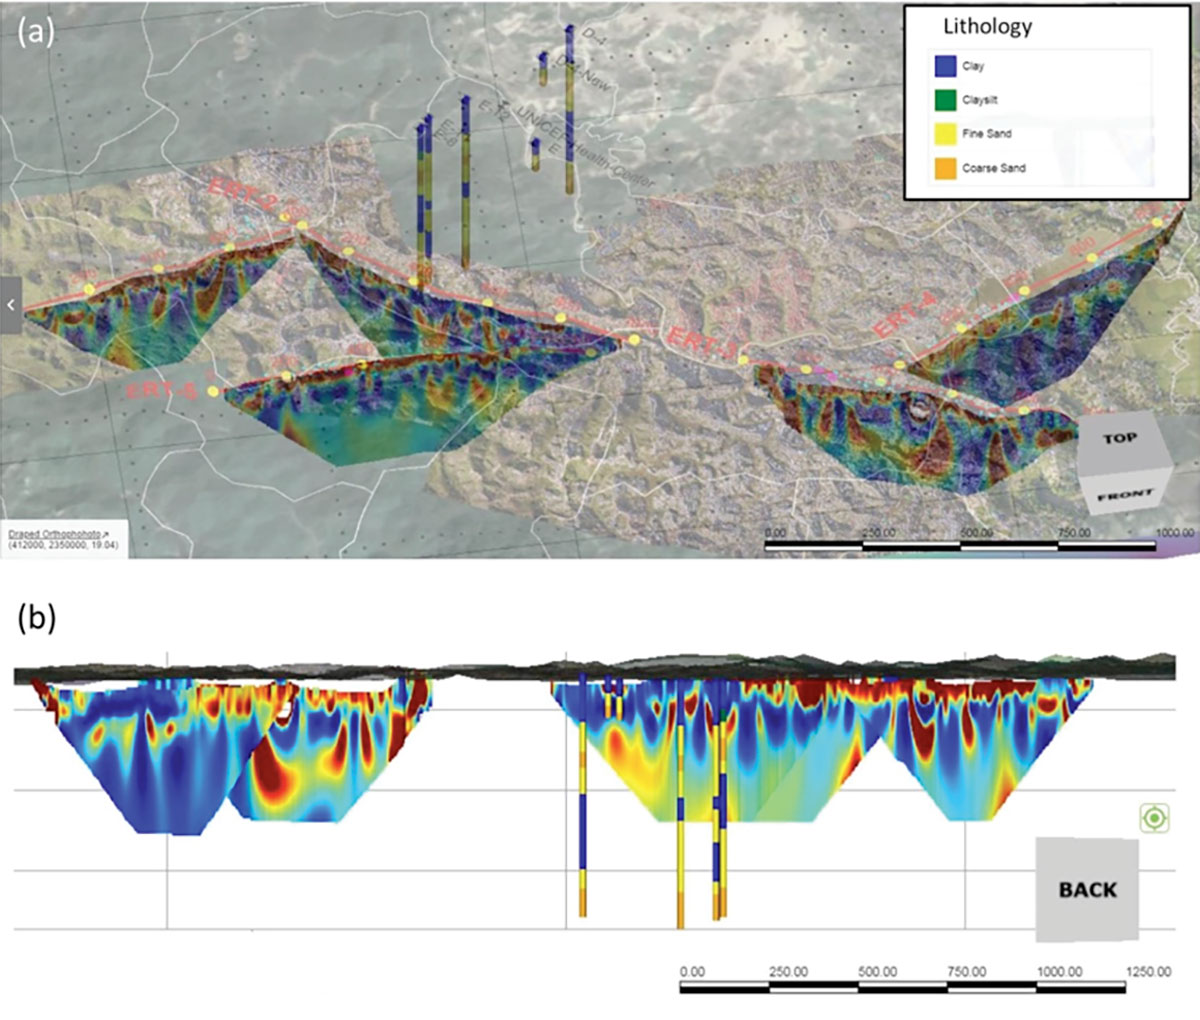
Although we were only able to survey a relatively small area of the settlement, our 3D model showed that some of the discrete resistive anomalies, that are interpreted as moderately deep aquifers, appear on overlapping lines, suggesting that they are extensive away from the survey lines and would have significant groundwater storage (Figure 11). Based on our ERT results at Kutupalong, our immediate recommendation was to focus efforts on completing new water wells into the deeper aquifers we had identified. To help direct drilling operations, we provided maps to UNHCR with proposed drilling target locations.
Unfinished business
We left Bangladesh having accomplished our mission, and provided our UNHCR WASH colleagues with a list of proposed drilling targets for new water wells. However, having witnessed the enormous logistical challenges associated with managing an emergency relief response, and without the same access to resources that would be expected in wealthier nations like Canada, our expectations were tempered for implementing sustainable water supply to the camps. If new water wells are to be effective, they will need to be installed correctly, with appropriately constructed screens and seals to maximize yields and prevent cross-contamination. Unfortunately, the materials and experience required to do so are not readily available in this far flung region of Bangladesh. Well-meaning NGOs and local contractors will make do with whatever is available: crudely constructed bamboo manual drilling rigs are used in place of heavy duty motorized rigs, and cow dung is widely used as a surrogate for polymer drilling mud. At the time of writing, we had learned that drilling of at least one of our targets had hit a water-bearing sandy unit with better than expected yields. We also learned that the reservoir at Nayapara had been expanded, increasing the surface water storage for the camp.
Even though the water supply situation is likely to improve for the Rohingya, we are also acutely aware that conditions within the camps are going to get worse, especially with the impending monsoon season. The persistent rains will partially replenish depleted aquifers and reservoirs, but they will also bring widespread flooding and landslides. The already unsanitary conditions within the camps will be further worsened by flooding, and we can only hope that the widely feared disease outbreaks will not eventuate before significant changes can be made.

Acknowledgements
We greatly appreciated the help of UNHCR’s WASH sector staff, particularly Ellen Milnes and Ryan Schweitzer. In-country support was provided by Oxfam Bangladesh and we are very thankful for the direction given by Enamul Hoque in Cox’s Bazar and Tim Forster in the UK. Geraint Burrows and Tim Van Dijk of Groundwater Relief generously provided technical advice and shared information. In the field we were assisted by students of the Cox’s Bazar Technical School and College, including Ayat Ullah Khamani, Yousuf, Mishu Kanti Dey, Rakib Hasan, Raisul Islam, Mohammed Roky. Our work in the camps would not have been possible without our two superstar drivers/ translators/security guards, Shajahan and Abdur Rauf. Advisian staff, Dan Parker and Lorian Glatiotis also helped facilitate this work.


Join the Conversation
Interested in starting, or contributing to a conversation about an article or issue of the RECORDER? Join our CSEG LinkedIn Group.
Share This Article