Surface consistent deconvolutions have become increasingly more sophisticated and as a result onshore deconvolution can be seen as a mysterious black box process. Many of the available QC displays are difficult to interpret, mainly because it is hard to display the spatial distribution of frequency- variable effects, especially with 3D data sets. Many deconvolution problems are in fact directly related to geographically well defined surface areas, and manifest themselves in well defined frequency ranges. The challenge is to present this information in a way such that deconvolution problems can be easily and intuitively identified, and then rectified. To this end, an eigen-image analysis is employed to display surface consistent deconvolution quality control information (Wang et al, 2000).
In this approach, the source/receiver components are approximated by their first eigen-component. The eigen-vector in frequency space is an eigen-spectrum, which is the most dominant feature of all source/receiver components. In the reciprocal space, source/receiver space, it has the same meaning. This will become clear with the frequency slice presentation. Both source and receiver components will reflect surface conditions in similar ways. I will focus on the source component in the discussion and illustrations.
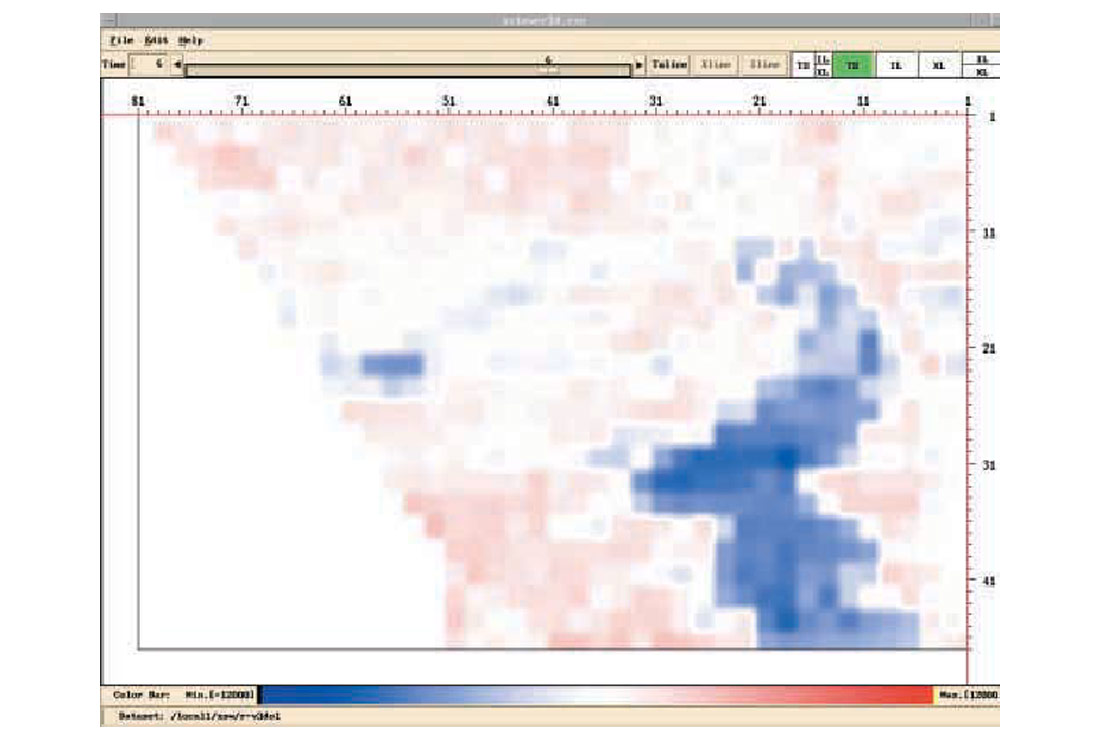
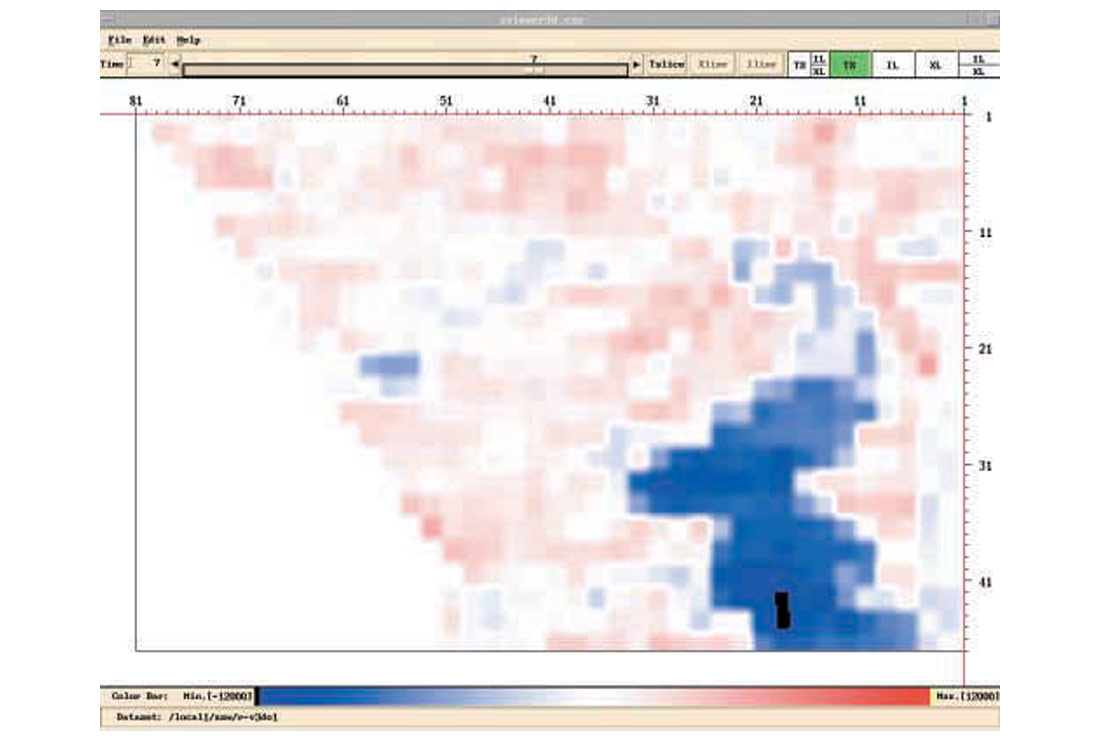
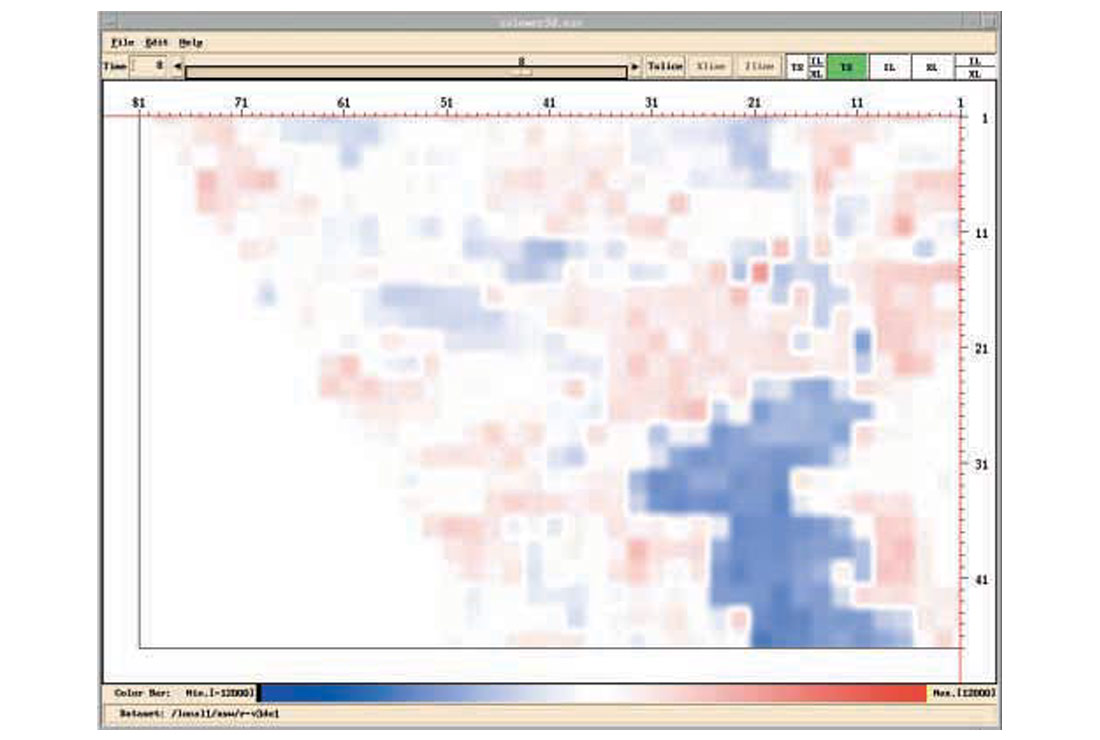
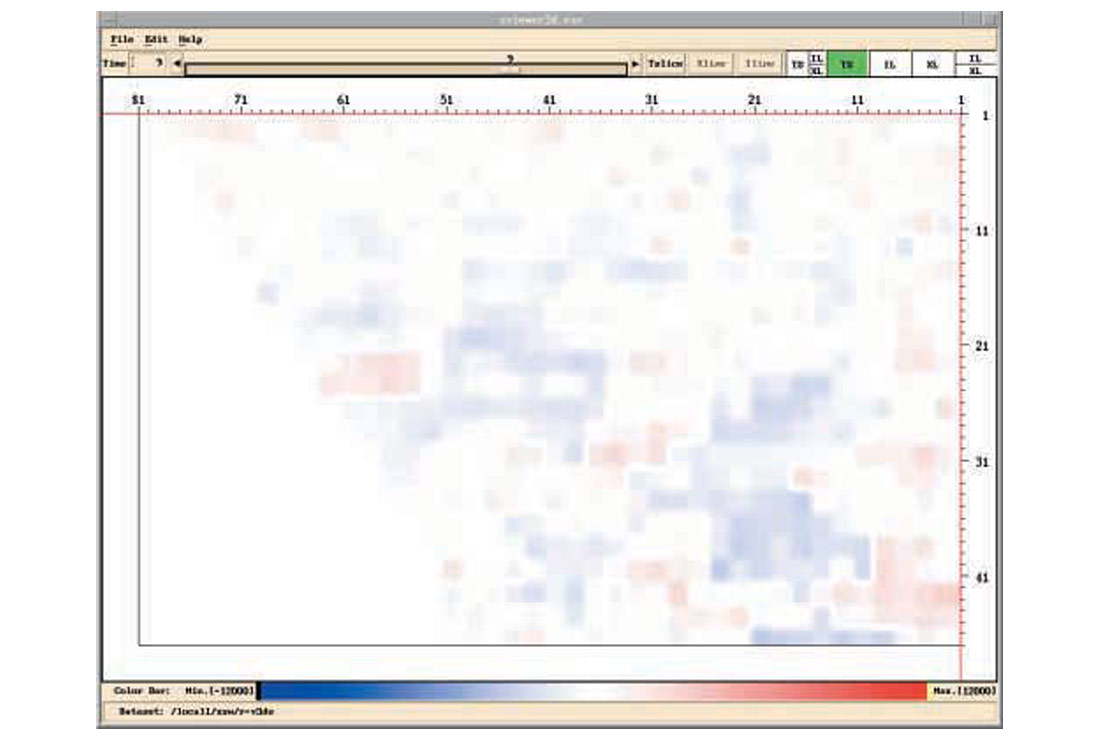
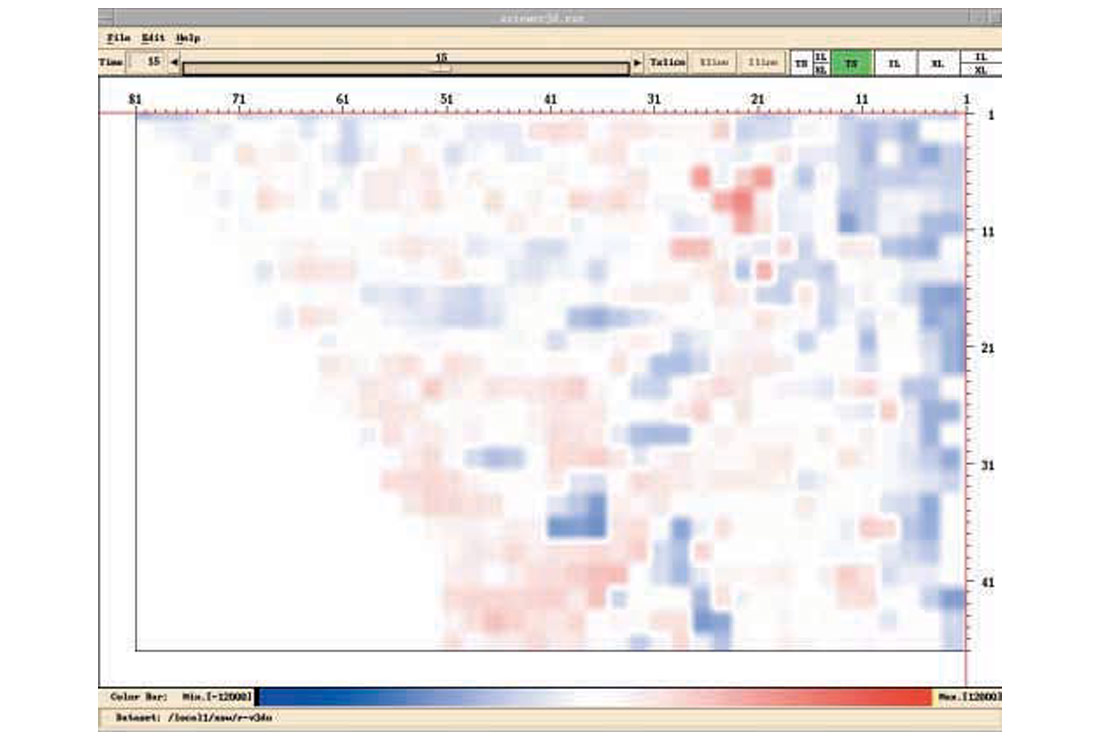
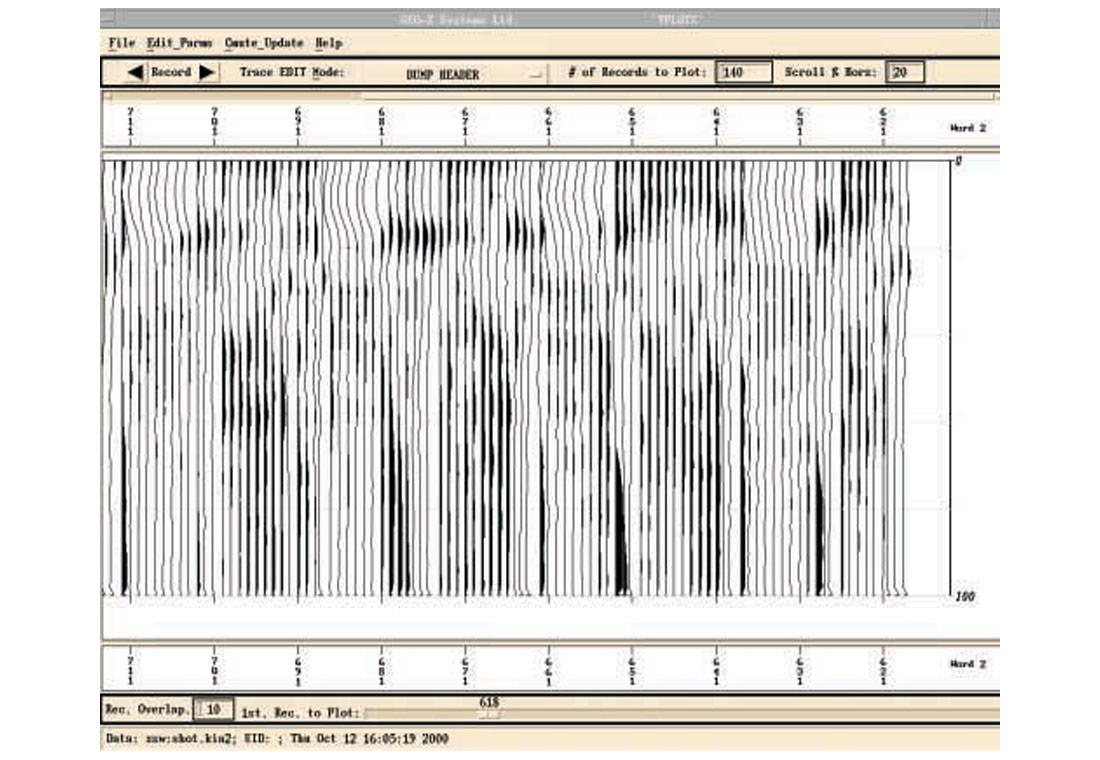
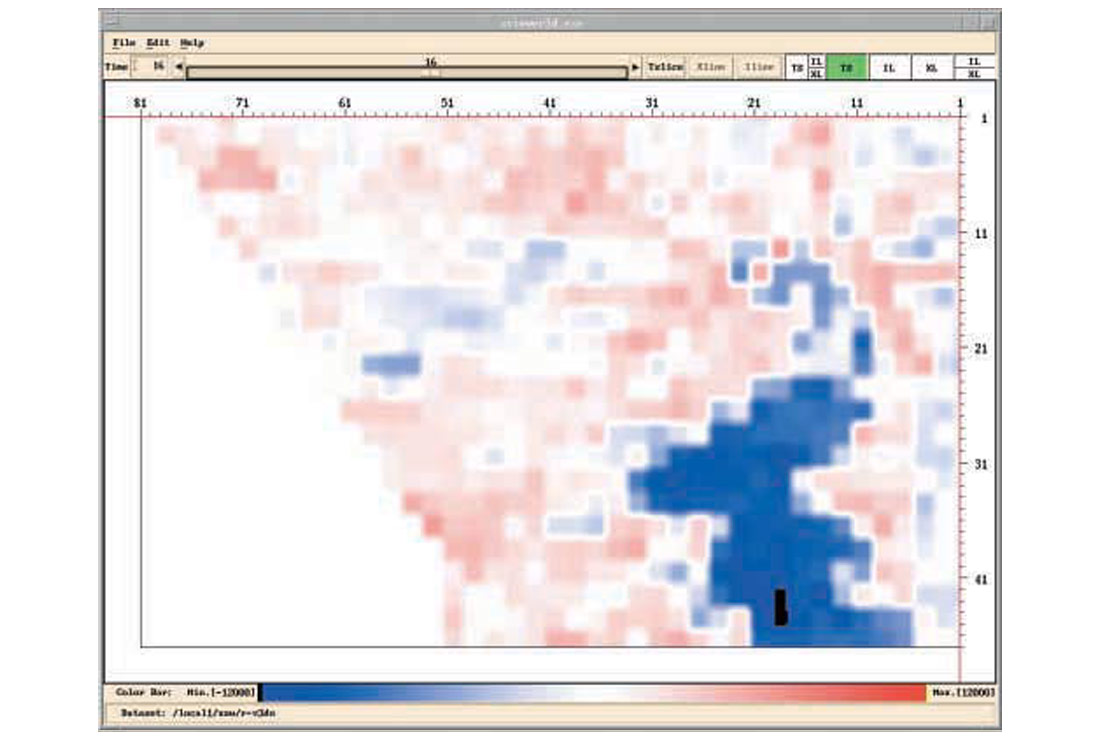
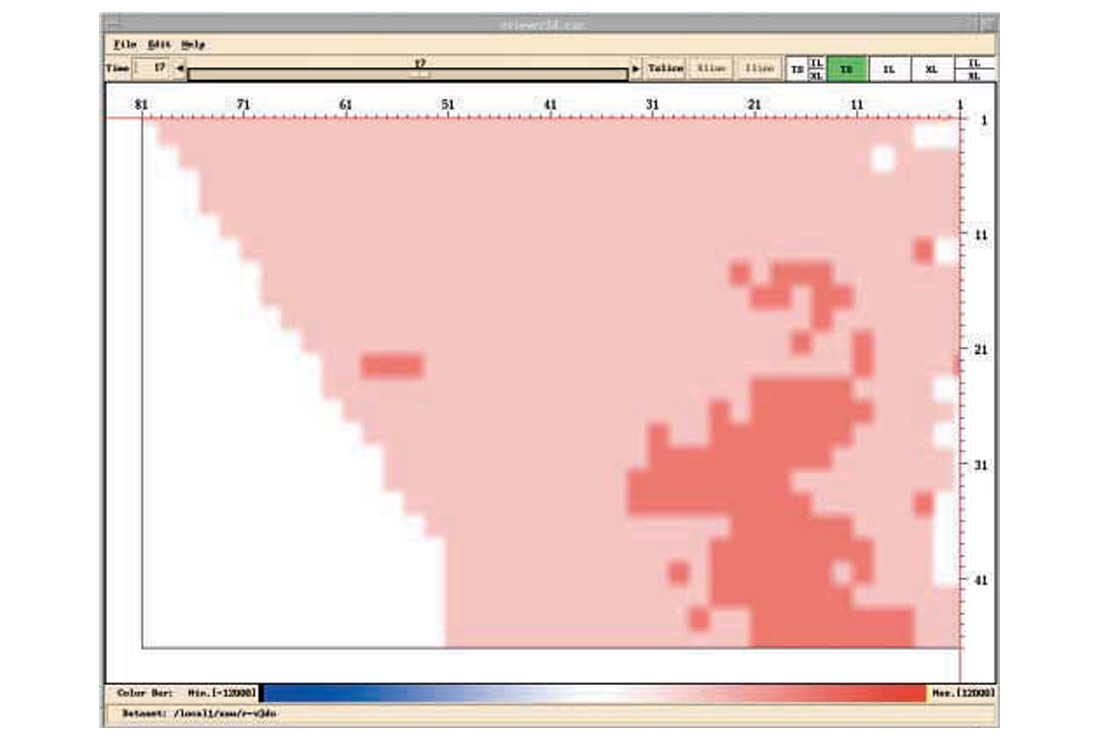
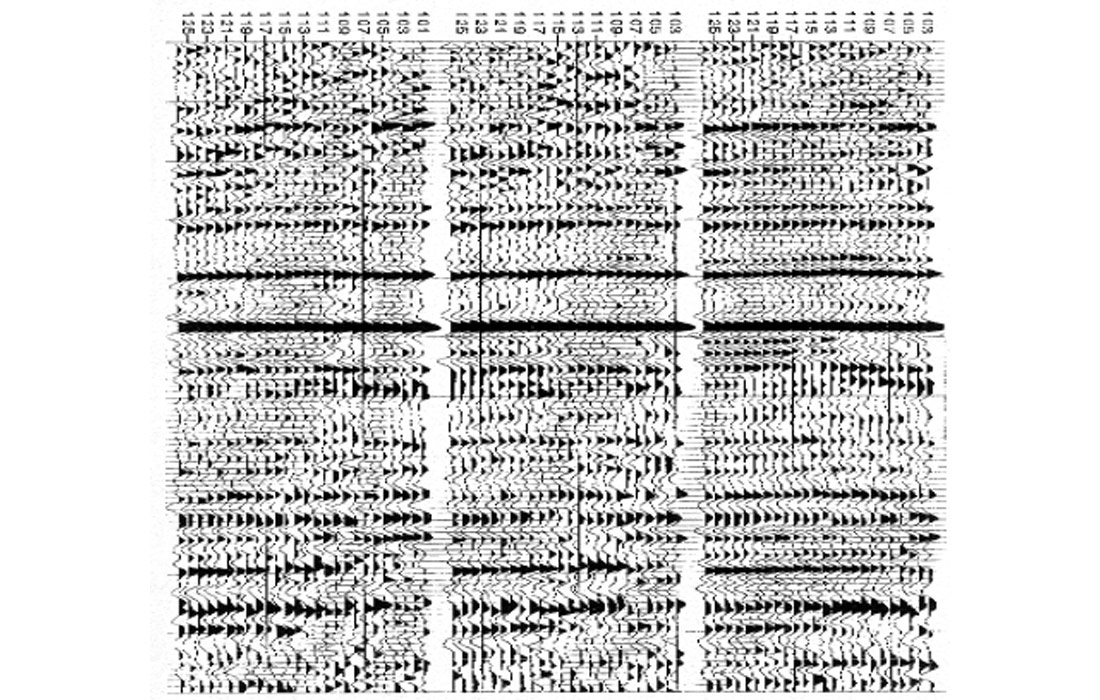
Figure 1 shows the source component db spectra of a 3D data set from a few shot lines, where a repetitive anomaly is observed, especially in the low frequency bands. To show this anomaly in map-view, frequency slices are handy. A frequency slice is the collection of db values of all source components at a fixed frequency. For 3D data, these values are presented in colour map-view. Figures 2a-2e show frequency slices at 4, 10, 16, 21, 57 Hz for the source components. If we ask for a most dominant feature of all these source component frequency slices, or the 1st eigen-image, it is shown in Fig.3. It is worth mentioning that similar features are observed in the receiver components.
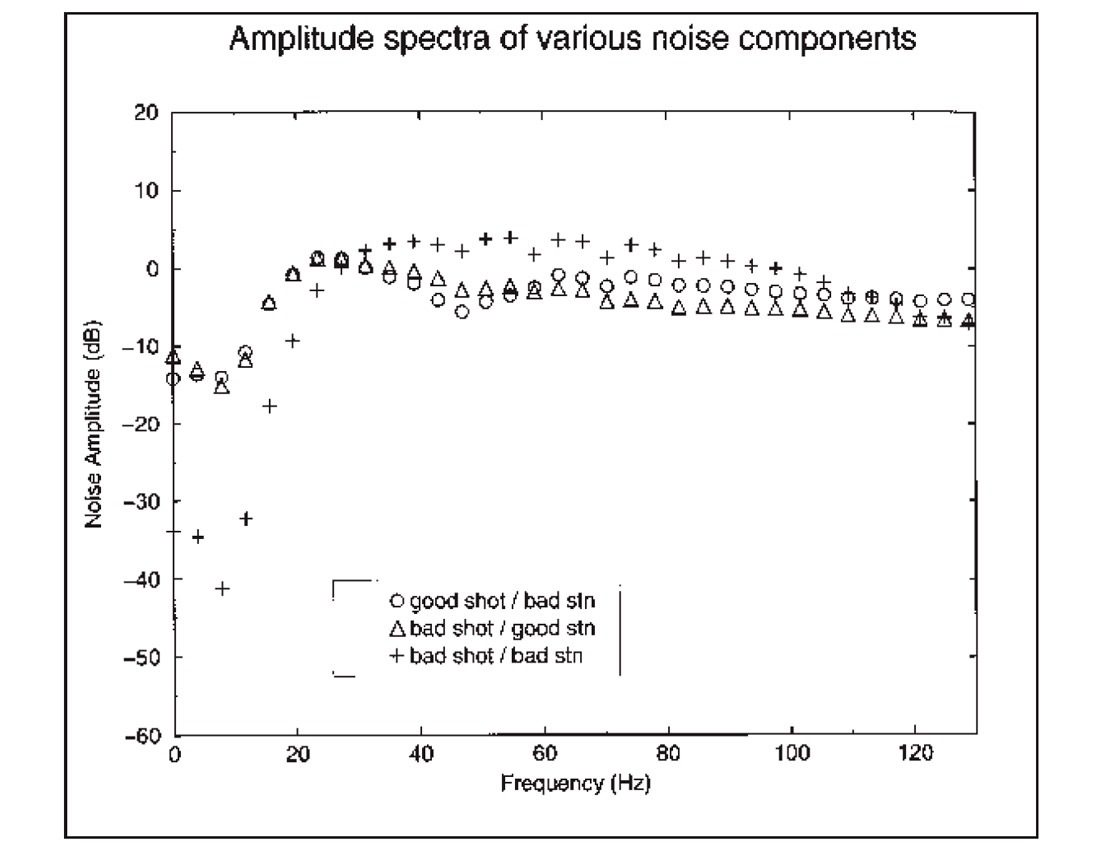
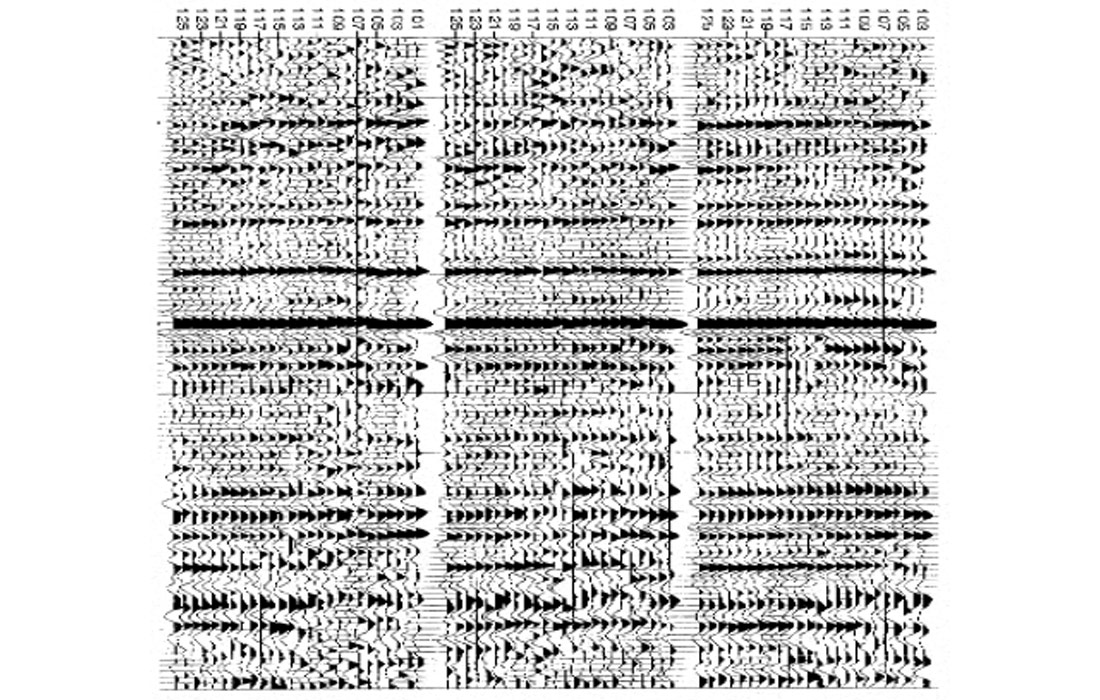
In Fig.3, each source is represented by a single scaler, which is the relative amplitude of the eigen-spectrum. Analyzing amplitudes in Fig.3, the sources are classified into two groups, color coded in Fig.4. By examining source stacks, Fig.5, the minority source group is identified as the “noisy” group. It is assumed that these sources are contaminated by similar noise. A noise model (Fig.6) in turn is estimated, and deconvolution operators (surface consistent or otherwise) adjusted with the aid of this noise model. The improvements can particularly be seen in the economic zone of interest directly below the strongest reflector on the new source stacks (Fig.7).
Conclusion
Eigen-component analysis of surface consistent db spectra can be used as a tool to identify anomalies associated with surface conditions. When such anomalies show a good correlation between source and receiver images, then a surface anomaly can be identified. Such anomalies may be supported by other information. For example, a driller’s observations of gravel will support the spatial identification of a noisy surface area. With anomalous source/receivers isolated, the remaining portions of data can be considered “clean”, and deconvolution can be improved by the noise model thus established.

Acknowledgements
I am grateful to PanCanadian Resources Ltd. for allowing the use of their data as examples.


Join the Conversation
Interested in starting, or contributing to a conversation about an article or issue of the RECORDER? Join our CSEG LinkedIn Group.
Share This Article