Earthquakes represent a significant natural hazard. Canada is no exception; damaging earthquakes have occurred historically and the seismic hazard is non-negligible in many urban areas. Fortunately, mitigation measures, such as upgrading and enforcing building codes, make structures more resistant to earthquake strong ground motions. The seismic provisions of the National Building Code of Canada are partly based on knowledge of historical earthquakes and the geological factors that favour their occurrence.
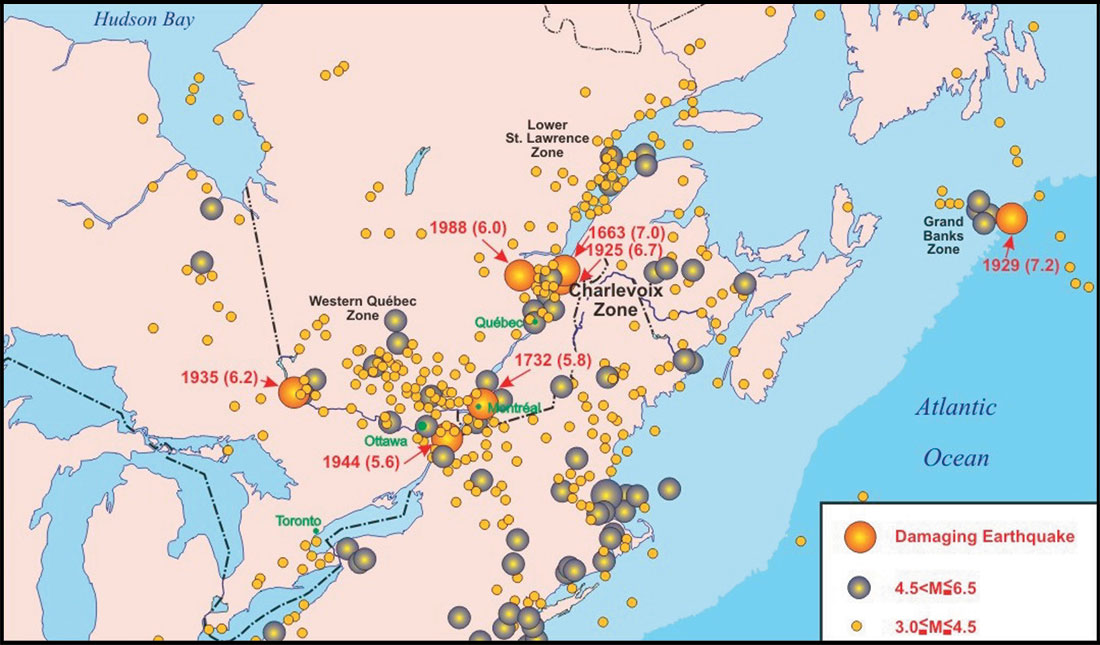
Remote sensing is a useful tool to better define the seismic hazard of earthquake-prone areas. One of these areas is the Charlevoix Seismic Zone (CSZ) of Quebec, one of the most seismically active regions of Canada (Figure 1). More than 200 micro-earthquakes are recorded there every year and five damaging earthquakes in the magnitude (M) 6 range have occurred there (in 1663, 1791, 1860, 1870 and 1925). In addition to damaging buildings in areas where soft soils amplify ground motions, some of these large earthquakes triggered landslides in Charlevoix, the Quebec North Shore, the Saguenay and the St-Maurice river, as far as hundreds of kilometers away. For the damage potential it poses, the seismic hazard of the CSZ is as high as it is in those areas of British Columbia where earthquakes are expected due to plate tectonics. The CSZ is in the middle of the North American plate and the factors that lead to large earthquakes here remain poorly known.
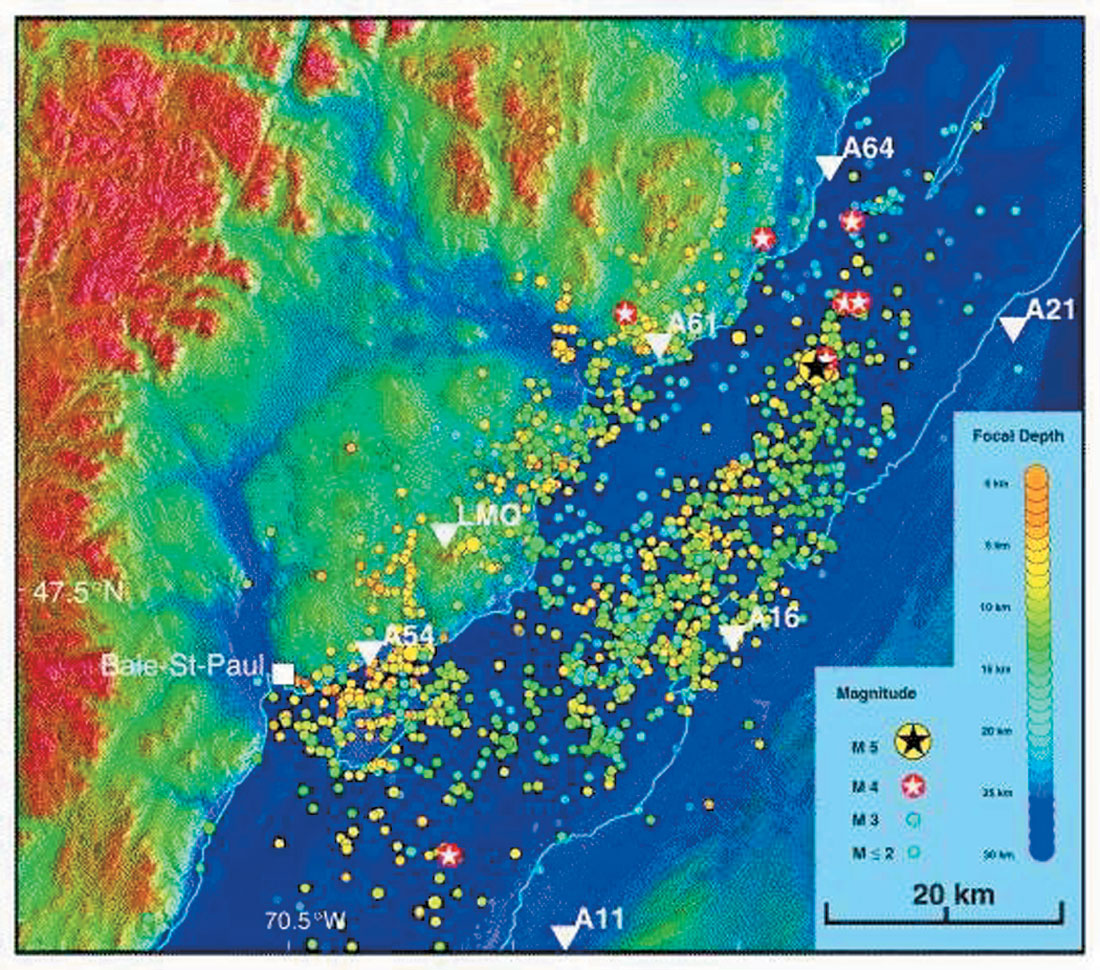
Between 1977 and 2003, the local seismograph network recorded more than 3000 earthquakes with magnitudes between -1.0 and 5.0. The epicentres define a 30 by 85 km ellipse with the major axis parallel to the St. Lawrence River (Figure 2). Most of the larger events (star symbol in Figure 2) tend to concentrate at either end of the CSZ. At depth, CSZ earthquakes occur solely in the Precambrian basement from about 5 to 30 km depth, with two thirds between 7 and 15 km. From focal mechanisms of CSZ earthquakes, it is known that most earthquakes represent strike-slip to reverse faulting on fault planes with varied orientations (Lamontagne, 1999). The CSZ was also active prehistorically, as indicated by lake disturbances and landslides. Despite these repetitive large earthquakes, no surface rupture has ever been reported in the geological maps, in the historical accounts or in the scientific reports. A seismic reflection profile across the St. Lawrence River has not revealed the existence of a rupture at the bottom of the River (Lamontagne, 2002).
CSZ earthquakes of magnitude larger than 6 had local and regional impacts; a consideration taken into account in the seismic provisions of the National Building Code of Canada (NBCC). For the St. Lawrence valley, the seismic provisions of the upcoming NBCC in 2005 are influenced by the interpretation that a link may exist between CSZ earthquakes and paleo-rift faults. Earthquakes may occur where rift faults are found along the St. Lawrence valley, despite the current low level of seismic activity (Adams et al., 1996).
On land, remote sensing imagery1, mainly radar, is central to our interpretation of geological faults. Passive remote sensing systems such as SPOT or Landsat record the energy reflected by the Earth’s surface at frequencies roughly equivalent to those detected by our eyes. Landsat images of the region were examined but did not yield any structural information not already described in geological maps. Synthetic Aperture Radar (SAR), on the other hand, is an active system that sends a microwave pulse toward the Earth’s surface and measures the amount of energy reflected with minimum interference from atmospheric conditions. For geological applications, a steep incidence angle of the beam best enhances terrain topography, which is often related to structural lineaments.
A geometric correction method developed at the Canada Centre for Remote Sensing (Toutin, 1995) is used to ortho-rectify the RADARSAT imagery with a digital elevation model (DEM) in any conformal cartographic projection, such as Universal Transverse Mercator (UTM). The method takes into account and corrects for all the distortions related to the full geometry of viewing (e.g., viewing angle of the sensor, position and velocity of the satellite, and curvature, rotation and elevation of the earth) and the map projection. The ortho-image has a final planimetric positioning accuracy of 30 to 40 m. A Gamma adaptive filter (Lopes et al., 1993) is incorporated during the re-sampling process to reduce the SAR speckle. All geographical and geological features are thus more accurately located and plotted on the ortho-rectified image. The last step is the integration of the ortho-RADARSAT imagery with the DEM to generate a 3-D chromo-stereoscopic image (Figure 2). Chromo-stereoscopy is a method which enables the display and the perception of depth from multiple sources, such as remote sensing and geoscientific data (Toutin, 1997; Toutin and Rivard, 1997). The third dimension (the terrain elevation in this study) is colour coded into the image, blue for the lowest elevation (St. Lawrence River) and red for the highest (the Laurentian mountains). The resulting chromo-stereoscopic image is a 2D colour composite image, which can be viewed and interpreted monoscopically, but which “jumps” into 3-D when viewed with ChromaDepth2 glasses.
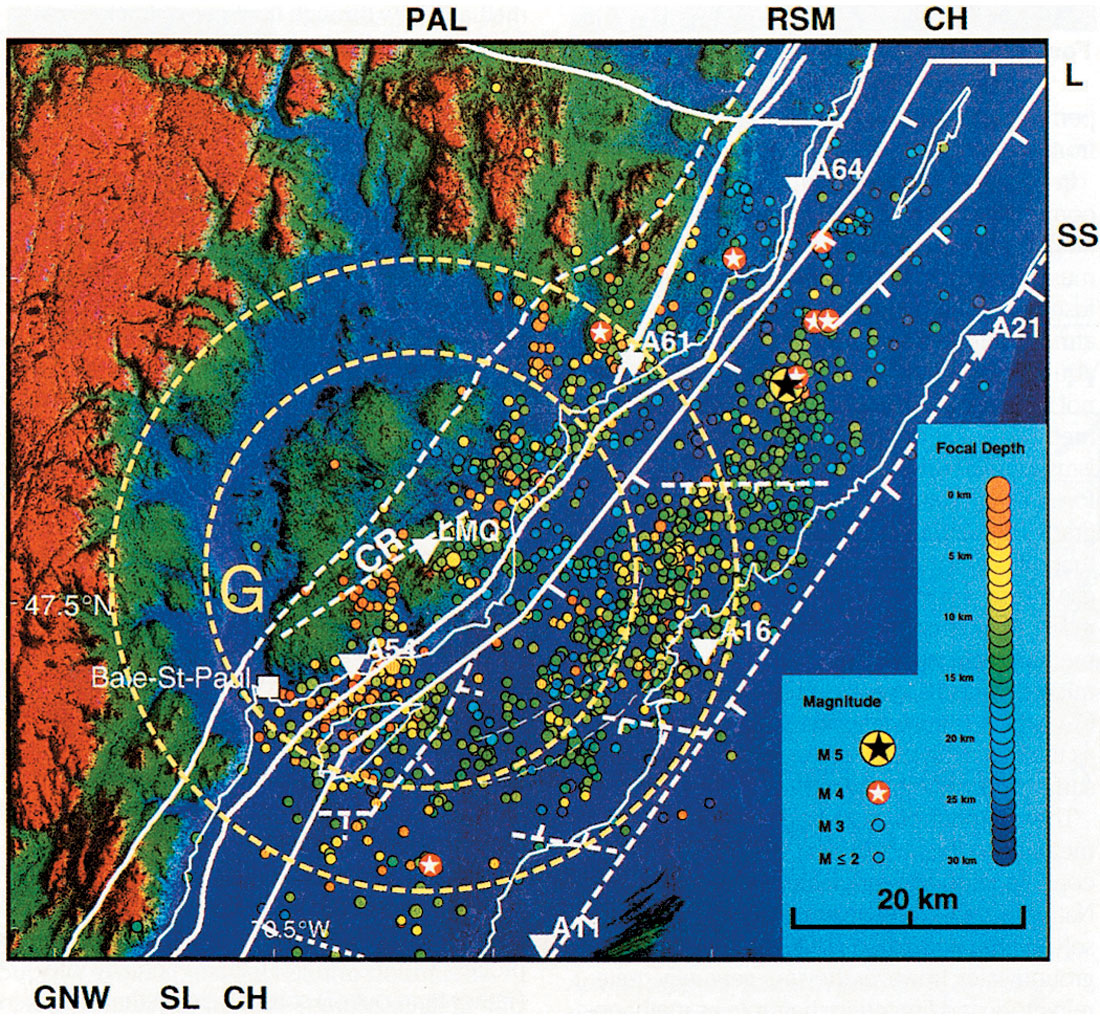
In Charlevoix, composite products that include remote sensing imagery reveal a very complex fault distribution (Figure 2). To study the faults better, a chromo-stereoscopic image (about 80 km by 90 km; 30-m pixel size) integrates a RADARSAT orthoimage with terrain elevation and seismicity, each data set with its own colour range. For the elevation, the colour range varies from 0 m in blue to 1100 m in red. The topography of the north shore is a mixture of rugged highlands, plateaus and valleys separated by dramatic changes in elevation. In the CSZ, the Precambrian basement outcrops only on the north shore of the St. Lawrence River. It is cut by faults created during at least four major tectonic events: the Grenvillian collision (1100 to 900 Ma); the rifting episode related to the opening of the Iapetus Ocean (700 Ma); the Taconian reactivation of these faults at the closing of that ocean (450 Ma); and finally, a Devonian meteor impact (350 Ma; Rondot, 1979). Large CSZ earthquakes are interpreted to reactivate Iapetan faults. Most of these faults correspond to strong lineaments in the remote sensing imagery. Beneath the St. Lawrence River, however, these structures lie hidden by several kilometres of Appalachian nappes and hundreds of meters of Quaternary sediments. Fortunately, remote sensing imagery and geophysics (seismic methods, gravity, magnetics) can highlight geological faults of the Precambrian, at the surface and at depth under the Appalachian nappes (Lamontagne et al., 2000).
Linking these faults with the earthquake activity is difficult because the earthquakes are deep and little control exists on the fault orientations at depth. Earthquakes are not distributed uniformly across the seismic zone but are concentrated in groups separated by less active areas. The three large regional faults, the St-Laurent, South Shore and Charlevoix faults, seem to bound active volumes rather than being active themselves (Figure 3). For lower magnitude earthquakes, smaller fractures with various orientations might be reactivated by local stresses. A simultaneous hypocentre-velocity inversion has revealed that hypocentres occur in rocks that surround the lowest velocity regions and tend to avoid those with high velocity (Vlahovic et al., 2004).
The complexity of CSZ seismicity can be explained by a combination of factors. The CSZ does not appear to be subject to substantially higher stress difference levels than the rest of Eastern Canada. Consequently, the earthquake activity must be due to inherent crustal weakness and/or high pore fluid pressure. We can imagine CSZ fault zones to be irregular surfaces surrounded by highly fractured rocks. These highly fractured zones respond primarily to regional stresses; however, for some smaller events, they may respond to local changes in stress and/or strength. The whole process can be enhanced, especially for deeper events, by high pore-fluid pressures in fault zones. Some rift faults may act as conduits to crustal fluids under pressure, triggering earthquakes on these faults and in neighbouring fractured volumes. Similar ideas are suggested for earthquakes of the Lower St. Lawrence Seismic Zone, located in the estuary of the St. Lawrence River (Figure 1; Lamontagne et al, 2003).
The absence of any apparent CSZ surface rupture suggests that the current rates of seismic strain release are geologically recent. Had these rates existed over millions of years, evidence of this activity would have been mapped in the field and seen in the seismic reflection profiles. The earthquake activity likely started some thousands of years ago, possibly right after the last glaciation, when conditions were most favourable for reverse faulting in the CSZ. In all likelihood, the current conditions that create CSZ earthquakes may persist for thousands of years in the future. The current stress field depends mainly on factors that change on geological time scales, such as plate motions and, to a lesser extent, postglacial rebound and other stress contributors that will continue to play a role for thousands of years to come.
In terms of disaster response, what can be expected of future damaging CSZ earthquakes? A repeat earthquake of the 1663 M~7 earthquake would seriously damage towns located in the epicentral region on both shores of the St. Lawrence River. It would probably cause landslides at hundreds of kilometers distance and seriously damage parts of Quebec City where soft soils amplify ground motions. In such a large earthquake, Earth Observation information can be helpful to manage the emergency situations.
Recent studies have demonstrated that optical remote sensing can be used to assess physical damage in urban areas. High-resolution optical sensors such as IKONOS-2 (0.80 m resolution) and QuickBird (0.61 m resolution) are both capable of imaging the Earth surface with a spatial resolution of better than one meter on the ground. These systems provide images sufficiently detailed to locate collapsed buildings (Chiroiu and André, 2002; Adams et al., 2003). This information is important for relief agencies (rescue teams) that need to quickly locate potential victims and map structures at risk. One drawback of these systems is that they are far from being near-real-time services and they depend on cloud-free conditions. This situation may change as European countries and China are preparing to launch constellations of small satellites for monitoring the Earth surface at high repeat cycles.
To complement these optical systems, interferometric SAR techniques (InSAR) from space borne radar sensors can be used to map changes in the Earth’s surface topography and obtain ground displacement (Zebker, 2000; Toutin and Gray, 2000). Radar sensors have the advantage of operating in all-weather and night conditions. These methods offer ways to map damage and earthquake impacts. They can also be used to map the co-seismic surface displacement and have been used with success with the 1992 M 7.3 Landers, California, earthquake (Massonet et al., 1993). InSAR is also useful in the response phase as ground displacement can correlate with damage in built environments (CEOS, 2001). InSAR can also contribute to the mitigation phase by adding to the spatial understanding of fault mechanism dynamics and strain, an aspect that could be used in seismically active areas such as the CSZ. This information could complement information collected on the g round by GPS networks, for example.
In conclusion, there are still many questions raised by the earthquakes of the Charlevoix Seismic Zone. Among others, why are the earthquakes occurring so frequently there when similar faults a re found elsewhere along the St. Lawrence River? Image pro ducts that include remote sensing imagery have helped defining some characteristics of these faults. Remote sensing will also be useful for emergency organizations when one of these faults, one day, will be reactivated in a large damaging earthquake.


Join the Conversation
Interested in starting, or contributing to a conversation about an article or issue of the RECORDER? Join our CSEG LinkedIn Group.
Share This Article