Introduction
Whenever a new exploration play is brought to a geophysicist the question of its seismic explorability is posed. This question must be answered quickly and accurately because the explorability determines how the play will be pursued or even if it will be pursued. Given the current interest in lithology and fluid prediction through AVO attribute analysis, an estimate of a new play’s AVO sensitivity is critical. It is very important to know what technology is to be useful. However, given the complexity of AVO attribute analysis, this is often difficult to know a priori in prospect evaluation.
The applicability or usefulness of AVO attribute analysis can be estimated from rock petrophysical conditions. The rock petrophysical conditions may be characterized by defining a set of rock properties that exist for the lithologies possible within the context of the play. The explorability consequently is considered as a measure of the sensitivity of these rock properties. What is really needed is a way to evaluate the sensitivity of the rock properties and to find the best AVO attributes for description of the reservoir.
In order to achieve this goal, an efficient and intuitive method is required for grasping and comparing the sensitivity of relevant rock properties with respect to lithology variation, fluid and rock composition. We present both a study and a methodology that addresses this issue. This includes: quantitative comparison of absolute and relative variations of various rock properties; providing methodology for enhancing and optimizing the resolution of rock property attributes; and addressing the link between rock property sensitivity and seismic responses.
Sensitivities of rock properties
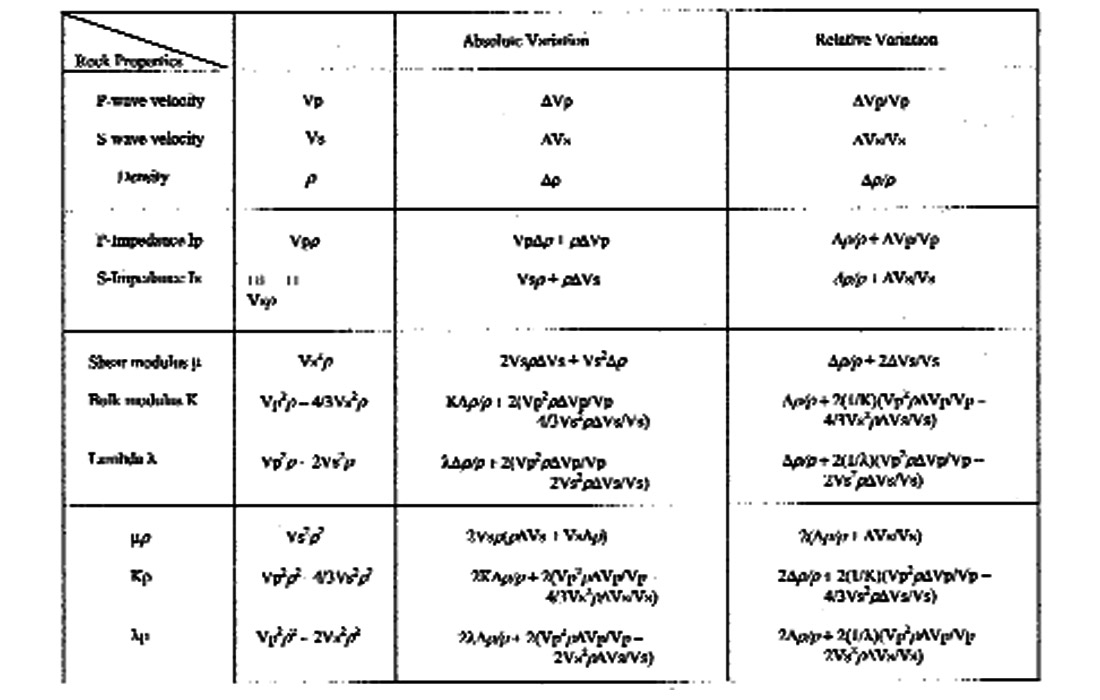
Lithology contrast and sensitivity of reservoir rocks with respect to fluid content are of importance. For instance, tight sand is insensitive to gas saturation in comparison to porous sand. The sensitivity is determined by the variation of basic rock properties: velocity and density. Other rock properties such as impedance and elastic moduli are derived from these basic rock properties. Individual rock property responds differently or has different sensitivity to a given lithology contrast or fluid variation. Table 1 lists commonly used rock properties in seismic analysis with their absolute and relative variations, which are a function of velocity and density. The absolute variation is a measurement of absolute contrast of rock properties. Its counterpart, relative variation, refers to the change with respect to background value of a rock property. Seismic reflectivities are a measurement of relative variation. The measurements that are often used in AVO analysis are velocity reflectivities, P- and S-reflectivities, Poisson’s reflectivity, and recently developed λ and μ. In Table 1, it can be seen that with given variations of velocity and density the sensitivity increases from impedances to elastic moduli (shear modulus μ, bulk modulus K, and elastic parameter λ) and finally is greatest for μρ, Kρ, and λρ. This is due to both velocity and density positively reinforcing nonlinearly. For example, the relative variation of impedance is the sum of the individual variation of density and velocity. Squared velocity or density will double this contribution. An apparent example is that the relative variation of μρ is twice of that of S-impedance. Similar relationships exist for ratio type of rock properties such as Vp/Vs ratio, Poisson’s ratio σ, K/μ and λ/μ ratio.
Sensitivity enhancement of rock properties responding to fluid or lithology contrast can be achieved through mathematical manipulation between rock properties. Figure 2 illustrates how the resolution of gas sand and sand/shale contrast could be changed from Kρ domain to λρ – μρ domain. This is a process similar to or equivalent to a coordinate transformation with Kρ subtracting different amounts of μρ. The resolution of gas sand is enhanced in λρ and μρ space due to a low value of λρ giving a better contrast between sand and shale. Identifying gas sand in λρ and μρ space (Goodway et al., 1997) has been proved successful. The degree of the orthogonality between any two lithologic units is the key for measuring the contrast. Improvement of contrast between gas sand and shale or other lithologic units is decided by their μρ values. For example, high contrast could be obtained if the μρ values of the sand is greater than that of the shale. In Kρ – μρ and μρ space, gas sands may have negative Kρ – μρ values. This is a useful criteria for quantitatively identifying gas sand because K- μ ≈ 0 is considered as the relationship for wet sand (Castagna et al., 1993). In λρ – μρ and μρ space, all sands including shaley sand will have negative values and shales may have relative constant positive values. Consequently, this is a space useful for identifying sand units.
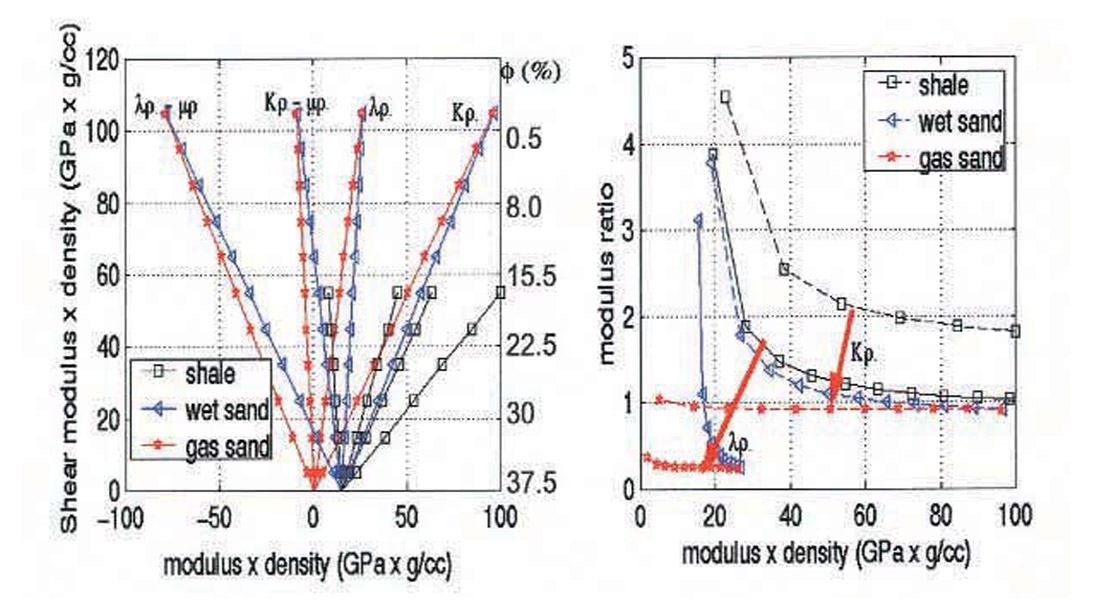
One of the important issues in seismic interpretation is how sensitive is the rock in response to pore fluid. An apparent example is that tight sandstone may have a Vp/Vs ratio very close to that of porous sandstone charged with gas. At the same time, the velocity and density of the tight sand become insensitive responding to the pore fluid. This is illustrated in Figure 1 where tight sand is shown to have little room to vary in both modulus and ratio domains.
Example
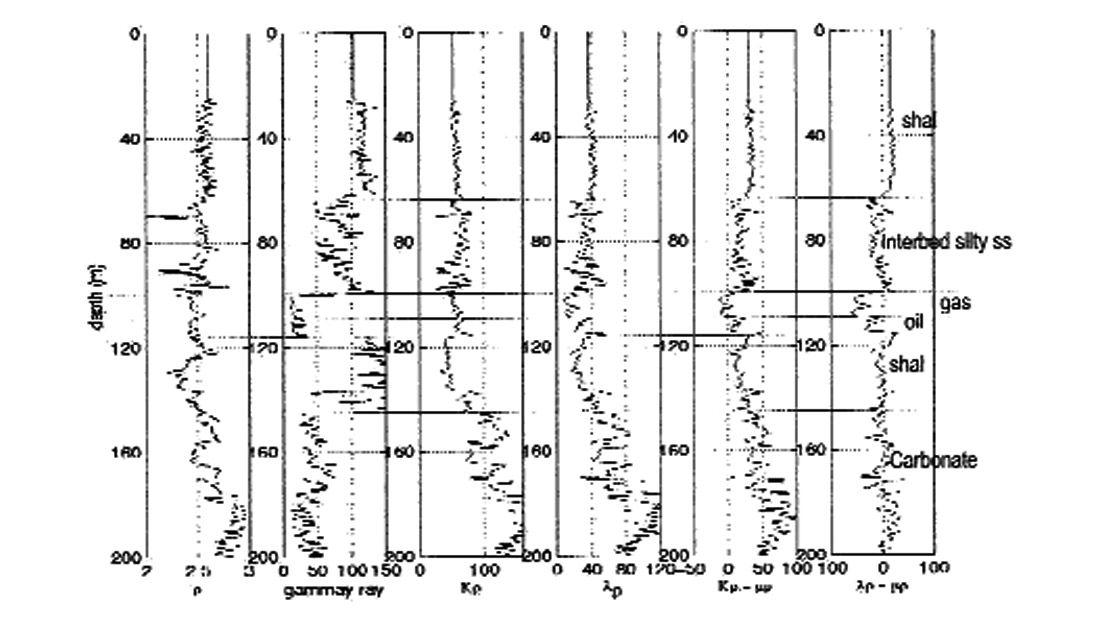
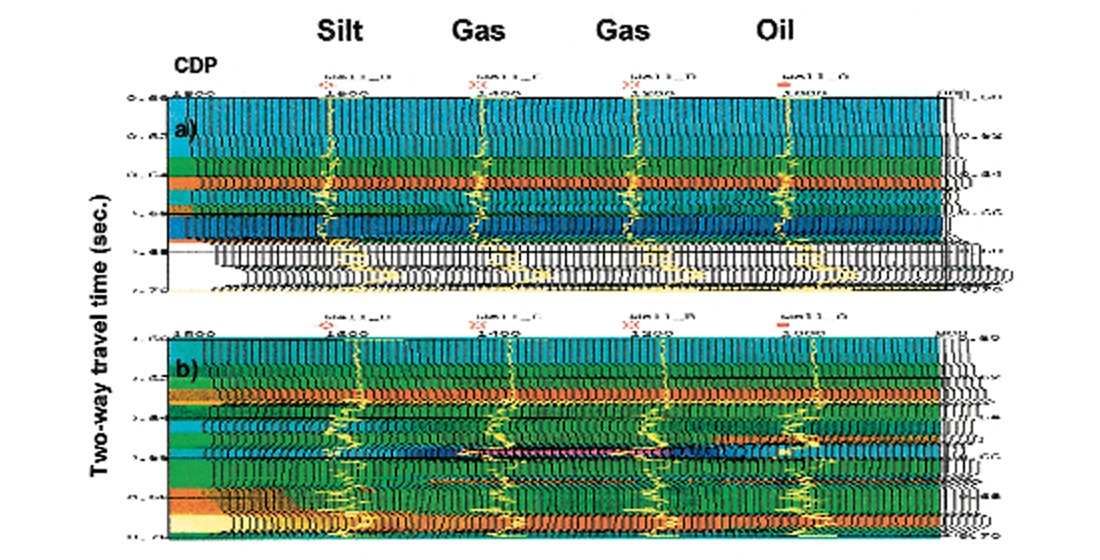
Figures 2 and 3 show an example of well logs in various modulus and ratio domains. The geologic sequence consists of shale, inter-bed silty sand, thin coal beds, gas sand, oil sand, and carbonates. In the Kρ domain, the contrast between sand and the inter-bed silty sand is poor. It increases from the left to the right and reaches its the highest in the λρ – μρ domain. Assuming this well represents an exploration play, Kρ – μρ and λρ – μρ would be the best elastic attributes chosen to identify gas and oil. In λρ domain, the gas charged sand unit is separated from silty sand and underlying shale, but the oil sand unit has poor contrast to underlying shale. This is improved in Kρ – μρ and λρ – μρ domains. Notice that gas sand has a low value in λρ domain and negative values in Kρ – μρ domain. In λρ – μρ domains the reservoir sand and silty sand all become negative. All these are consistent with what is illustrated in Figure 1.
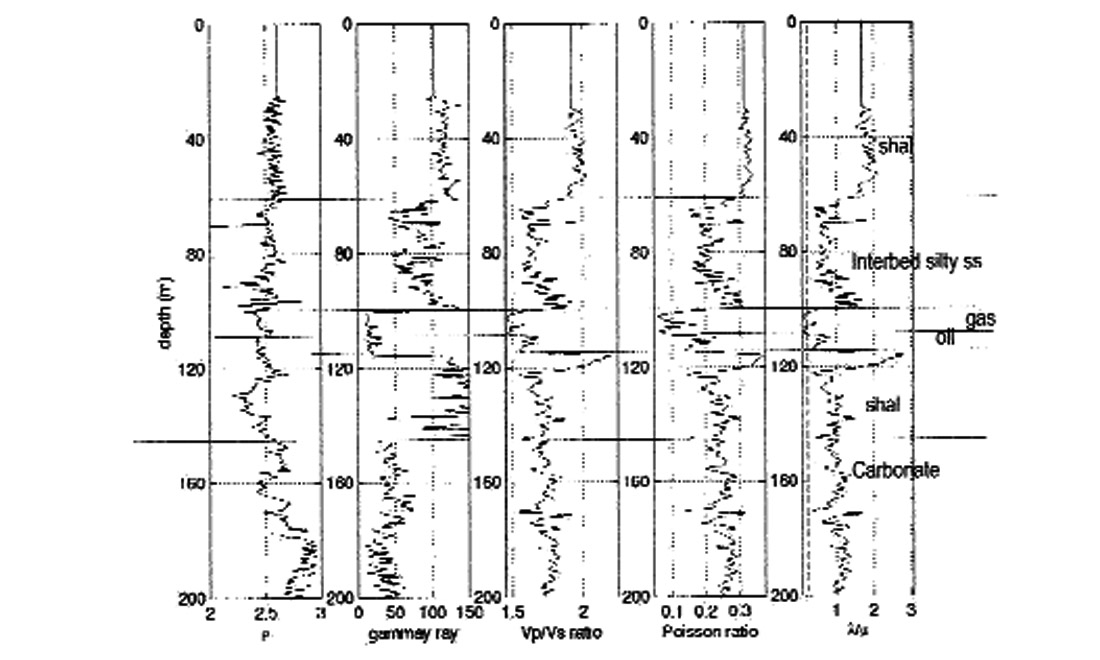
The ratio related rock property attributes are shown in Figure 3. Apparently, Vp/Vs ratio and λ/μ ratio present the same contrast between the lithologic units although the latter has larger dynamic range. Poisson’s ratio, here, produces the best contrast for gas and oil sand.
The results of AVO modeling and inversion for this well, a wet and an oil well indicate that (λ – μ)ρ gives the best contrast for this play (Figure 4).
Conclusions
In this study, it is demonstrated that the sensitivity of rock properties is of great importance in AVO analysis and the interpretation of well logs and seismic. Recognizing the differences in sensitivity and their seismic response aids in the determination of the explorability of a play and the determination of the best seismic attributes to describe a reservoir.


Join the Conversation
Interested in starting, or contributing to a conversation about an article or issue of the RECORDER? Join our CSEG LinkedIn Group.
Share This Article