Summary
The possible use of attenuation measurements for time-lapse seismic monitoring of an EOR steam flood project in Saskatchewan, Canada is investigated. A VSP survey was used to calculate Q. These values were input to a synthetic seismogram attenuation modeling program that showed there should be an observable increase in attenuation after steam injection. Two seismic lines shot at the same location nine years apart were analyzed to see if attenuation anomalies were apparent. The results indicate a strong anomaly on the recent seismic line that is consistent with the location of steam injection. A weaker anomaly on the older line is consistent with the amount of steam injected at that time. Theoretical and laboratory analyses of compressional velocity as a function of changes in temperature, pressure, fluid type and fluid phase suggest there should be a measurable effect on compressional wave amplitude, isochron, and frequency response.
Introduction
The Pikes Peak field was discovered in 1970 in east-central Saskatchewan. Production is from the Lower Cretaceous Waseca formation that is a predominantly quartz, well-sorted channel sand of 33% porosity. It is about 500 m deep and 10 to 30 m thick. The oil is 12 degree API with a GOR of 15. Initial attempts to produce the viscous oil resulted in high sand production. Cyclic steam stimulation (CSS) was initiated in 1981 giving recoveries of 25% to 30%. Steam flood has given recoveries up to 60%.
Knowledge of the location of cold areas, swept zones, and steam fronts can greatly assist in heavy oil production. Seismic monitoring of steam flood has been successfully implemented at several locations worldwide (e.g. Jenkins et al 1997). Changes in pressure, temperature and saturation affect velocity, density and attenuation and thus alter the seismic response suggesting the possibility of seismic monitoring. Dilay and Eastwood (1995) show the use of attenuation in seismic monitoring of a very similar heavy oil sand.
In 1991 a 2D seismic survey was shot to help delineate the field. In 2000, a single multi-component line was shot at the location of one of the original lines to help evaluate the potential for seismic monitoring. A VSP survey was also recorded at a nearby well. Here, we evaluate this data for attenuation and its potential use in reservoir monitoring.
Theory
Detection of hydrocarbons from seismic data has improved through measurement of changes of the elastic properties of rocks. The presence of fluids can cause porous rocks to behave anelastically resulting in attenuation of seismic waves. Detection of anomalous attenuation has been used for hydrocarbon detection (Mitchell, 1996; Martin, 1998; and Dasios, 1998).
Attenuation can be caused by frictional sliding, scattering and motion of the fluid relative to the rock frame. In porous rocks, attenuation is affected by pressure and fluid mobility (Batzle et al, 1996). Fluid mobility is affected by modulus, viscosity, and saturation and is greatly enhanced by the presence of gas. CSS causes gas saturation to increase due to steam injection and liberation of gas during production as the pore pressure drops below the bubble point.
The detection of attenuation from surface seismic data is complicated by noise and wave propagation effects. Here, we look for changes in the centroid frequency (Barnes, 1993; Cohen, 1995; Quan and Harris, 1997). The centroid or average frequency of a spectrum A(f) is defined as

A local zone of increased attenuation causes a relatively greater decrease in amplitude at higher frequency resulting in a decrease in centroid frequency. Zones of increased fluid mobility should cause an increase in attenuation and an anomalous decrease in centroid frequency.
Method
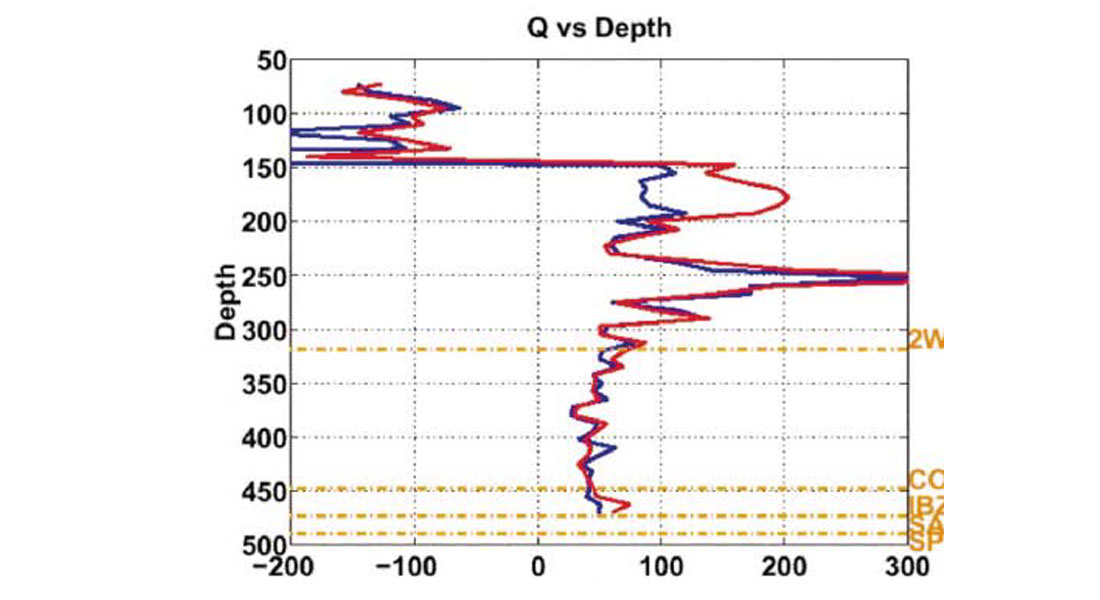
A vertical VSP survey was used to obtain values of Q. Spectral ratios of the amplitude spectra of the down-going arrivals at geophones of 90 meter separation were computed in a continuously sliding window to total depth. Q values were also computed from centroid frequency and spectral variance (Quan and Harris, 1997) (Figure 1). There is a good correlation between Q as derived by the two methods. The negative values of Q above 150 meters could be related to a change in casing size. A trend through the two curves was picked to extract Q for input to synthetic seismic modeling.
Synthetic seismic modeling was performed using the sonic and density logs from the well. These logs were extended for modeling purposes by adding the deeper portion of a well log from a nearby well that was representative of the regional geology. Logs were converted to time and a Q was assigned to each time sample. Wavelets were created for each time reflection coefficient using an adaptation of Kjartansson’s (1979) constant Q method. Input wavelet bandwidth was about 10-150 hertz. This is consistent with the bandwidth of the vibrator source. Macrides (1987) measured a Q of 10 for a similar steam flooded sand by means of tomography. This value was used to create a second set of wavelets to simulate steam injection in the reservoir. Centroid frequency and variance of the wavelets were extracted and used to calculate Q (Figure 2).
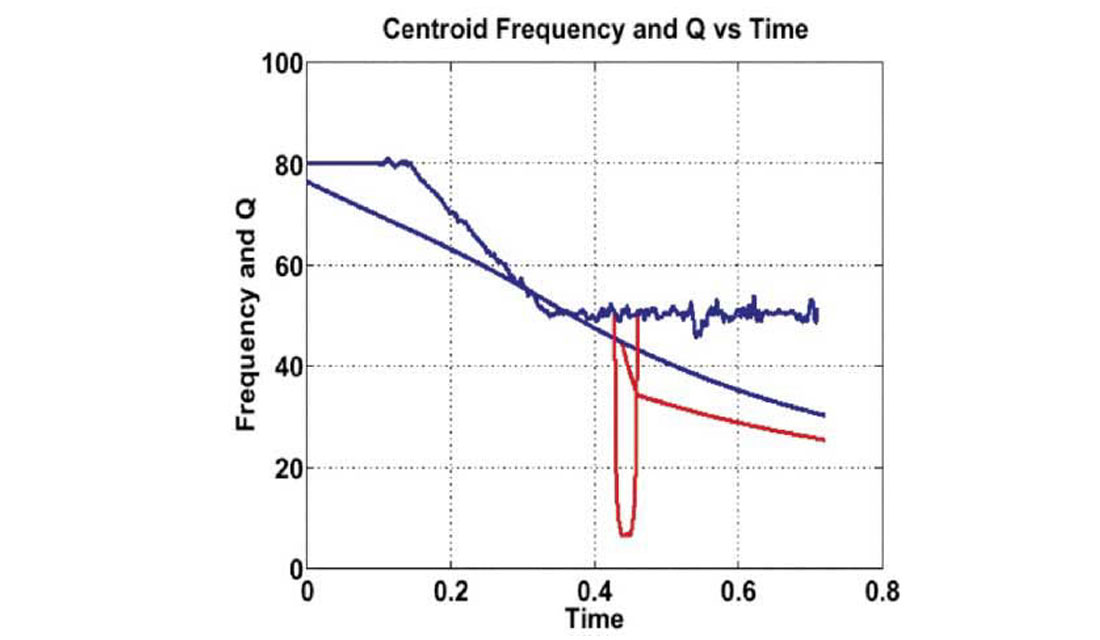
A significant decrease in centroid frequency occurs at the steamed zone. Results of acoustic velocity tests of a core sample from the reservoir showed a velocity reduction of about 25% when the heavy oil-saturated sample was steam injected. The reduced Q and acoustic impedance values were introduced to an estimated attenuation zone thickness of 20 meters in the sand to create the synthetic. Windows were selected above and below the steamed zone and the average Q between the windows was calculated using spectral ratios and centroid frequency and variance.
| No Steam | Steam | |
| Spectral Ratio | 73.7 | 62.2 |
| Centroid Freq. | 66.8 | 56.1 |
Both methods indicate about a 15% decrease in the interval Q. The synthetic traces and acoustic impedance log are shown in Figure 3.
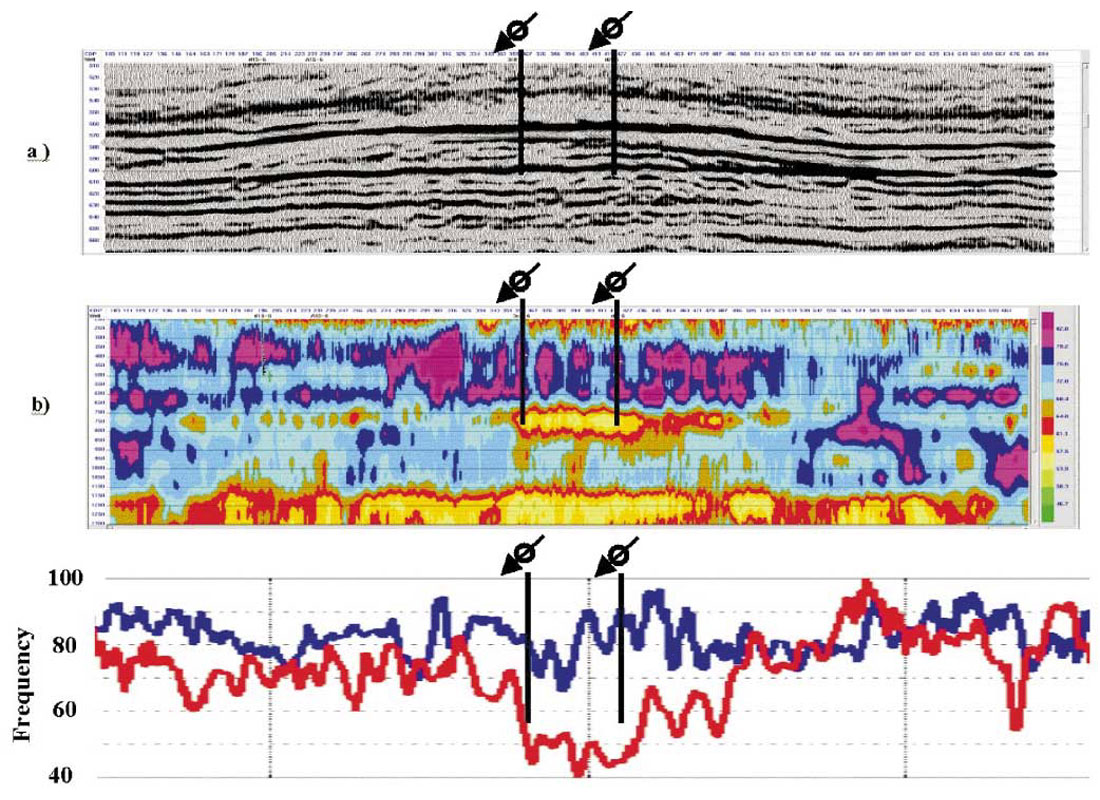
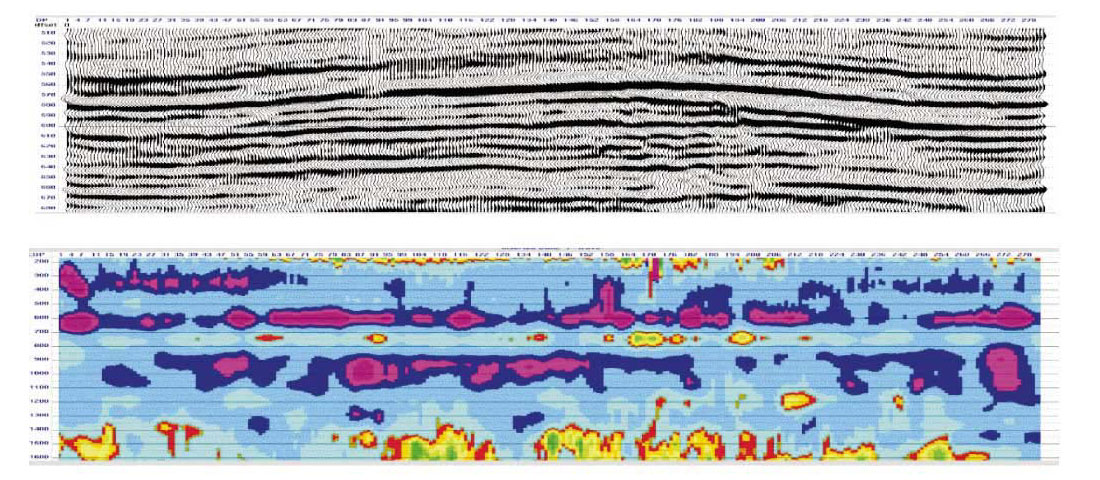
The two seismic lines were analyzed to highlight any attenuation anomalies related to steam injection. Sections of centroid frequency were calculated using spectra from a short-time Fourier transform (Cohen, 1995). Final migrated sections were used for the analysis. The recent seismic line (Figure 4a) indicates a relatively uniform geology above and below the channel. Thus, changes in centroid frequency due to lateral changes in reflectivity should be minimal. Transmission effects of the steam zone on the wavelet were not investigated. The consistency of the observed effects with the constant Q model predictions suggests that other attenuation mechanisms are not significant. The location of two steam injection wells is indicated.
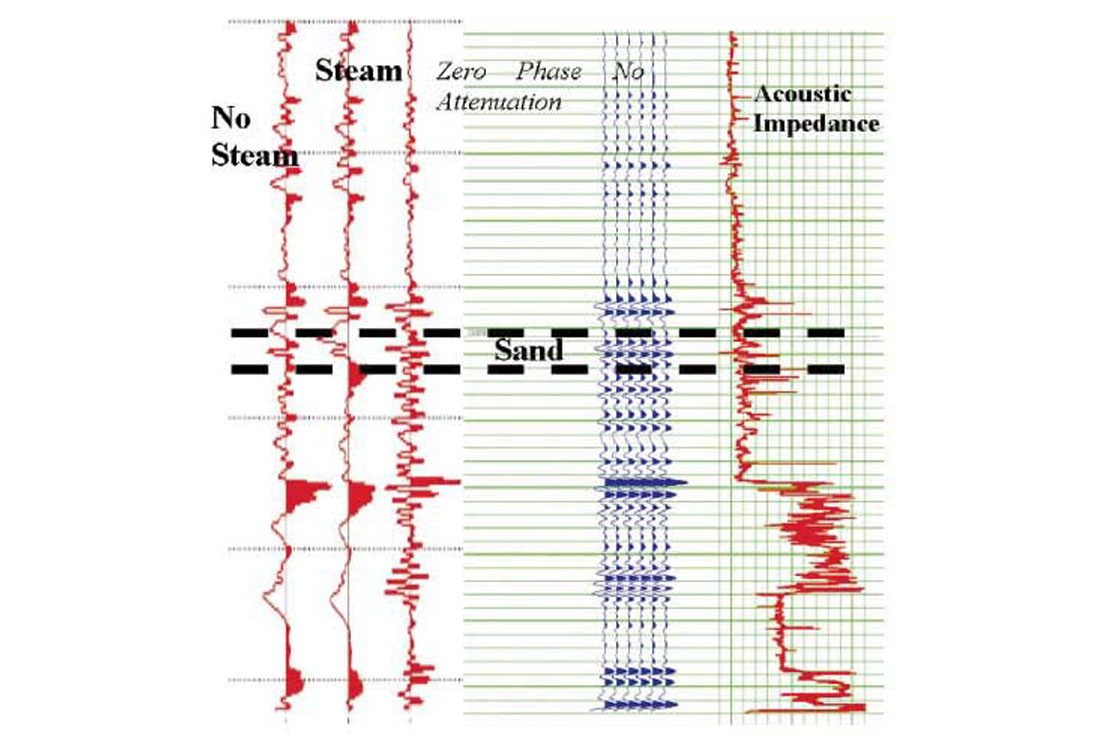
Figure 4c shows the centroid frequency extracted from above and below the reservoir. The centroid frequency is relatively constant above the reservoir, but shows a decrease at the injection wells below the reservoir. A continuous section of centroid frequencies (Figure 4b) suggests an attenuated zone beneath the injector well. This attenuated zone is not present lower in the section possibly because of the time variant spectral balancing applied in seismic processing and with increasing depth, fewer raypaths intersect the steam zone.
The 1991 seismic line is shown in Figure 5a. The maximum frequency of this data is about 90 hz. The centroid frequency section (Figure 5b) shows smaller attenuation anomalies consistent with production at that time.
Conclusions
Seismic attenuation anomalies observed on centroid frequency sections created from two seismic lines are consistent with zones of steam injection. The presence of the anomalies is supported by a synthetic seismic model based on constant Q theory.

Acknowledgements
The authors would like to thank AOSTRA, (Alberta Oil Sands Technology and Research Authority) and the CREWES PROJECT of the University of Calgary.


Join the Conversation
Interested in starting, or contributing to a conversation about an article or issue of the RECORDER? Join our CSEG LinkedIn Group.
Share This Article