Introduction
The Ross Lake oilfield, operated by Husky Energy Inc., is located in south-western Saskatchewan, Canada. The reservoir is at about 1150m depth and is interpreted as a lower- Cretaceous, incised-valley channel sand in the Dimmock Creek member of the Cantuar formation of the Mannville Group. The sand has high porosity (>30%) and high permeability (3 Darcies). Well 11-25, in the field, encountered over 30 m of sand and about 12-13 m of oil pay without a gas cap.
A 3D multi-component VectorSeis® seismic survey was acquired in May, 2002 by Veritas DGC using 0.5kg dynamite as a source. In June 2003, a multi-offset VSP survey was conducted by Schlumberger Canada and the CREWES Project in well 11-25. The zero-offset VSP used two types of source: a vertical vibrator with an 8 - 180 Hz sweep and 5 - 100 Hz horizontally sweeping mini-vibe (denoted S-source). All of the offset VSPs used only the vertical source. The surface and borehole surveys were acquired to further understand and delineate the sand reservoir as well as search for new prospects. In particular, the 3C-3D seismic survey was undertaken, in part, to evaluate whether converted-waves (PS) could be used to advantage in imaging the reservoir.
Rock properties
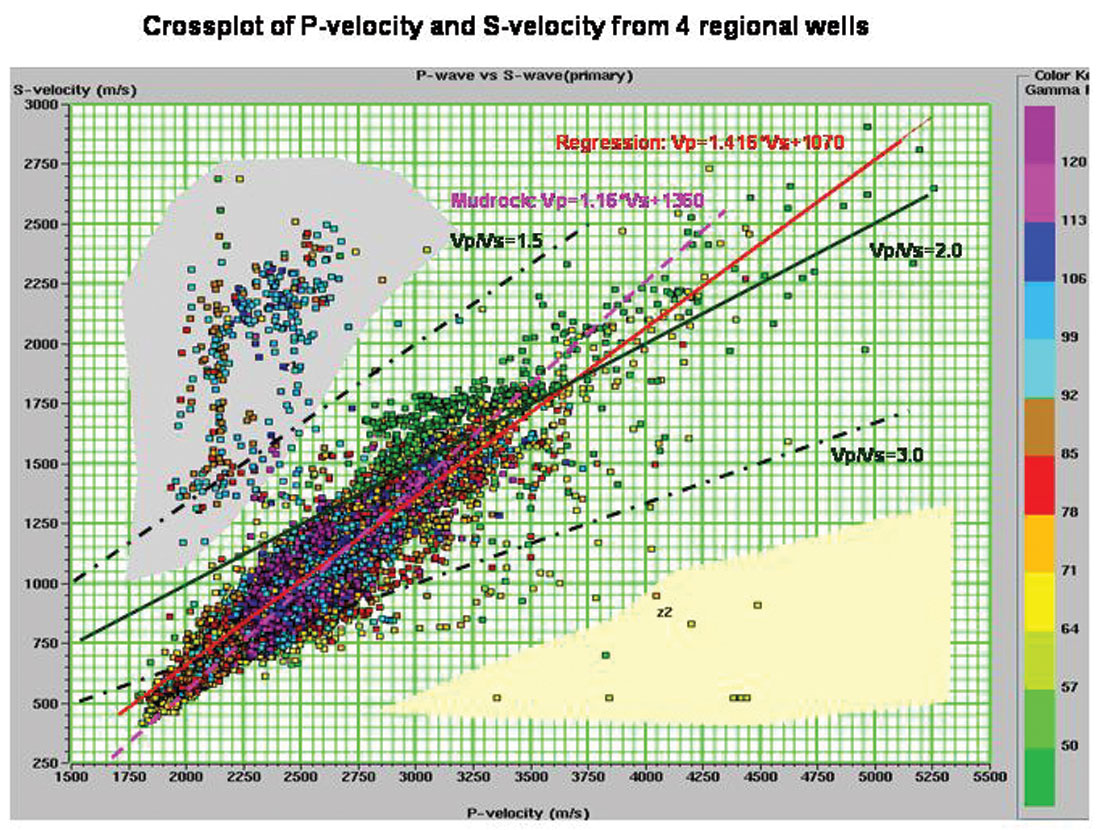
Shear-sonic logs are helpful in interpreting converted-wave data through the construction of PS-wave synthetic seismograms. Unfortunately, none of the wells within this 3C-3D seismic survey had a shear-wave log. So, to understand the general behaviour of Vp and Vs, we use 4 regional wells with measured shear sonic logs to create crossplots (e.g., Figure 1). The channel sands have P-wave velocities in the 3000 m/s range. A regression-line fit of all the points (excluding the two grey color zones) gives Vp = 1.416*Vs + 1070 m/s. If we exclude some of the higher Vp/Vs values, the regression fit would be closer to the standard mudrock line. Three constant Vp/Vs lines (1.5, 2.0 and 3.0) are also plotted. The Vp/Vs values range from 1.8 ~ 3 in the shallow layers above the reservoir. The reservoir sands generally show Vp/Vs values between 1.5 and 2.0.
Logs and synthetics
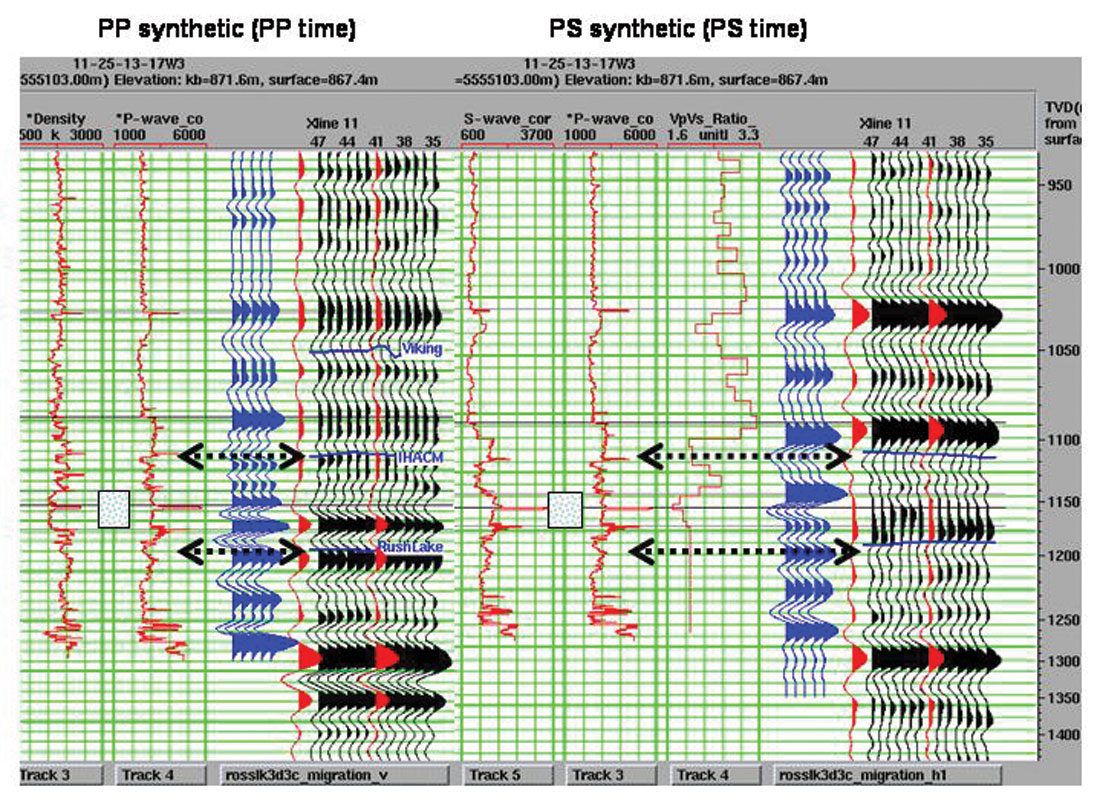
With a general understanding of the reservoir properties from the logs, we next use the P- and S-source zero-offset VSP to derive an interval Vp/Vs curve directly relevant to the Ross Lake field. This is accomplished by picking the P and S first-break times on the 130 downhole geophones (which were at a 7.5 m depth spacing interval) from the downgoing wavefields. Then, we divide the P-velocity log by the VSP-derived Vp/Vs curve to create the pseudo Vs log for well 11-25. These logs are input to an elastic-wave synthetic seismogram package (SYNGRAM by Dr. Gary Margrave and the CREWES Project). A 10/15-40/50 Hz Ormsby wavelet is used to generate the PS synthetic seismogram. Figure 2 shows the PP (left panel) and PS (right panel) data. In general, there is a reasonable correlation among the data types. As often seems to be the case, however, the tie is not very obvious in the reservoir zone. Some stretching or further calibration of the logs may be useful.
3C-3D seismic data interpretation
We now continue the interpretation by considering the post-stack Kirchhoff migrated datasets of the PP and PS data. The 3C-3D survey covers about 7.5 km2 processed into 25m-by-25m CDP bins. The N-S inline locations range from 1 to 132, while the E-W crosslines are numbered from 1 to 91. The PP data show an average signal bandwidth of about 8-100 Hz in a 800-1300 ms window. The PS data (from processing the radial component), in a window of 1000-2000 ms, have a narrower frequency bandwidth of about 10-60 Hz. The PS data (from the transverse component) in the same window as the PS-radial data show a narrower bandwidth of 10-40 Hz. Only PP and PS-radial data are interpreted here as the transverse data were without a great deal of signal. The target is at about 1150 ms on the PP section and about 2100 ms on the PS section.
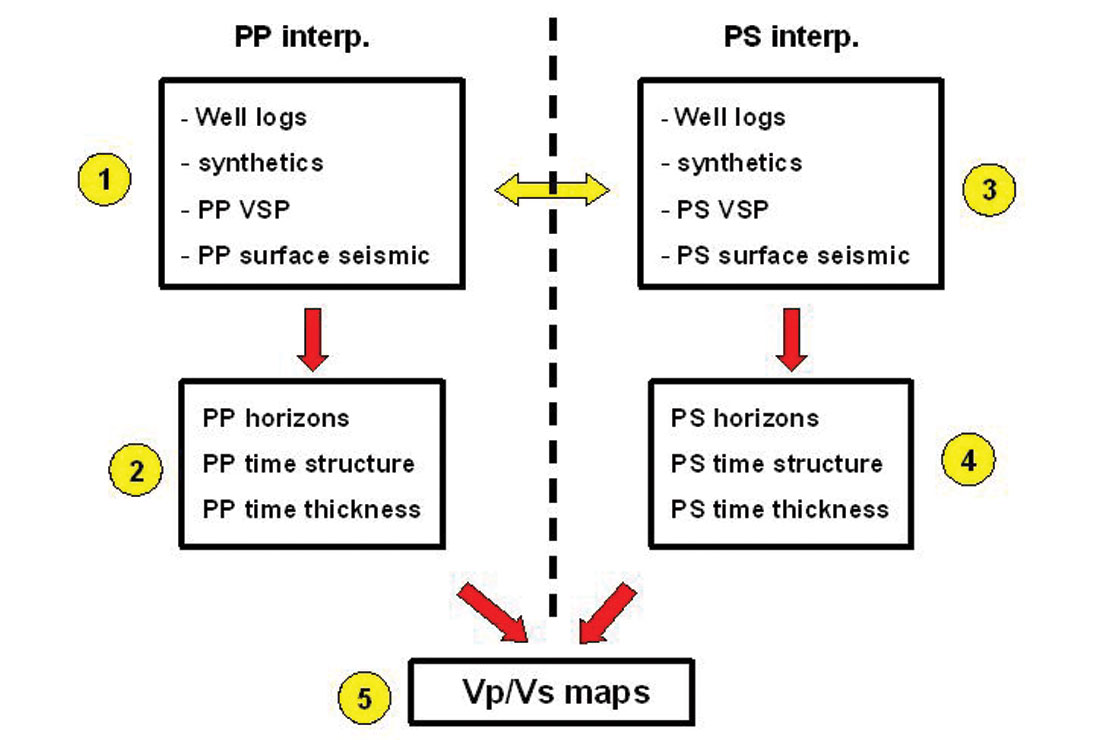
Our multi-component data interpretation work flow is shown in Figure 3. The conventional PP data interpretation is conducted first – with synthetic seismogram generation, correlation, horizon picking, time-thickness calculations, and attribute extractions. When interpreting PS data, the most difficult part is often event registration with synthetic seismograms and the PP data. Nonetheless, after horizons are picked on both PP and PS volumes, PP and PS time-structure maps and time-thickness maps are extracted. Finally, we use PP and PS time-thickness maps to calculate a Vp/Vs map. It is this map that can provide an indication of the horizontal variation of lithology.
PP data interpretation
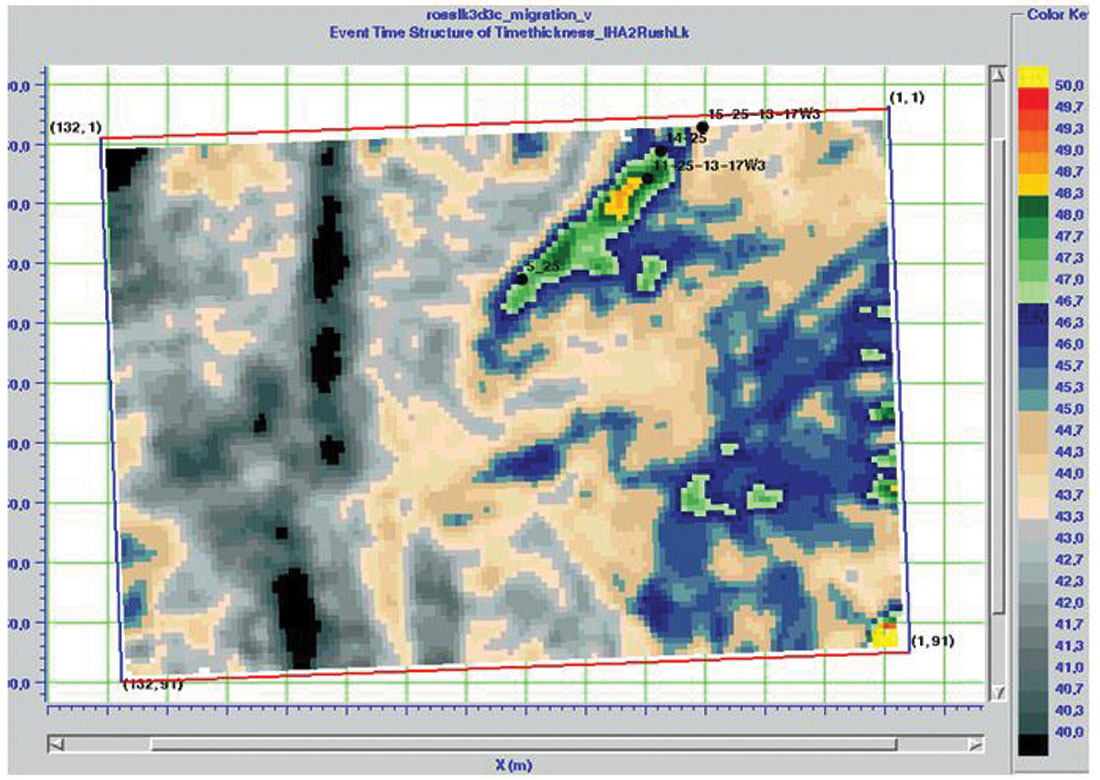
The PP synthetic seismogram from well 11-25 (E-W crossline 11 and N-S inline 41) and the zero- offset PP corridor stack are used to develop the correlation between geological formations and seismic events. The PP seismic data display a good correlation with the synthetic seismogram and zero-offset VSP. The PP time thickness map between Rush-Lake and IHACM (an acronym for the Index Horizon Above Cantuar Marker) shows a clear northeast to south-west bar shape anomaly with an increased time thickness (Figure 4).
PS data interpretation
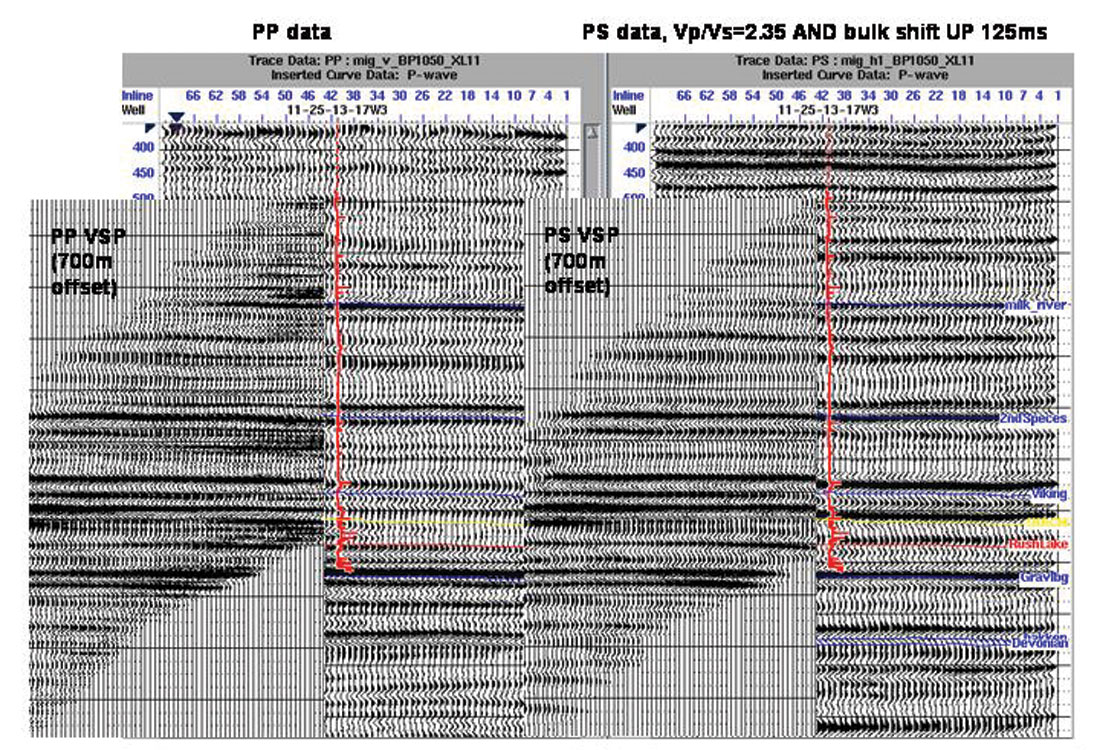
To directly compare PS data with PP data, we need a mapping from PS to PP time. A fixed Vp/Vs = 2.35, or a squeezing factor of (1 + 2.35)/2 = 1.675 for PS time is initially used here. This provides us with an approximate PS-to-PP data correlation. We observed that an additional 125 ms time shift (up) is also needed for the time-compressed PS data. This may be the result of low S-wave velocities in the near(ish) surface giving rise to an additional static shift. This registration is assisted by comparing the 700 m offset VSP images to the PP and PS surface seismic sections (Figure 5).
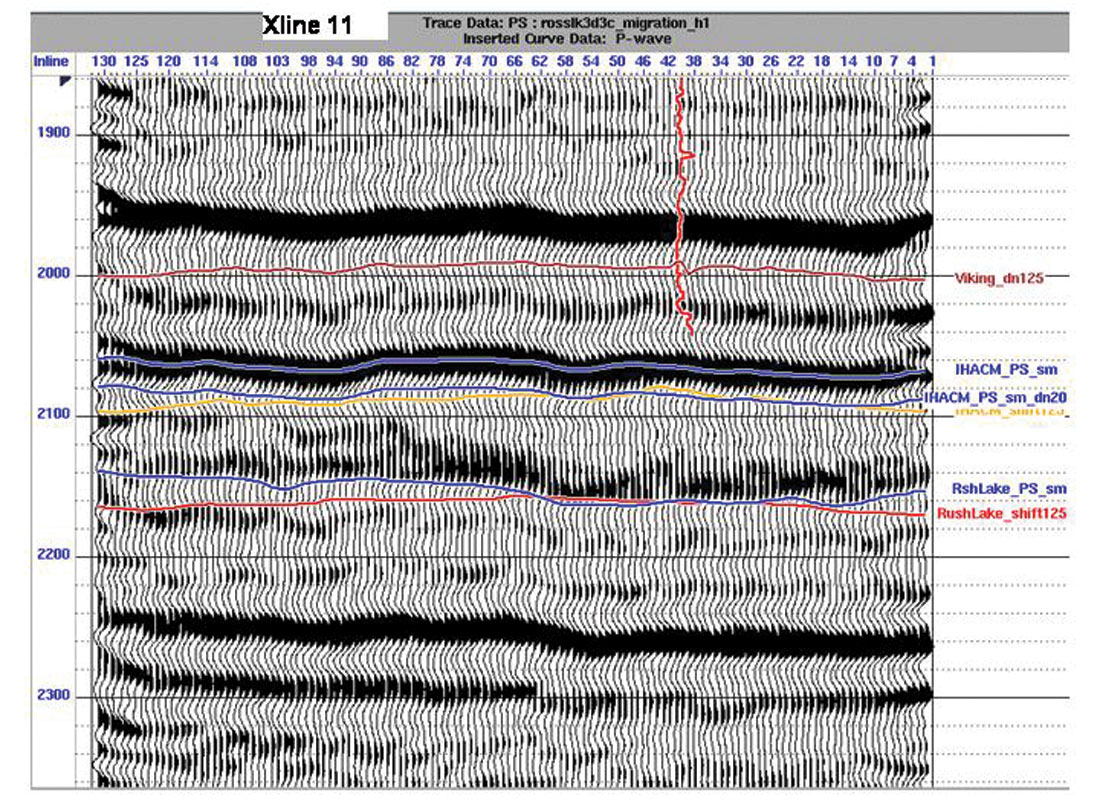
Guided by PS synthetic seismograms at well 11-25 (Fig. 2), the PS horizons (focussed around the Rush-Lake and IHACM) are picked ( Figure 6). The corresponding PP horizons are converted into PS time by Tps = (Tpp + 125) ¥ 1.675 and are displayed as red lines for cross-checking the general trend.
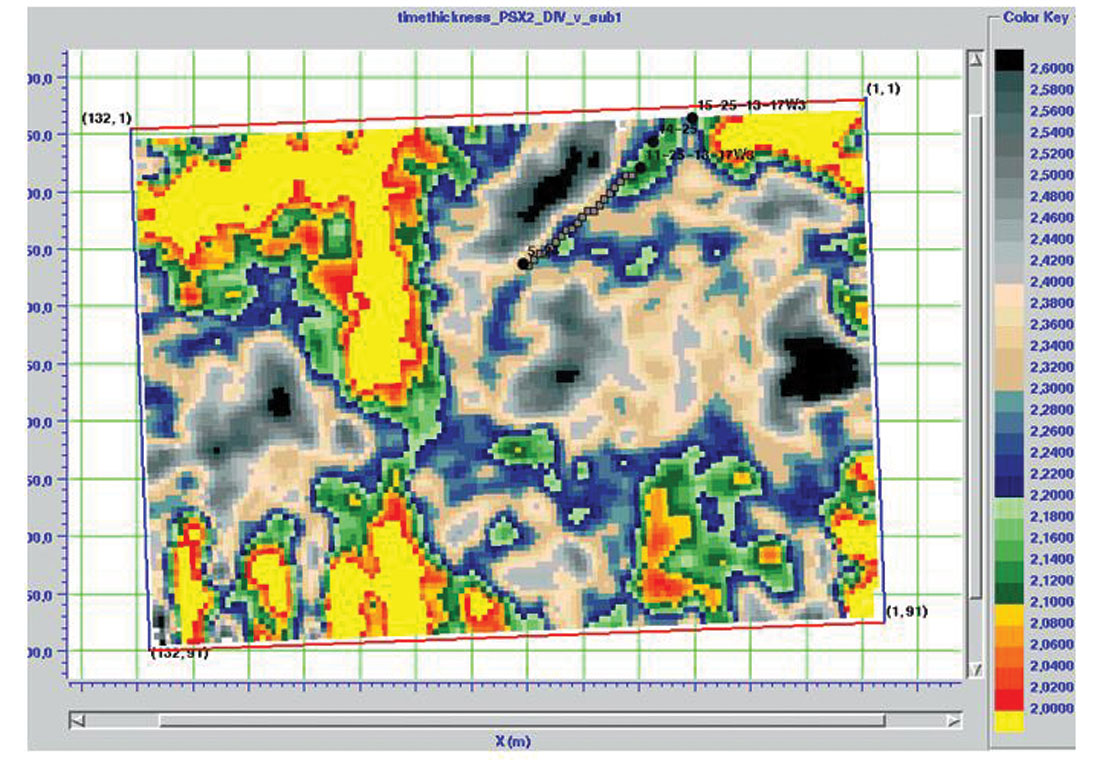
Similarly to the PP data, the PS time-thickness map between the IHACM and Rush-Lake is calculated (Figure 7). Compared with the PP map (Figure 4), the PS map has a larger time variation: 60 – 84 ms (40% change) versus 40 – 50 ms (25% change).
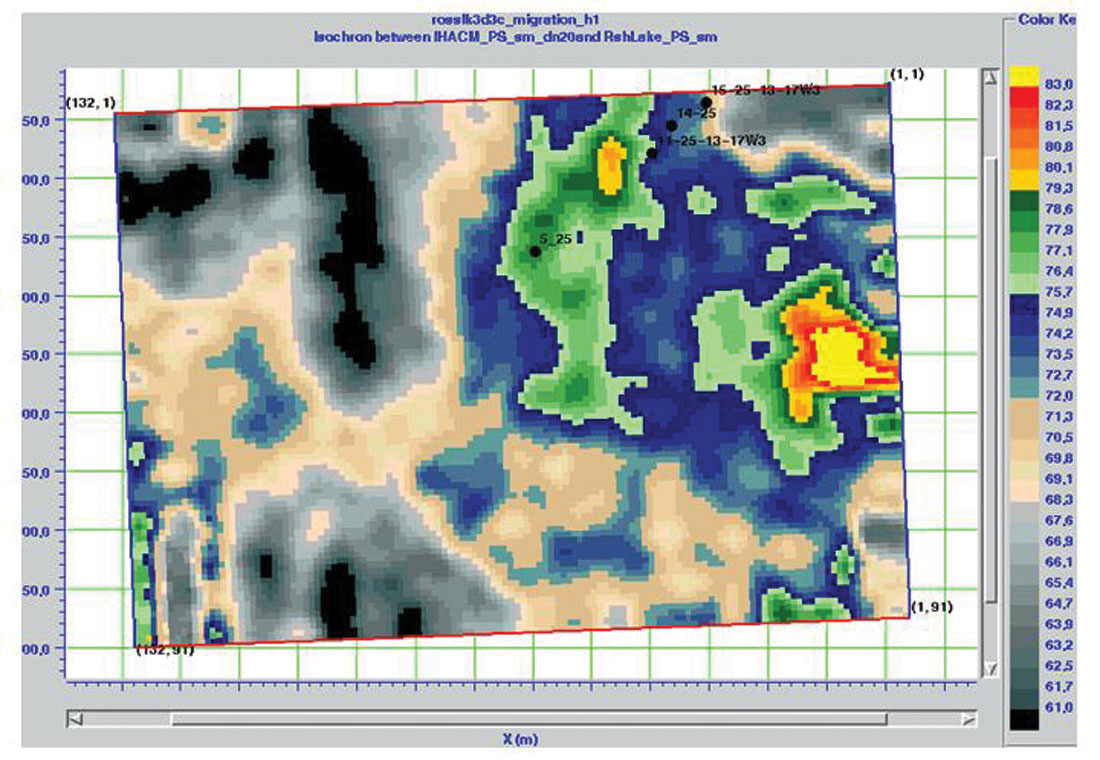
Vp/Vs map and lithology interpretation
We use the standard time-thickness calculation,

to create the average interval Vp/Vs map between the IHACM and Rush-Lake horizons (Figure 8).
The Vp/Vs map has some interesting features:
- A low Vp/Vs anomaly, trending to the northeast, in the upper central part of the Figure corresponds to the structural thick anomaly indicated on the PP data.
- A low Vp/Vs value (1.7 ~ 2.0, bright yellow color) with a north-south trend at the left half and upper right corners. These may be thick, tight sands or possibly, other incised features not belonging to the Dimmock Creek Member.
- Four blackish blocks with high Vp/Vs value (> 2.4) are interpreted to be shale or shaly.
- The upper right half grey part seems to be a closure feature. The PP time anomaly (previously interpreted as the reservoir sand body) has split into two parts with Vp/Vs about 2.15 ~ 2.25 by a horizontal stripe with Vp/Vs about 2.3 ~ 2.4, which prior to having the horizontal well results, was interpreted as a shale cut or shaly-sand.
- The low Vp/Vs anomaly just east of the diagonal anomaly.
In summary, for this high-porosity, high-permeability, loose sand play saturated with heavy oil, the hydrocarbon accumulation is correlated with: (a) large PP time thickness and (b) a middle range Vp/Vs value about 2.15 ~ 2.25.
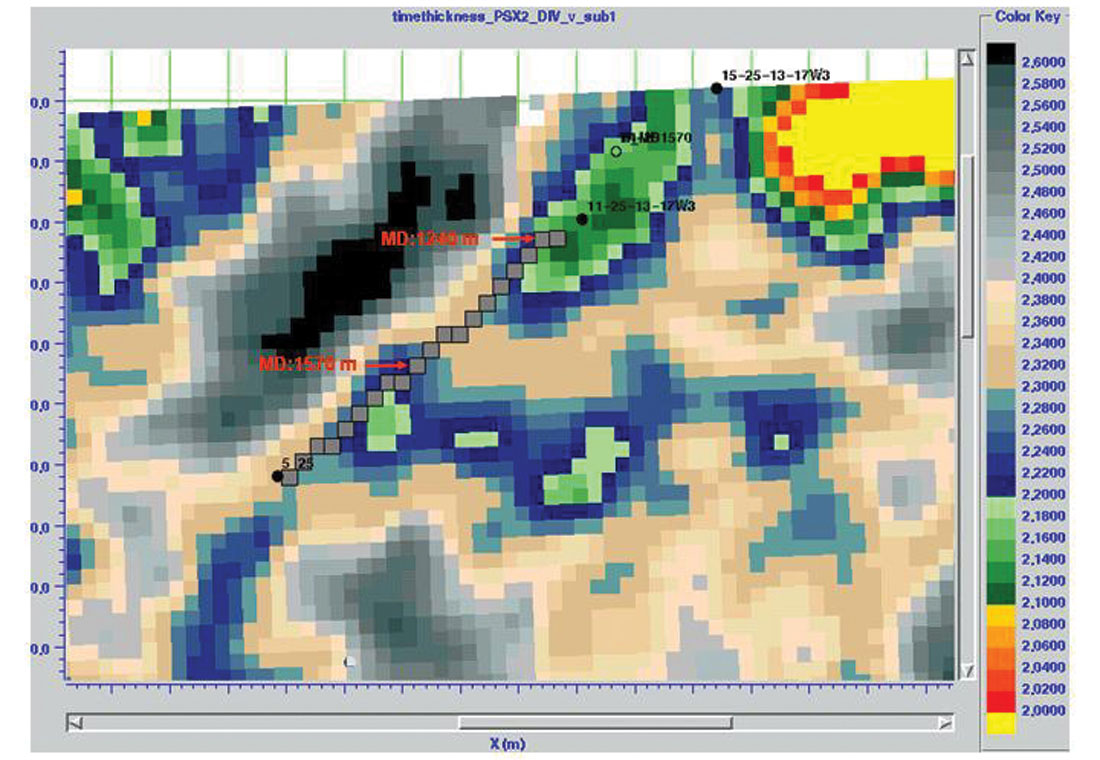
Horizontal well result
Based on the conventional P-wave interpretation, Husky drilled a horizontal well 5-25, in July 2002, on the PP time- thickness anomaly. This well has a 600m horizontal reach and stays within the Dimmock Creek Member sand. Figure 9 shows the zoomed Vp/Vs map with the trajectory of the horizontal interval of well 5-25. To better assess the relationship between the measured (while drilling) Gamma Ray (GR) log and seismically derived Vp/Vs value, a local normalization is applied to both GR and Vp/Vs. Fig 10 displays the normalized variation of GR and Vp/Vs. The x-axis, in the plot, is the horizontal location of the well’s trajectory starting from the location of entry into Dimmock Creek formation (CDP bin #1, north-east end)) to the end of the hole. The Vp/Vs map, created before we had the drilling results, predicted a shaly interval that was indeed encountered in the well. The actual gamma ray log and the seismically derived Vp/Vs (our two shaliness indicators) show a promising correlation.

Conclusion
We have analysed a 3C-3D seismic data set over the Ross Lake oilfield in southwestern Saskatchewan. We find a reasonable correlation among the logs, synthetic seismograms, VSP, and surface seismic volumes. The zero-offset PP corridor stack ties nicely with the PP seismic at the well location. P-source and S-source zero-offset VSPs provide the interval Vp/Vs curve in the well 11-25 which, in turn, helps estimating a pseudo shear-velocity log. The PS synthetic seismogram increases the confidence of PS seismic event identification and provides the essential guide to pick PS horizons. The far-offset PS VSP-CCP map helps to identify the events on the PS seismic section and is a key bridge to correlate PP and PS seismic data.
On the PP time-thickness map, the target sand body clearly stands out as a thick anomaly. Combining the PP and PS horizon time-thickness maps provides a Vp/Vs map between the IHACM and Rush-Lake horizons. It suggests that there is a shale-cut or shaly part within the target sand body. This interpretation is supported by the gamma ray log from the horizontal well. Other anomalies from the Vp/Vs map also suggest further drilling targets.

Acknowledgements
We would like to thank Mr. Larry Mewhort, Mr. Kenneth Hedlin, and Ms. Angela Ricci of Husky Energy Inc. for their assistance. Hampson-Russell Software Services donated the software used in this interpretation. We also thank all sponsors of the CREWES project for their financial support.


Join the Conversation
Interested in starting, or contributing to a conversation about an article or issue of the RECORDER? Join our CSEG LinkedIn Group.
Share This Article