Zero-offset vertical seismic profile (VSP) data were acquired by both retrievable (wireline) geophones and distributed acoustic sensing (DAS) on cemented-in fiber-optic cable. Side-by-side comparisons of these data sets are shown at several steps in the processing flow to help understand the advantages of each of these data types. Good data quality is achieved using only eight sweeps of a vertical P-wave vibrator. The DAS data are shown to be less responsive to tube wave energy, which is generally considered to be an advantage. There are approximately 15 times more channels on the DAS data than on the geophone data, which can help in filtering processes. The corridor stacks provide similar images. The near offset VSP common depth point (CDP) transform results for the DAS image show better continuity at shallow times, but more noise than the geophone data at later times.
Introduction
The technology associated with distributed acoustic sensing (DAS) technology for vertical seismic profile (VSP) acquisition has been advancing rapidly. In many cases, fiber-optic cable is installed by permanently cementing it behind casing or by clamping it to production tubing in the well for other applications, such as distributed temperature sensing, pressure, and flow measurements. The ability to access this cable without requiring well intervention enables the possibility of using the cable to acquire VSP data using DAS for a single survey, as well as for time-lapse studies, while reducing both cost and rig time. The usual depth interval for geophone VSP data is approximately 15 to 30 m, which provides unaliased coverage of the subsurface, as determined by the survey objectives. To obtain DAS-like channel spacing of 1 m, it would require an unreasonable amount of time for additional clamping stops during the shuttle up the well using a limited number (typically 16 to 48) of geophones on the tool string. Because the fiber cable is continuous along the well, the depth interval for DAS VSP data is determined by how the backscattered light is sampled by surface equipment, and typically is as small as one meter. This provides for dense spatial sampling, which may provide additional value over the more sparsely spaced geophone channels.
In DAS interrogation, pulses of laser light are shined into the fiber-optic cable, and the backscattered light from glass impurities along the fiber cable are measured by the DAS interrogator unit. By measuring the difference of the phase of the optical wave backscattered from two locations on the cable separated by a distance (called the gauge length), changes to the strain on the glass fiber between these two locations induced by seismic waves are measured. Typical gauge lengths range from 5 to 50 m, depending on the application. Measuring the backscattered light phase differences between many locations along the fiber effectively creates a dense array of vibration sensors along the length of the fiber cable. DAS data are subject to several sources of noise. In addition to conventional “random” noise generated by optoelectronic components of the interrogation system, faded channels and common mode noise can degrade data quality. Faded channels (sometimes called vertical noise) are locations along the fiber where the intensity of the optical backscatter signal is very weak. The faded condition is created when the ensemble sum of the backscattered light from many scattering locations in a particular region of the fiber interfere with one another destructively (i.e., the addition of two optical waves with a phase difference of pi). The reduction in backscatter light intensity from this location causes the calculation of the angle of the phase difference to become unstable and usually creates extremely large amplitude phantom energy on the seismic trace associated with that portion of the fiber cable. Because the effect is temporary, simply repeating the vibe sweep several times will enable the high noise channels to be identified in the set of data and remediation to be applied before stacking. Common mode noise (sometimes called horizontal noise) is caused by sound entering the DAS interrogator and contaminating all channels of the recorded seismic data with an identical set of noise.
Many examples have been shown in the literature of comparisons of finished products from DAS and VSP surveys (e.g., Mestrayer et al. 2011; Mateeva et al. 2012; Li et al. 2013). This article provides images from some of the intermediate processing steps of a zero-offset VSP to help provide an understanding of these data types.
Field Data
An experimental data set was collected from a well in South Texas. The vertical section of the well extended approximately 3000 m deep, and then turned horizontal for another 1500 m. DAS VSP data were acquired every meter along the entire well, and geophone VSP data were collected every 15.24 m in the vertical portion only. Because the focus of this article is to compare these data sets, we present only the data from the vertical section of the well. The source offset was 104 m, so it is a nominal zero-offset VSP. The data quality was excellent, and eight vibrator sweeps were used for each geophone clamping of the tool. There were 20 geophones on the toolstring, spaced 15.24 m apart; this arrangement required nine clamps to span the vertical portion of the well, yielding 177 channels. Because eight sweeps were collected for each tool clamp, up to 72 sweeps were available to stack for the DAS data set. However, only eight sweeps were used for the examples shown here. There are 2,591 channels of DAS data over the same depth interval as the geophones.
Data Analysis
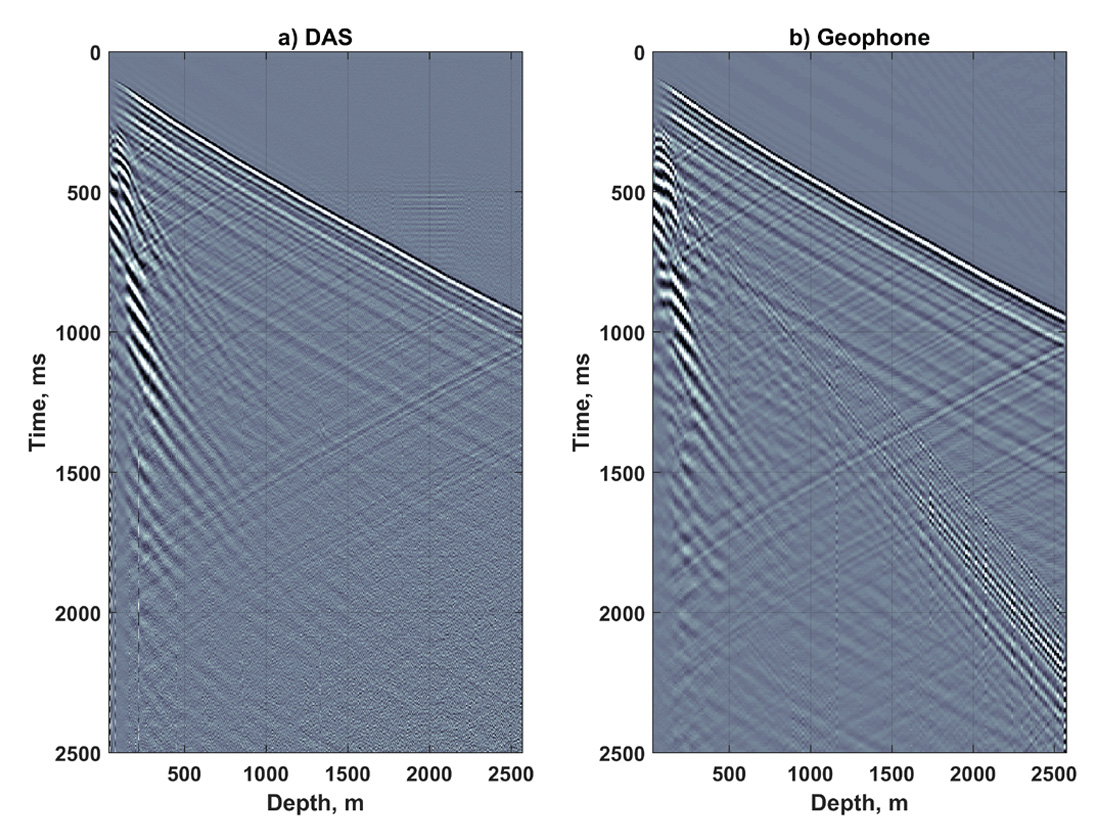
Figure 1 shows the eight-sweep VSP stacks from the DAS (left) and geophone (right) data sets. (The DAS traces have been converted from strain to particle velocity to match the geophone traces.) The first arrivals are the direct P-waves coming from the source to the receiver. The large amplitude down-going, steeply dipping events at shallow depths are converted shear waves. The down-going events with an intermediate slope (shown on the geophone data) are tube waves. On both images, the up-going reflected events emanate from the direct P-waves. Although the DAS data shown in Figure 1 are nearly free of the faded channel effect, some residual common mode noise is still visible after the de-noising and stacking process, as shown in channels deeper than 1750 m and in a time range of 500 to 700 ms. It is clear from these two images that there is much more tube wave energy present on the geophone data (e.g., at 2000 ms on channel 2500m) than on the DAS data.
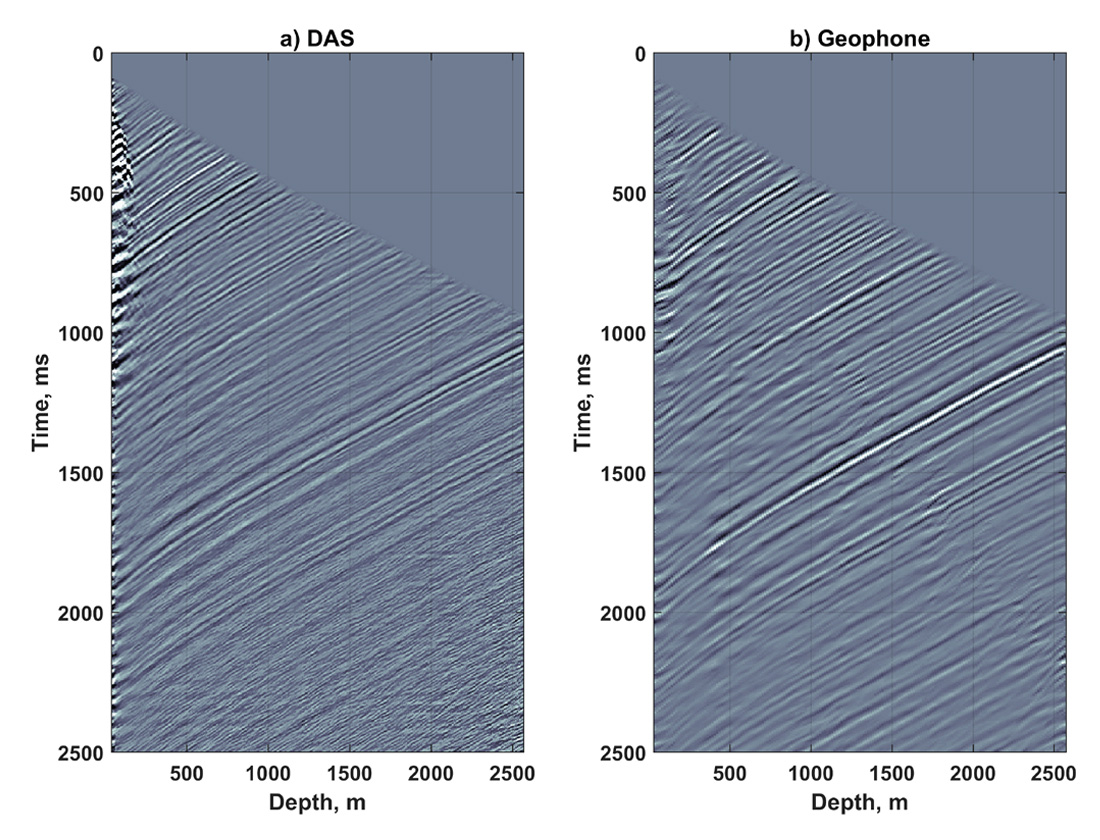
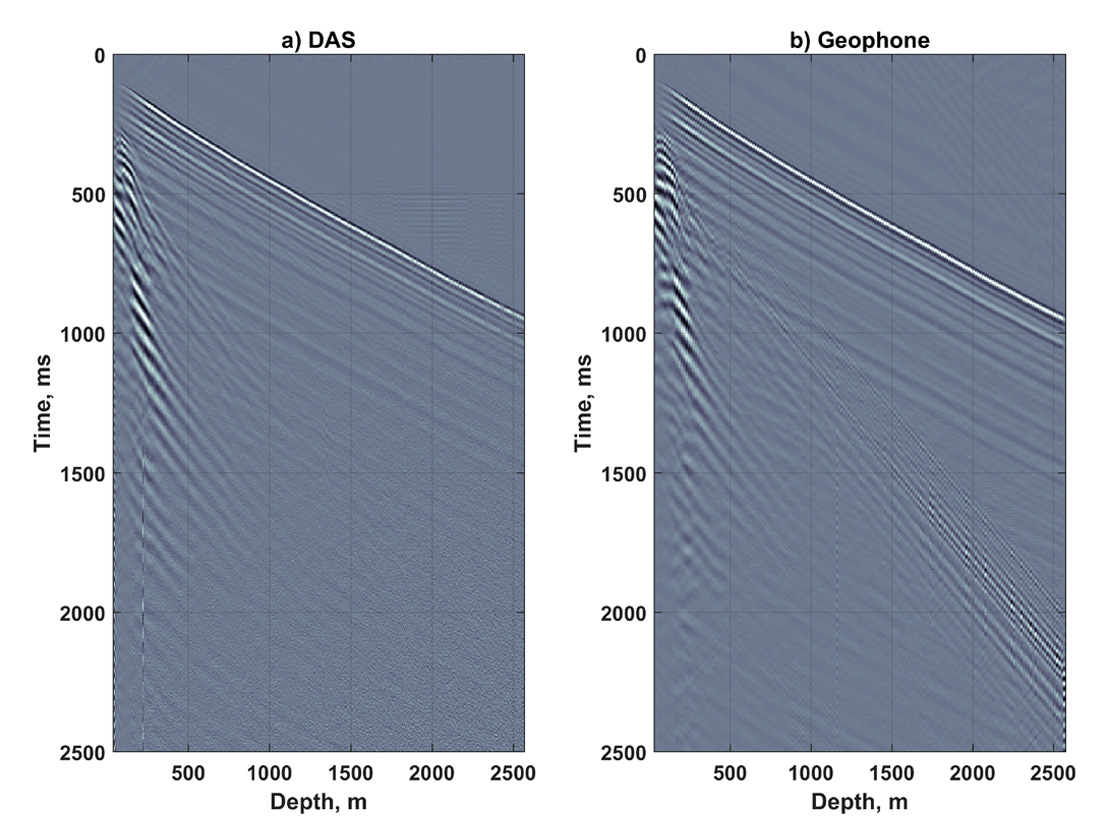
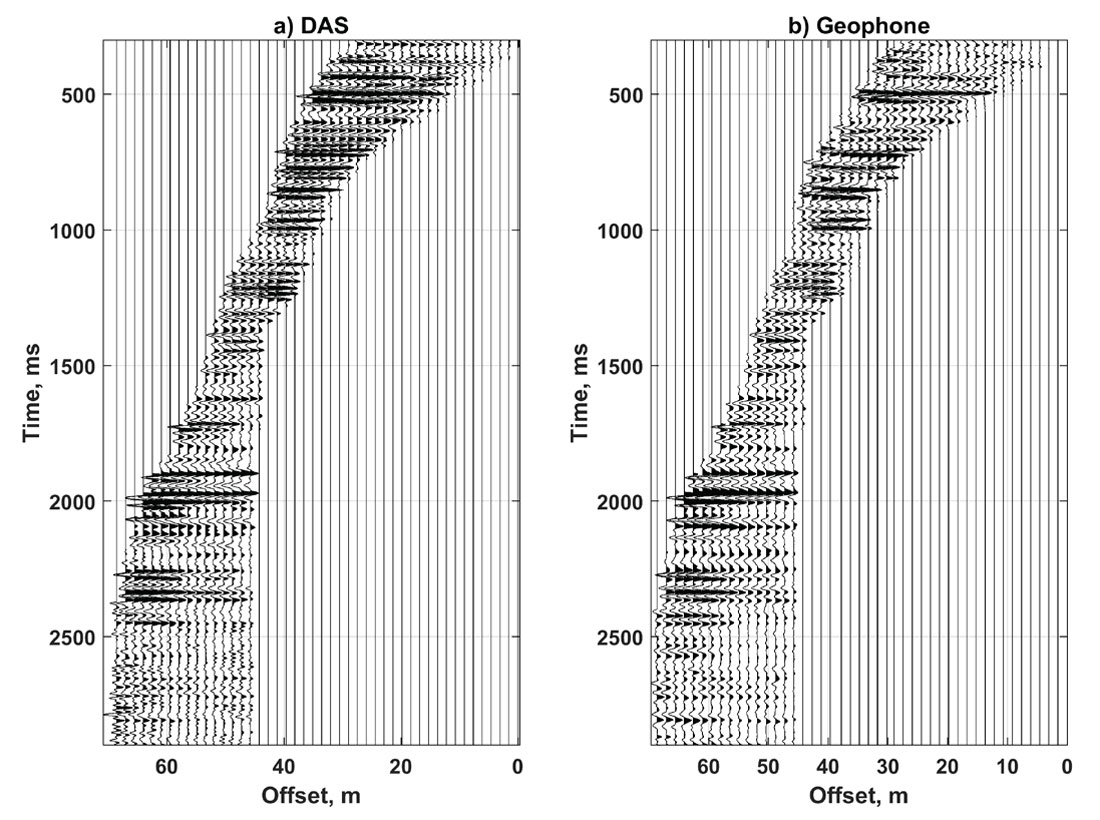
After the first breaks have been picked, the up-going (Figure 2) and down-going (Figure 3) wave fields can be separated, usually using median filtering. The up-going wave field of the DAS data set (Figure 2a) was plotted with reversed polarity because the DAS and geophone reflections have opposite polarity (Mateeva et al. 2014). Here again, the DAS data are shown to contain less tube wave energy. Because of the dense spatial trace sampling, we might expect that it would be easier to perform velocity filtering on the DAS data. However, the small trace-to-trace moveout of the events prevents the dense trace spacing from providing much additional value to the velocity filtering using median filters. Conversely, if frequency-wavenumber velocity filtering techniques were to be used, the dense trace space will prevent spatial aliasing.
By shifting each trace of the up-going wave field (in Figure 2) later in time by an amount equal to its corresponding first break time, the up-going wave field is horizontally aligned, as shown in Figure 4. Additional filtering was applied to the geophone data in this display in an attempt to remove the tube waves. Both data sets have had velocity filtering to reduce the strong shallow shear waves. Here, we see that the DAS data is more continuous laterally, and its quality is very good until approximately 2400 ms when the quality somewhat decreases.
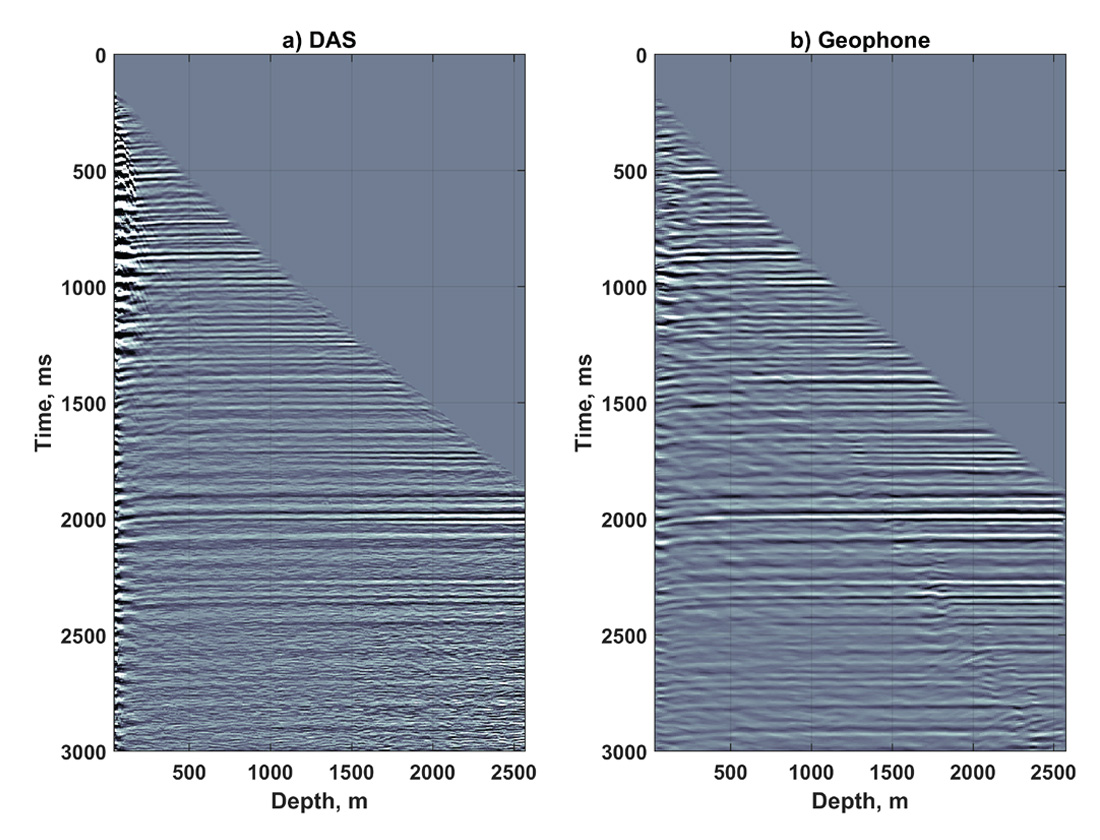
Figure 5a and b show the corridor stacks derived from the aligned traces in Figure 4. They are created by first muting all values of the traces except for a time window near the first break time. No mute is applied to a small number of the deepest traces. This muted set of traces is then stacked together to create the corridor stack. Usually, the time window near the first break is small to limit the contamination from multiples and converted waves. For this data set, it was possible to use a larger time window on the DAS data, increasing the signal-to-noise ratio of the resulting corridor stack. The two corridor stacks are in good agreement until after 2400 ms when the noise on the DAS data has increased.
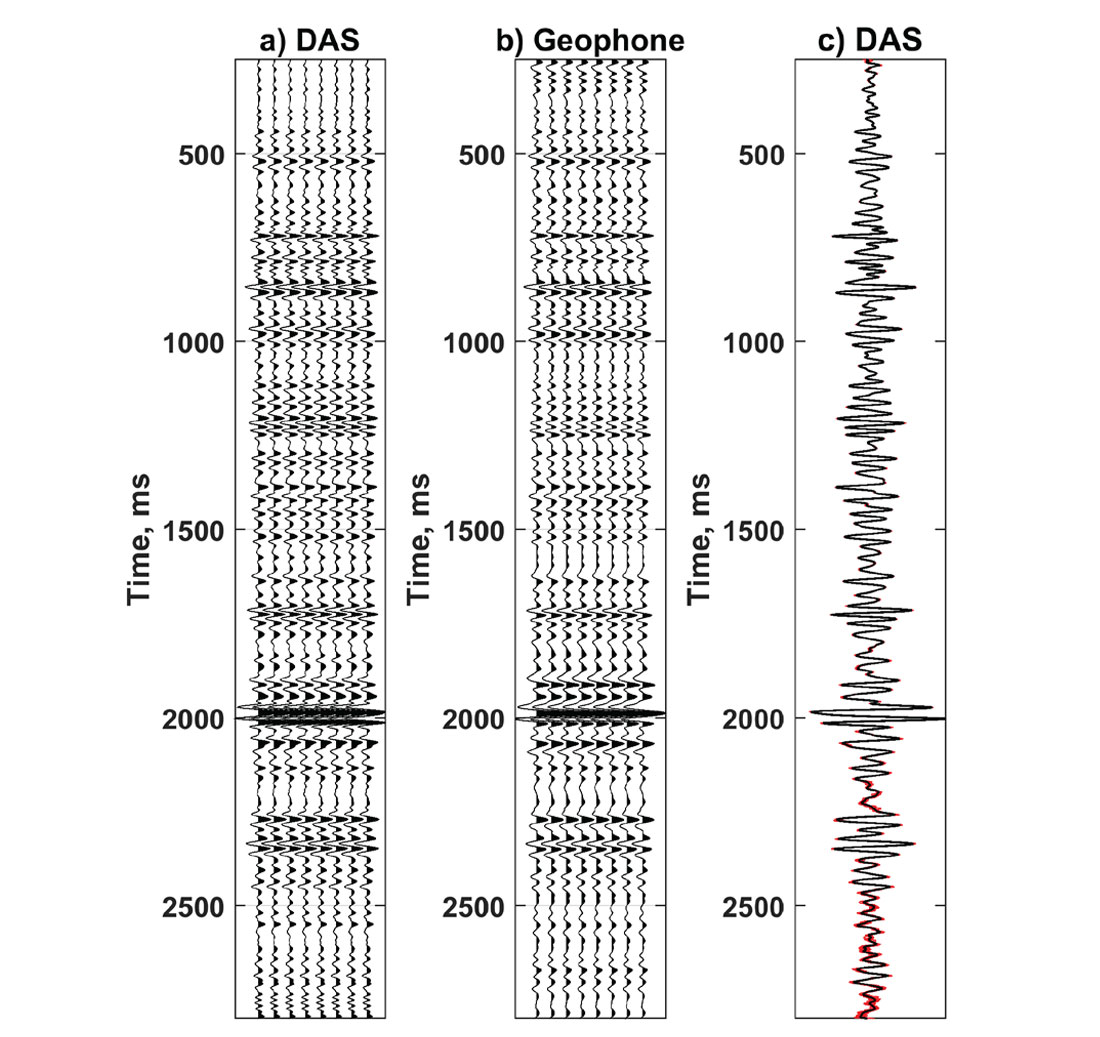
To estimate the signal-to-noise ratio of the DAS corridor stack, first, multiple random realizations of eight-sweep DAS stacks were created from the set of 72 sweeps collected. Next, a set of corridor stacks was created from each of these realizations. All of these corridor stacks are plotted in red on top of one another in Figure 5c. The black line shows the plot of the average of the corridor stacks. It is clear that after approximately 2400 ms, the signal-to-noise ratio of the data decreases because the red lines are now clearly visible above the average trace. At this time, it is unknown why the signal-to-noise ratio decreases to below approximately 16 dB at times later than 2400 ms on the DAS corridor stack.
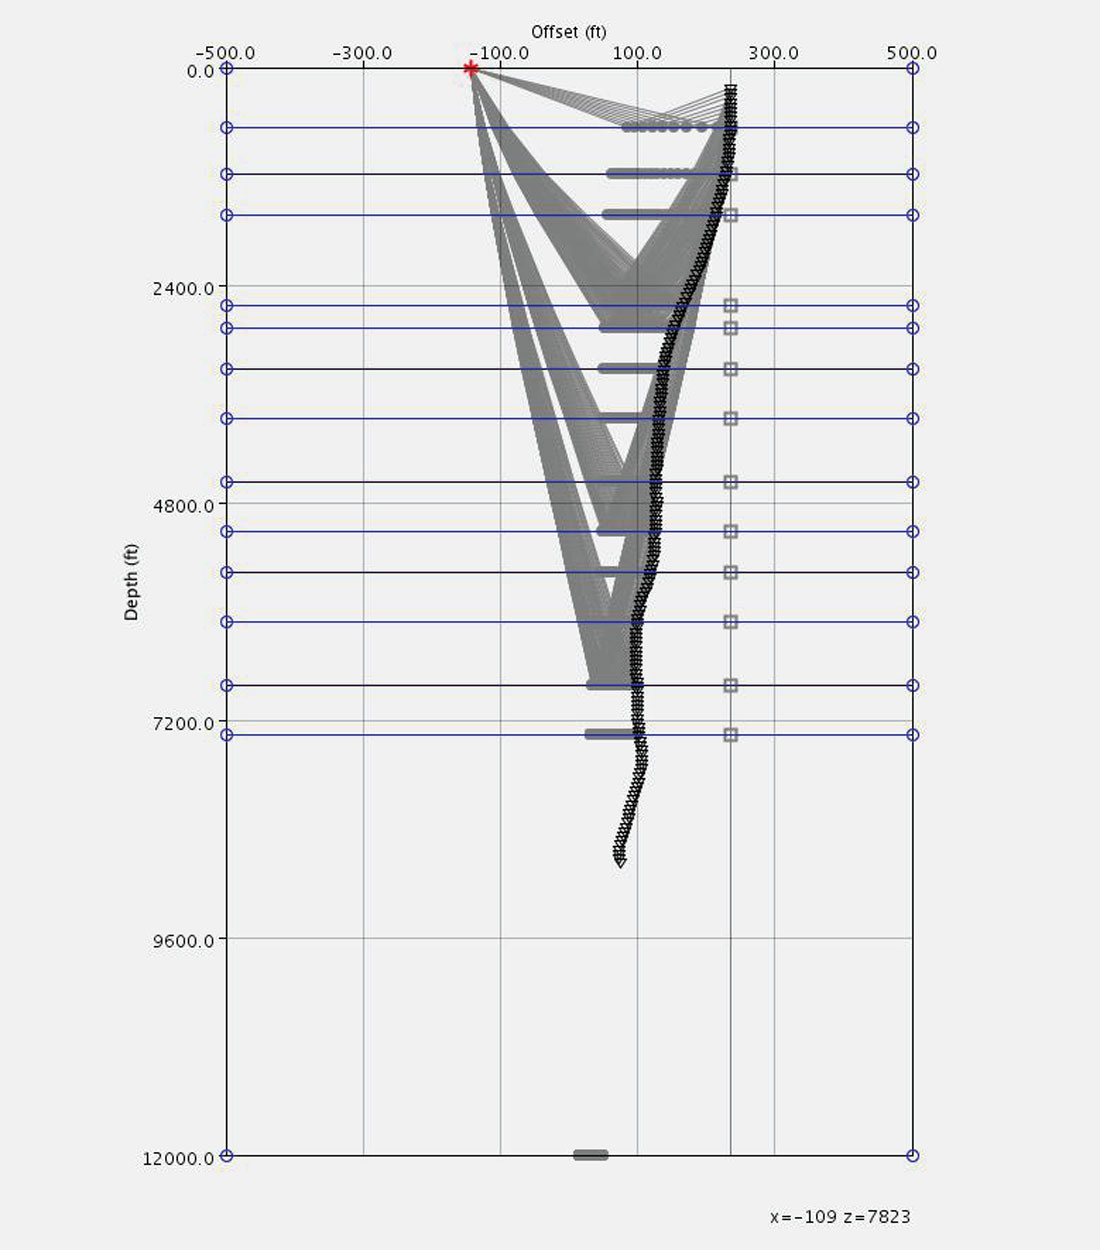
A VSP-CDP transform is an imaging algorithm that, using a 1D velocity model (optionally with dip), performs a one-to-one mapping of a VSP up-going wave field to create an image of the subsurface (Gulati et al. 1997; Hardage 2000). It uses a ray trace base travel time computation to map the trace amplitudes to positions in the subsurface where the ray was reflected. Usually, this process is used for VSP data with non-zero source offsets. The data used in this paper were collected with a small, non-zero source offset (104 m). In addition, the well trajectory in the vertical section exhibits some amount of deviation and out-of-plane component. Figure 6 shows the VSP-CDP transform of DAS and geophone data from Figure 4. Figure 7 shows the well trajectory and a few ray paths for a selected number of layers. It also shows the illumination area for each of the layers. The horizontal axis scale is exaggerated, but it shows that the imaging illumination area is 30 to 70 m left of the well in figure. The VSP-CDP images are quite similar. For times less than 1 s, the DAS image is much more coherent and consistent. For times later than 2400 ms, the noise in the DAS image is greater than that of the geophone data. The VSP-CDP transform images provide yet another way of comparing the similarities of the two data types and an advantage of the DAS data, especially at shallow times.
Conclusions
The zero-offset DAS and geophone VSP data, acquired in this vertical well using only eight sweeps, both showed excellent quality down to at least 2400 ms. Estimates of the DAS data quality on the corridor stack, using eight sweeps, decreased below approximately 16 dB for times later than 2400 ms. We are working to understand this issue and to improve our DAS interrogator hardware and processing software. The side-by-side comparisons of these data sets shown provide a more in-depth understanding of their similarities and differences. The DAS data is less responsive to tube wave energy, which provides for cleaner VSP products because additional filtering is not required to remove it. The corridor stacks and VSP-CDP transform images are similar for both data types. However, the VSP CDP transform results for the DAS image show better continuity at shallow times.

Acknowledgements
The authors thank the client for permission to acquire and show these data. They also thank Halliburton for allowing this to be published and their team members who contributed to this work, including: Xiang Wu, Dan Quinn, Simon Shaw, Avinash Taware, George Knapo, Kenneth Dixon, and Kary Green.


Join the Conversation
Interested in starting, or contributing to a conversation about an article or issue of the RECORDER? Join our CSEG LinkedIn Group.
Share This Article