Abstract
We propose to combine sparse multi-component (MC) seismic data with dense single component (1C) data. Such a combination provides the best of both: cost effective imaging and AVO analysis from the streamers, together with cost effective VP/VS ratio and MC AVO from the multi-component ocean bottom stations.
Introduction
MC seismic data have been acquired on the seabed for over a decade. Compared to surface towed streamers, such data are of higher cost but have the promise of additional value. The list of promises is long: imaging through gas clouds and mud volcanoes, multiple attenuation, imaging reflectors with low P impedance contrast and improved ability to characterize lithology and fractures. After over a decade we can point to some technical successes. However, MC technology is used marginally and the commercial viability of providing an MC service is a promise yet to be delivered. Why?
One problem with MC is data quality. Ocean bottom cable (OBC) data sometimes do not have the fidelity needed for detailed analysis. Another problem is lack of analysis methods. However, the main problem with seabed data is that streamer data are not only too cheap but also too good. Many of the promises of MC data can be delivered by long offset and wide azimuth 1C data. For example, low normal incidence P impedance reflectors can be imaged with long offset streamer data. In general, streamers give seabed seismic a good run for its money leaving too small a niche to be commercially viable.
In this paper we present an idea for a type of seismic service, which is currently not offered. Rather than attempting to replace streamers altogether, we propose to add sparse multicomponent data to the streamer data.
Combined Ocean Bottom stations and Streamers (COBS) data example
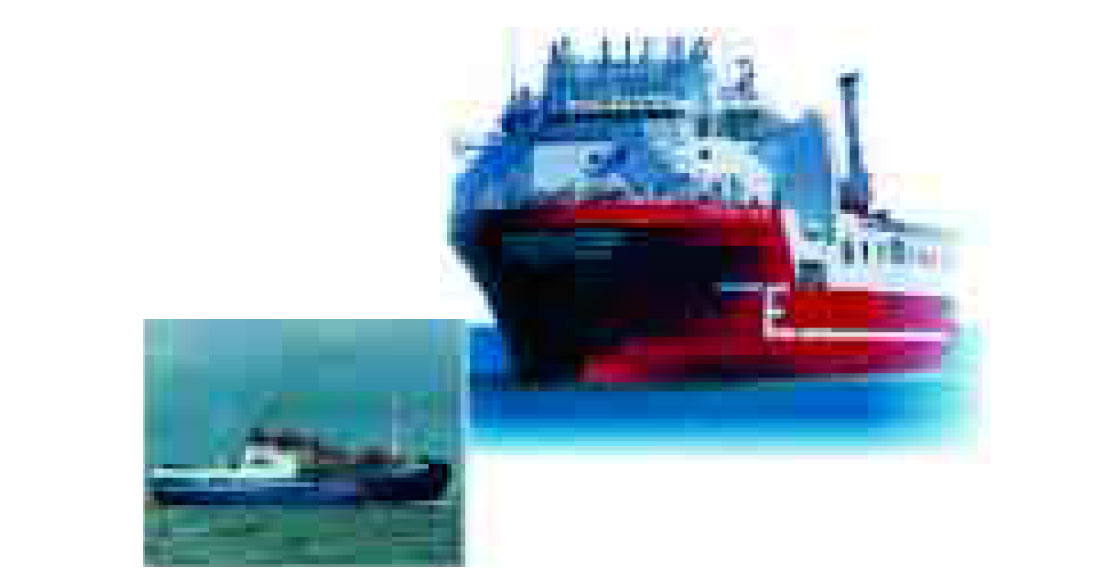
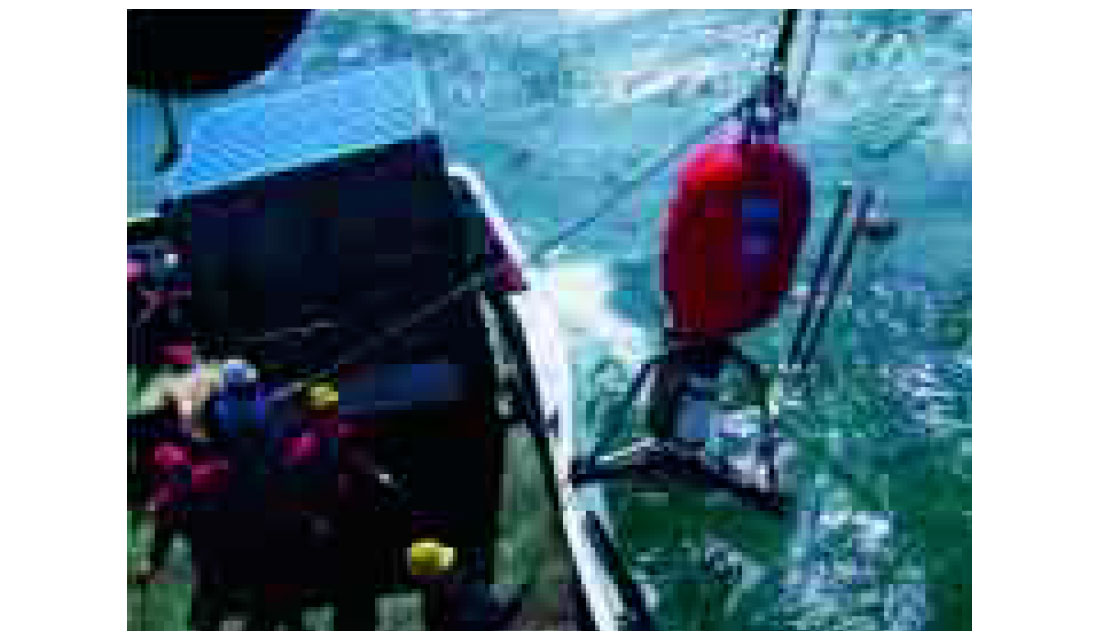
Last year VeritasDGC acquired and processed such data in the North and the Norwegian Seas. The COBS surveys were carried out by the Veritas Vantage and the SeaBird (Figure 1). A score of self-landing and ascending SLA-OBS (Buttgenbach et al, 2002) were used. The SLA-OBS were deployed, serviced, and retrieved on the Sea Bird (Figure 2).
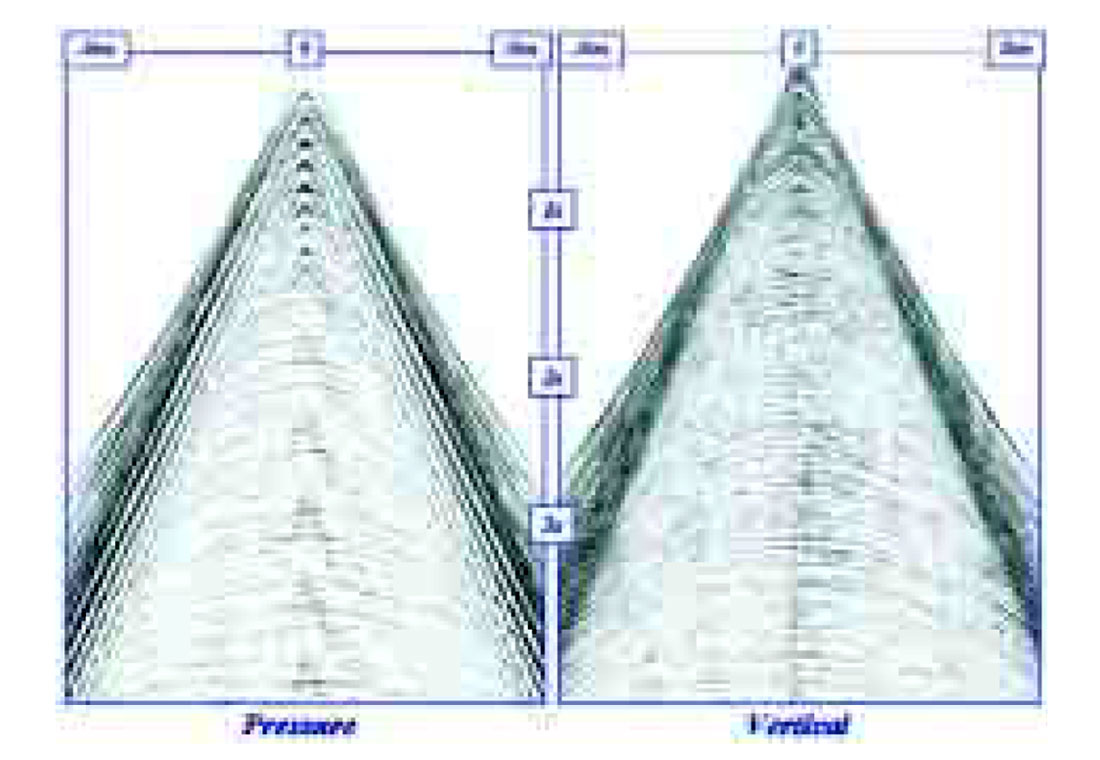
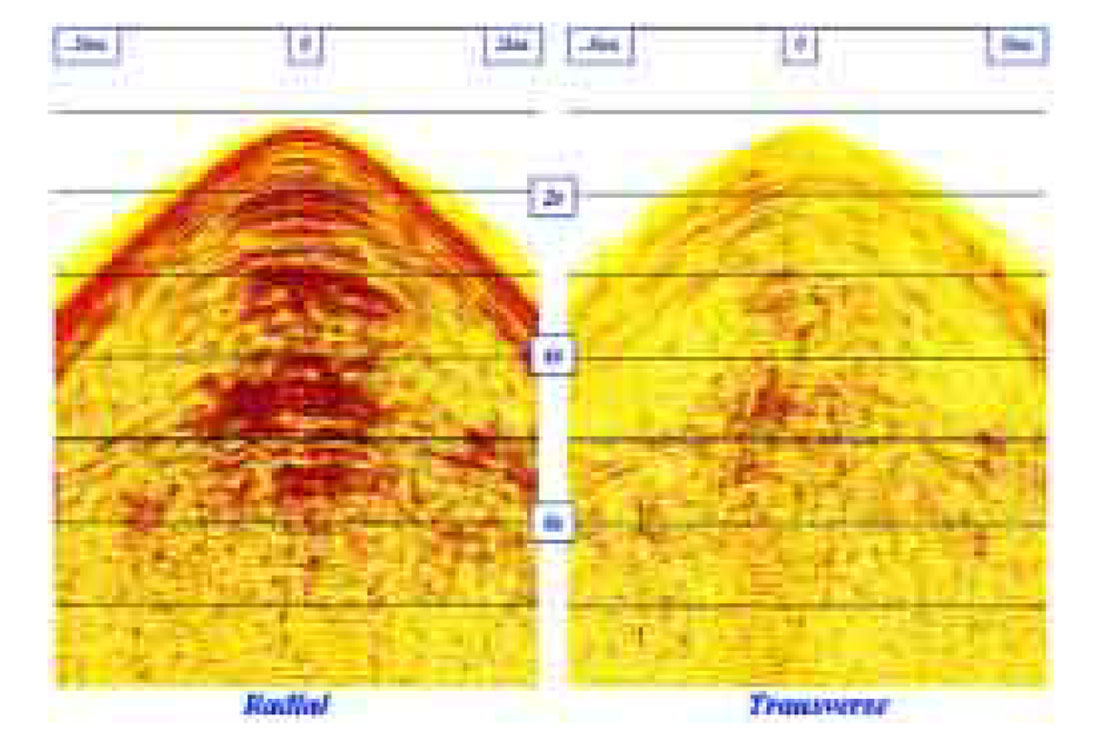
The data acquired was of high fidelity. Pressure and Vertical data (after 3C rotation) contain excellent PP data and no PS data (Figure 3). The horizontal radial and transverse components contain excellent converted waves PS data (Figure 4).
Figures 5-6 show stacks of the hydrophone P and vertical V data. These are overwhelmed by multiples. The P component and the V component data were combined to produce images from up-going and down-going waves (Figures 7-8). Further demultiple processing after the PV combination produced the migrated PP-wave image shown in Figure 9. The multiples are very much attenuated. The image from the streamer data (Figure 10) is superior, however. The lack of P and V components on the streamer data is more than compensated by higher fold.
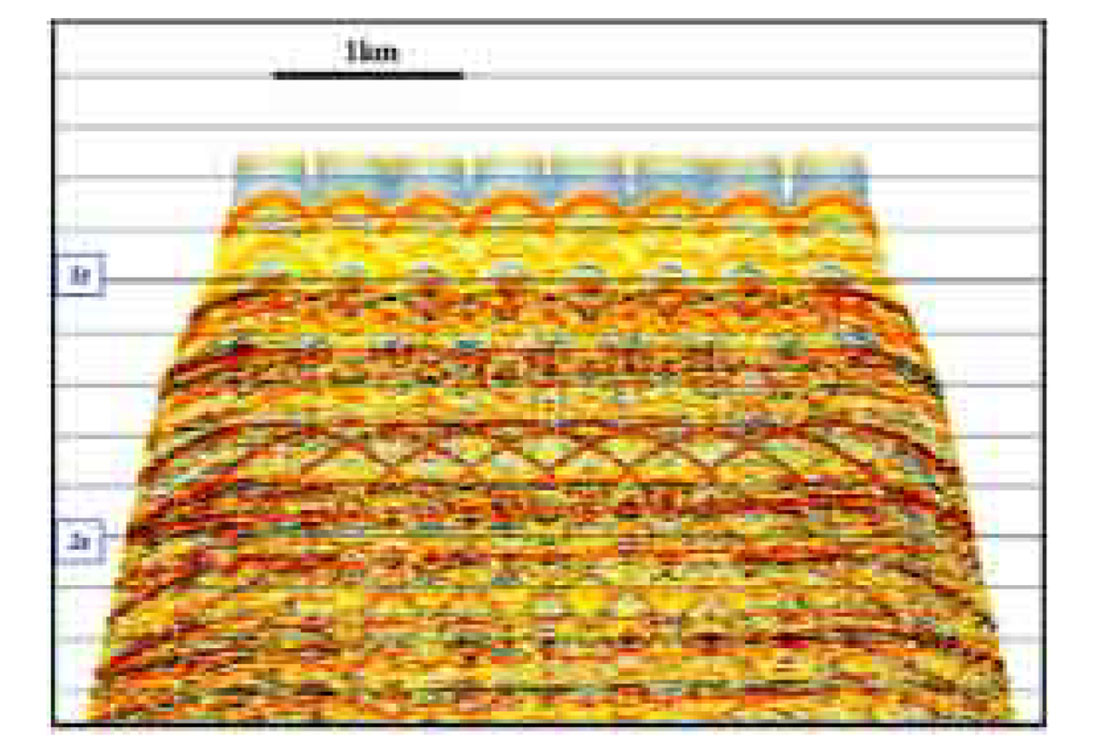
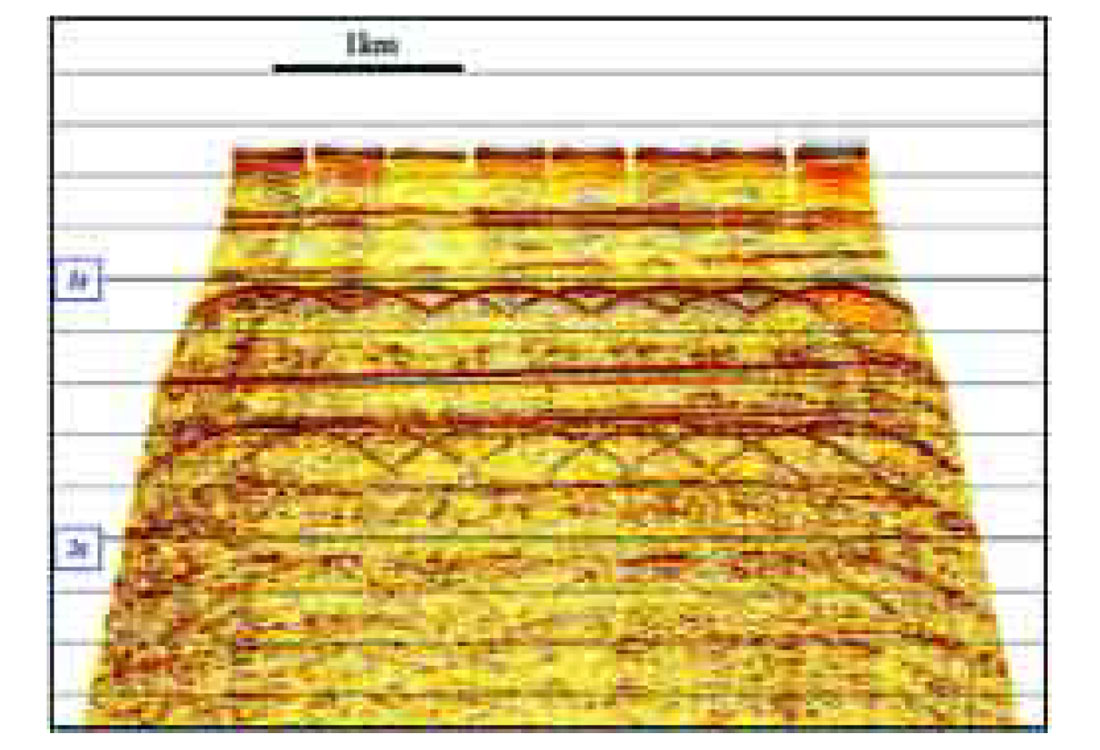
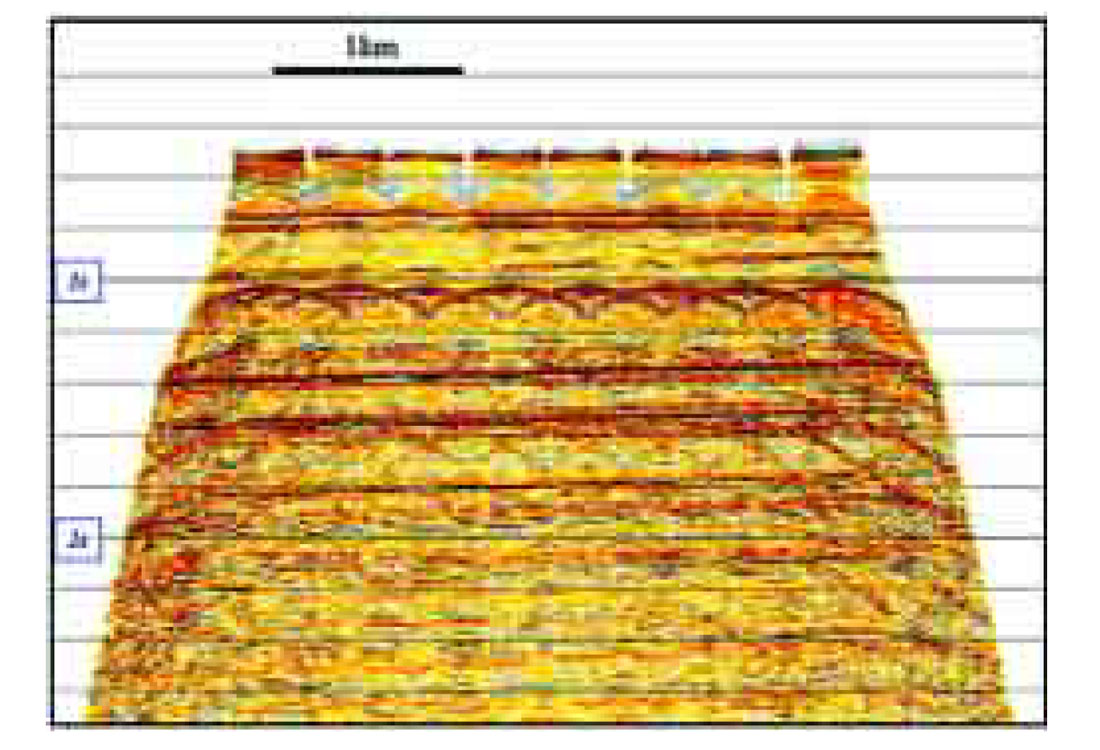
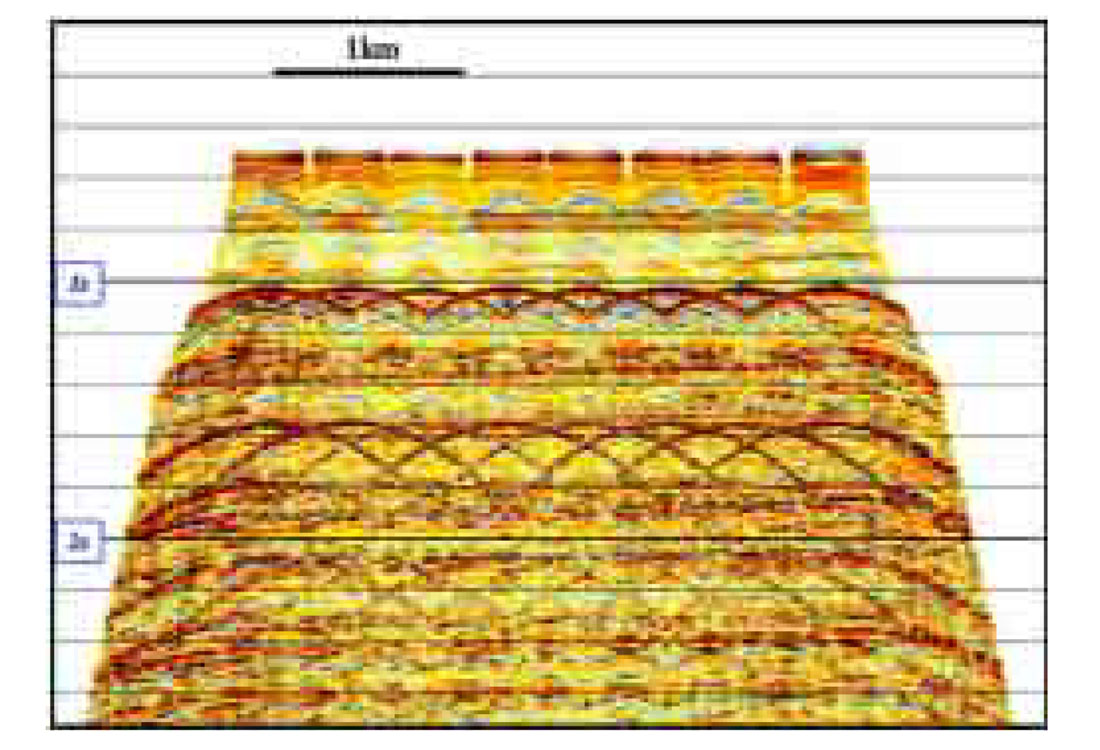
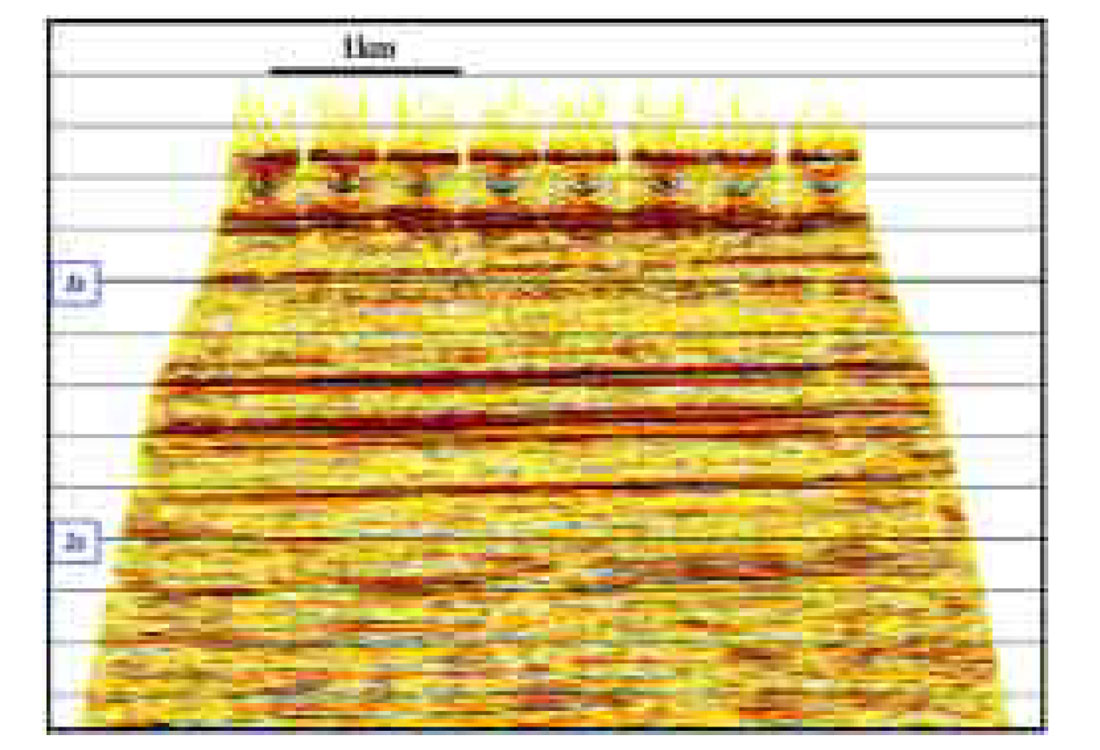
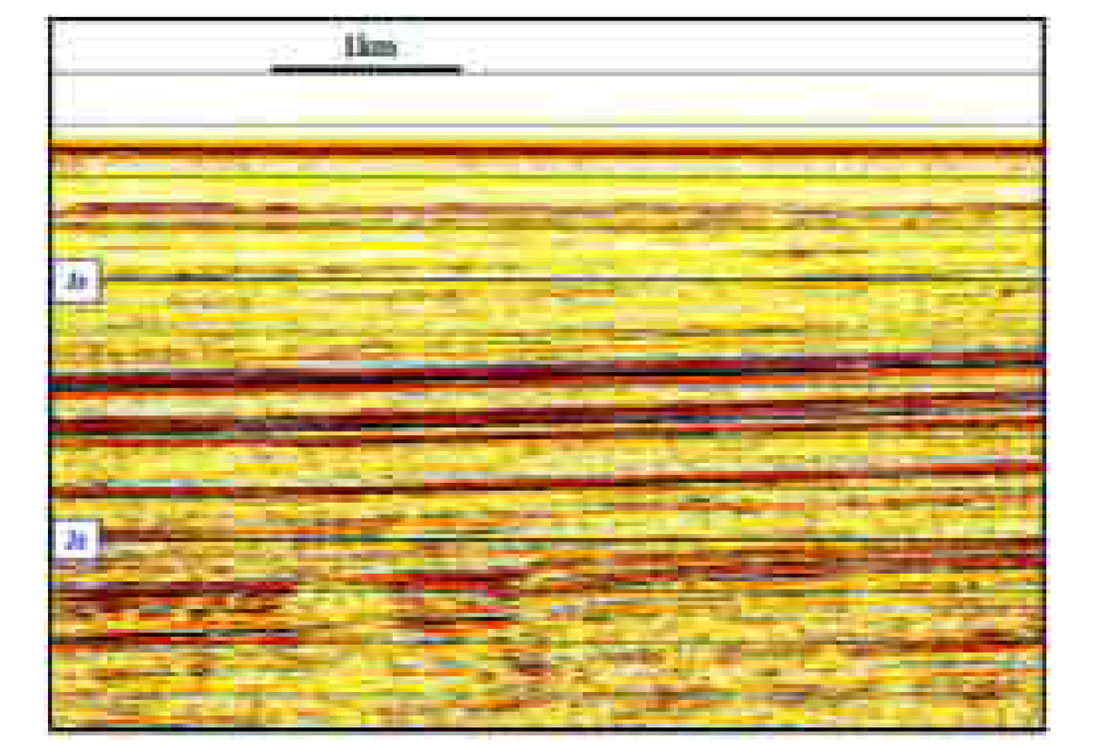
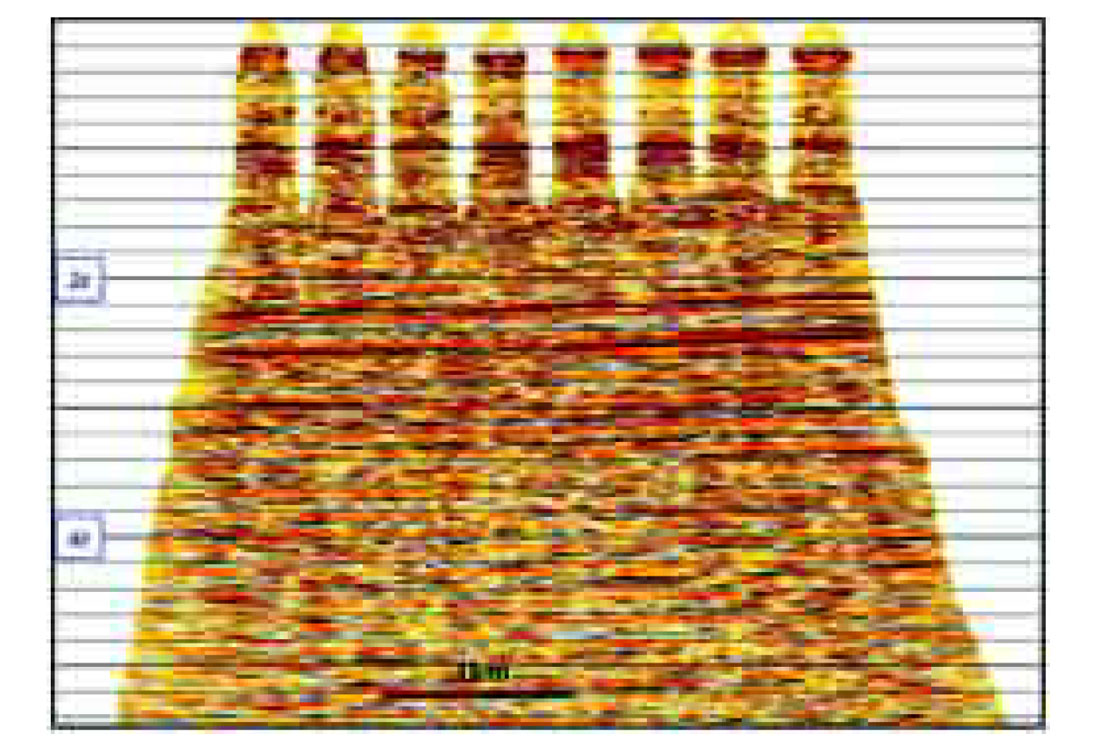
Figure 11 shows a migrated image of the stack of the horizontal radial component.
AVO analysis of streamer data depends on a priori VP/VS ratio, which is usually provided by well data. The sparse seabed data provide VP/VS ratio from moveout velocity analysis and from PP and PS event linking. Thus COBS provide an alternative to well data. In addition, the direct measurement of PP and PS AVO from the seabed data can be used for joint PP and PS inversion to validate and calibrate the 1C AVO. COBS can thus substitute for VSP and well log data to provide VP/VS ratio and calibration of the attributes generated from AVO and inversion of 1C surface seismic data.
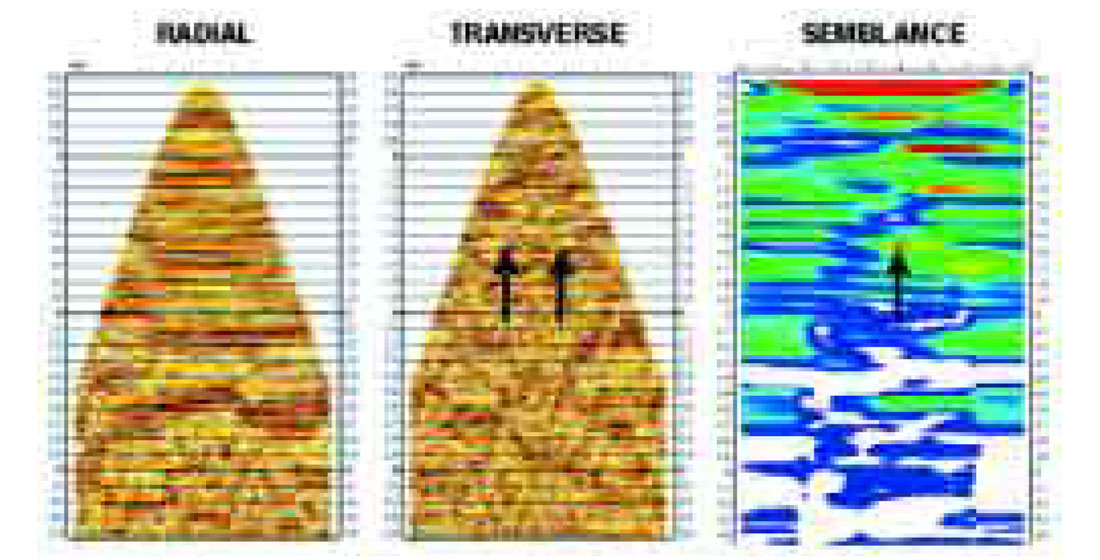
The sparse MC data provide excellent Azimuthal Anisotropy analysis (Figure 12). Our analysis method I based on the observation of Garotta and Granger (1988) that the transverse component data flip sign on when the shot-receiver azimuth is in either of the S1 or S2 azimuthal anisotropy directions. This information is very valuable for fracture and lithological characterization and can be further enhanced by collecting streamer data in multiple azimuths.
After our North Sea operation in summer 2002, we learned that Rob Stewart (personal communication) was involved in a contemporary OBS operation in the east coast of Canada in the White Rose area. Stewart and ourselves predict and observe similar benefits.
Onshore?
There are no streamers and no ocean bottom onshore. However, the idea of combined multi-component and single component data is of course applicable there as well. The economy onshore is different; the price differential between single component and multi-component data (taking into account the permitting, surveying, and shooting) is much less than the price difference between streamers and seabed. However, it will be (at least) a few years before all land crews will be multi-component. Meanwhile, it is possible to add sparse multi-components elements into single component surveys. The main challenge is the combined data analysis and this challenge is common offshore and onshore.
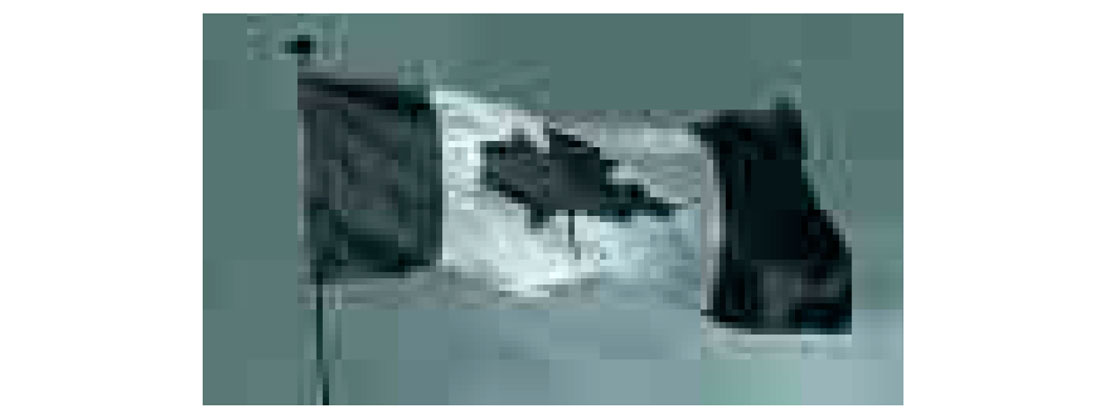
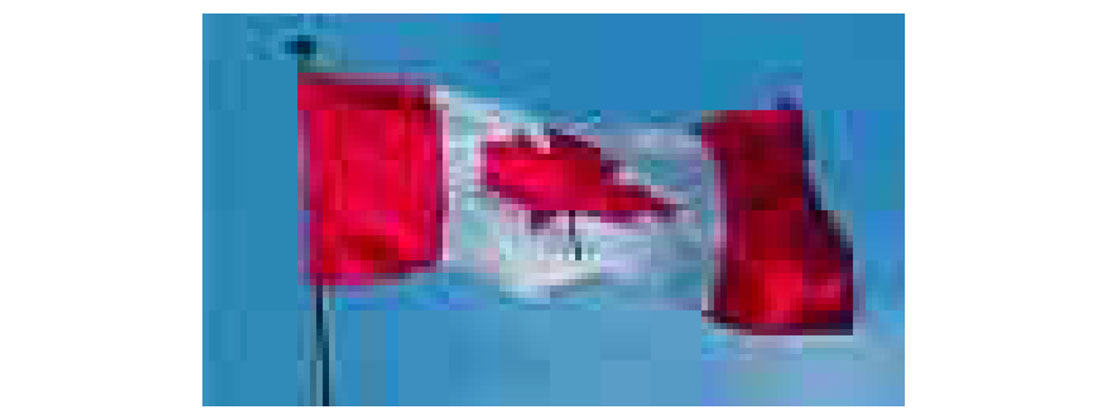
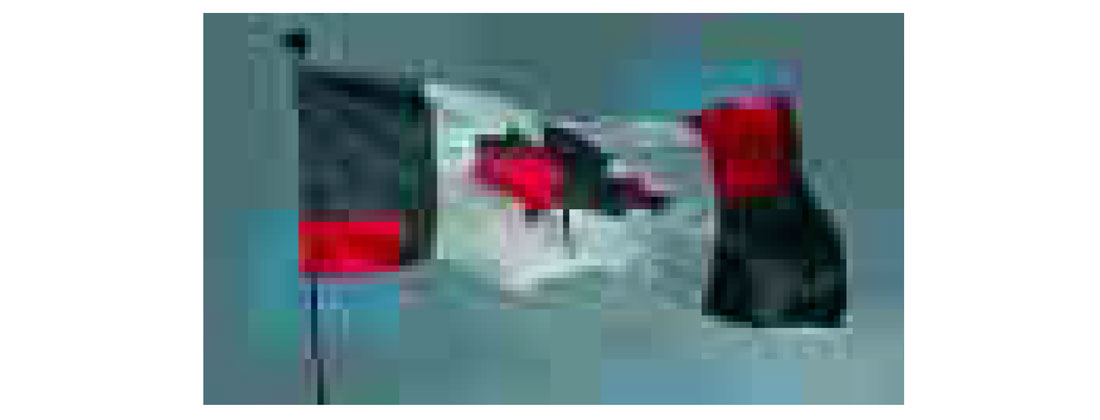
Photographic Analogy
A 20 year old analogy attributed to Cam Wason, then head of GSI research is that single component data are like black and white photography; reliable, sharp, and cheap. Multi-component data were compared to colour photography; not as sharp, more expensive, but were going to replace black and white. There are many limitations to this simplistic analogy. However, we would like to conclude this paper with a photographic demonstration. (Figures 13-15).
Summary
COBS provide great additional value for a small additional cost of acquiring and analyzing 1C streamer data. They have a much higher added value per added cost compared to conventional MC data from OBC. The benefits include improved lithological, fluid, and fracture characterization, improved illumination sub salt/basalt, and multiple identification.


Join the Conversation
Interested in starting, or contributing to a conversation about an article or issue of the RECORDER? Join our CSEG LinkedIn Group.
Share This Article