Nearly all producers in the oil/gas industry are now faced with weighing the benefits of an investment in large-scale visualization, a technology that has had profound effects on upstream development and existing field production for the major oil companies.
The financial and human resource commitment to a visualization methodology is substantial, however, the returns on the investment are dramatic. The benefits are distinct, large and obvious enough to drive well over 100 facilities into existence since the beginning of 1998.
It's no longer an experiment, it's an accepted competitive edge that everyone in the industry needs to evaluate. The questions is: Where do you start?
This article is meant to provide a first step primer to help you on your way.
It starts with a keen evaluation of the business case.
Fortunately, the "value testing" for this powerful combination of computing, software and display technologies has been well established among the majors, with some companies deploying entire networks of facilities. The deployment could be as dense as one facility per asset team, but more often is one facility per location.
Today, the experience, expertise and success stories are plentiful enough in the industry, that with a little investigation and a few phone calls to colleagues, you are well on the way to making a solid business case to your management. For the majors, a return on investment has been as fast as one operating quarter but typically it is agreed to be less than a year. Although more dramatic stories abound, you can reasonably expect a large-scale visualization capability to reduce project costs and/or field errors by 5-10%. The software providers (See list box) are often very good reference sources to start with, but it is from the actual practitioners, your fellow users of the technology, that you will glean your most direct insights. OK, So much for the business case, what's next?
The next step is to get an overview of the requisite components and the value each of them brings to the endeavor.
Large-scale visualization is comprised of three component technologies.
Software: It starts with stunning application software that is capable of manipulating the industry's vast databases into meaningful 3D and stereoscopic visuals. The real benefits come from the ability do these visual interpretations in real time. The software allows you to explore and postulate dozens of ideas and scenarios in minutes that would have taken weeks, or perhaps months using traditional methods.
| Visualization Software Sources | |
|---|---|
| Company | Application name |
| Landmark | Earth Cube |
| Magic Earth | GeoProbe Paradigm |
| Geophysical | VoxelGeo |
| Schlumberger | GeoQuest |
| Dr. Larry Mayer | Fledermaus |
| Jason GeoSystems | GeoScience Workbench |
Computing hardware: The second component is the computer hardware. It needs to have the power to manipulate these vast databases and the computers need to be fast enough so that the user's exploration of the possibilities is not hampered by the hardware. Anyone who has gone from slow modem to broadband exploration of the Internet knows exactly what this means. Without the performance, many issues just aren't worth exploring! Of course it is crucial that your computer platform not only have the performance, but that it is also fully compatible with the software you plan to use. It also needs to be compatible with the software you are currently using. Finally, the computer needs to be configurable to display on a large screen system.
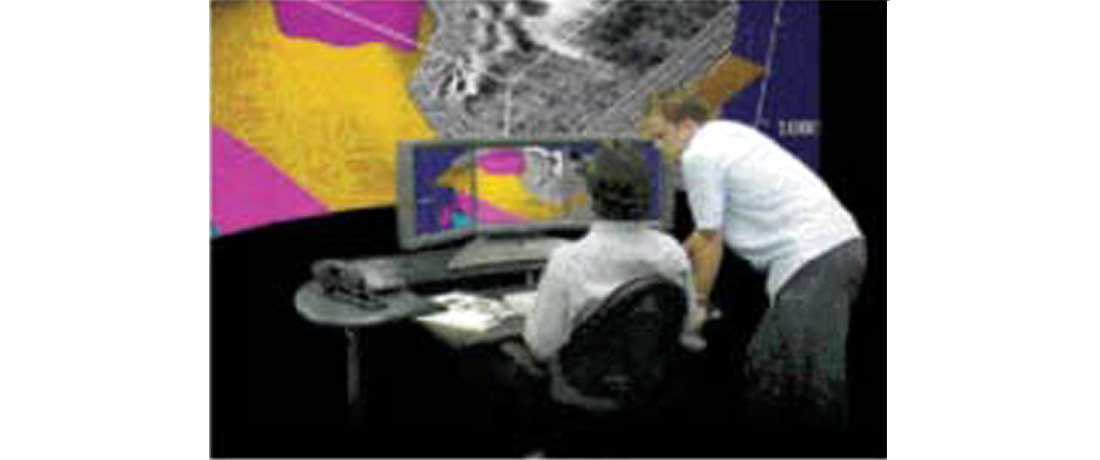
Visual Facility: The third component is the visualization facility itself with its Group Virtual Reality (GVR) visual environment. The entire facility is designed to promote interaction and collaboration between the key disciplines involved. It is the very existence of this facility that gets your team out from behind their desks and engenders the collaboration process. This is the most valuable aspect of large-scale visualization, with each member providing the insight of their discipline to the decision making process, interactively, and in real time. In this media environment, the geologist, geophysicist, hydrologist, petrophysicist, pipeline engineer, drilling engineer, project manager and others, all interact with one another against the data resource. All the issues and alternatives are explored in real time with each team member providing their analysis.
| Visualization Software Sources | ||||
|---|---|---|---|---|
| Brand | Series and OS | Oil/Gas Software | Performance | Pricing |
| SGI | Onyx Series OS: Irix | Good software support | Good performance and large data sets | Very expensive |
| Hewlett Packard | sv6 Architecture OS: HP-UX | Limited software support (currently) | Fully scalable performance | Scalable in price |
| Sun Microsystems | Sunblade 1000 with Expert 3D cards OS: Solaris | Good software support | Acceptable performance for limited size data sets | Very affordable |
The work product of this combination of a software, computer and visual environment is increased insight, collaboration, and better, faster, more accurate decisions. It's really a combined application of technology and social interaction to solve and resolve complex decisions. And it's VERY powerful!
So much for an overview.
The next step is gathering information and evaluating your options.
You probably already have software experts in house. They can contact the visualization software providers and get you going on an evaluation. You probably also have solid, in-house computer expertise via your IT team. Once again you can fast track these issues, but know this: Your standard NT box is probably not going to get you there. You will be acquiring some heavy iron to accomplish this task.
That leaves one mystery piece, which no one in your organization is likely to have much experience with... The integration of a GVR visual environment such as those Panoram makes! What is it? Why do you need one? What are the types? What are the benefits of each type?
The GVR visual environments go by many names: HIVE, Reality Center, Visionarium, Decisionarium, Holodeck, TerraDeck, CAVY, iCenters.... In fact, what started with the vendor community trying various "branding" tactics has turned into a creative and enjoyable exercise for each new user group inventing their "handle" for their facilities.
As indicated above, from a non-technical perspective, a GVR visual environment is where you bring the multi-disciplinary asset management team together to immerse them in real-time manipulation of data.
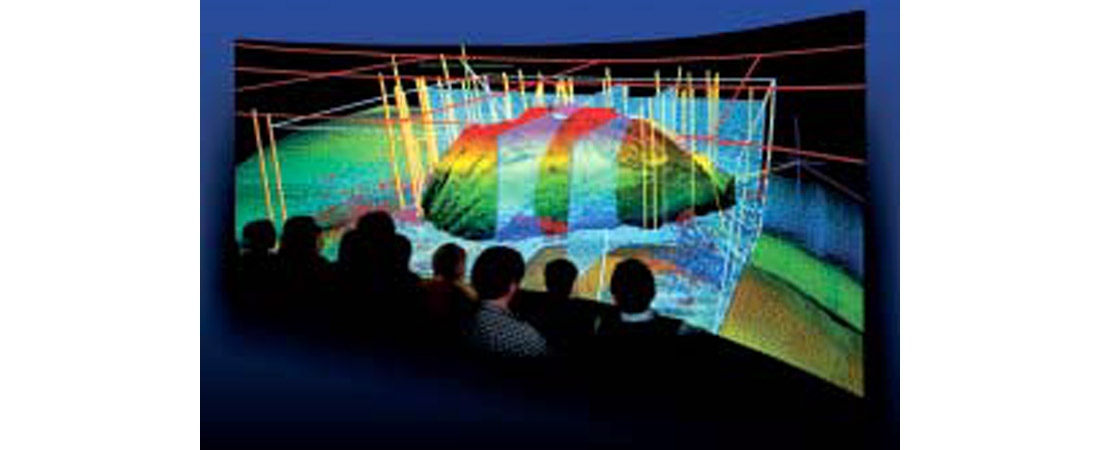
From a technical perspective, the facility is a super-resolution (2.5 — 4 MegaPixel), 3D, stereoscopic, display environment that accommodates 3-20 people. It is big enough for a group to work together and often consists of multiple projectors, seamlessly stitched together into a single composite image. The system is designed to let the group see more, understand better and decide quicker about what to do, where to do it, and how to approach a problem.
The most popular type of system in the oil/gas industry is the curved screen solution. The system is typically three projectors seamlessly arrayed onto a cylinder type screen.
The second type is the flat screen. Again it is typically two or three projectors seamlessly arrayed either a front projection or a rear projection screen.

So, for the large-scale facility you have curved, flat, front and rear projected systems. Let's examine each choice.
Curved Screen
A curved screen provides the ability to put more screen surface into a smaller space. Perhaps the most important benefit is the reduced fatigue factor. As the group views the data from a central location, the viewer's focal distance to the screen is generally maintained. If the same size screen is laid out flat, the ends are much further away from the viewer than the center. During a long work session, this constant refocusing is very tiring and can be detrimental to the concentration of the team.
Many engineering oriented visualization facilities, however, use a flat screen. This is because they are typically reviewing CAD design data with the core of their insight coming from seeing 3D, stereoscopic objects in real size. These objects are more easily understood from a flat plane. For most oil/gas applications, the users are immersing themselves in more abstract data environments where concentration and interpretation are core.
Atypical curved screen is very long and skinny with the image more than three times wider than it is tall. When flat screens are used, it is often a good idea to square this up a bit and to design an aspect ratio closer to twice as wide as tall.
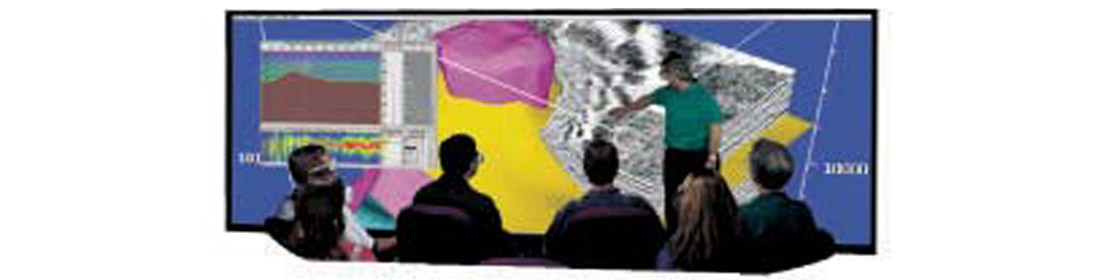
Also on a flat screen, you have the choice of front or rear projection. There are, as always, advantages to both choices. The preferred system is typically rear projected. This moves all the heat and noise of projectors into another room and best of all, allows you to walk right up to the screen without your body getting in the way of the projected image. It makes for an exciting presentation environment with the ability to parade in front of a 20-30 foot wide screen.
The disadvantage of rear projection is that you must give up valuable facility real estate for nothing more substantial than photons. Typically a 9 to12 foot deep area is required. The light path is folded using front surface mirrors in order keep the rear projection space to a minimum. This back room often doubles as the equipment and computer room putting all the hot, noisy, and heavy electric consuming gear into one space.

NOTE: It is technically possible to have a curved, rear projected system, but this is generally impractical from a facilities standpoint. The projector light path must then "porcupine" outward taking up vast amounts of real estate. It CAN be done, but unless you have a warehouse type space, you probably do not want to.
Another format that has found some application in oil/gas is the virtual reality cube.
Again there are several brandings for this technology including CAVE(tm), I-Space and HoloSpace. In these environments, you stand inside a cube that has at least three sides and as many as all six sides filled with projections. You wear stereoscopic goggles and a device known as a "head tracker" so that you are fully immersed in a near holographic environment. With the head tracking, the 3D objects realistically change perspective as you change the position of your view.
Although this is very exciting technology, it fails to meet some of the core criteria for large-scale oil/gas visualization. These systems take up a huge amount of room. Additionally, they are not well suited as collaborative environments. Only one person can wear the head tracker. Every one else standing in the cube is a passive participant with a potentially strange view of the data. Because these cubes are typically 4-6 channel systems, they require expanded computer and projection resources. This makes them an extremely expensive resource aimed at a very limited audience. Finally, you physically stand in these environments. Though they are impressive during demonstrations and presentations, they are exhausting to work in for extended periods.
Next, let's examine resource allocations. What are the general requirements in physical space, budget and staff?
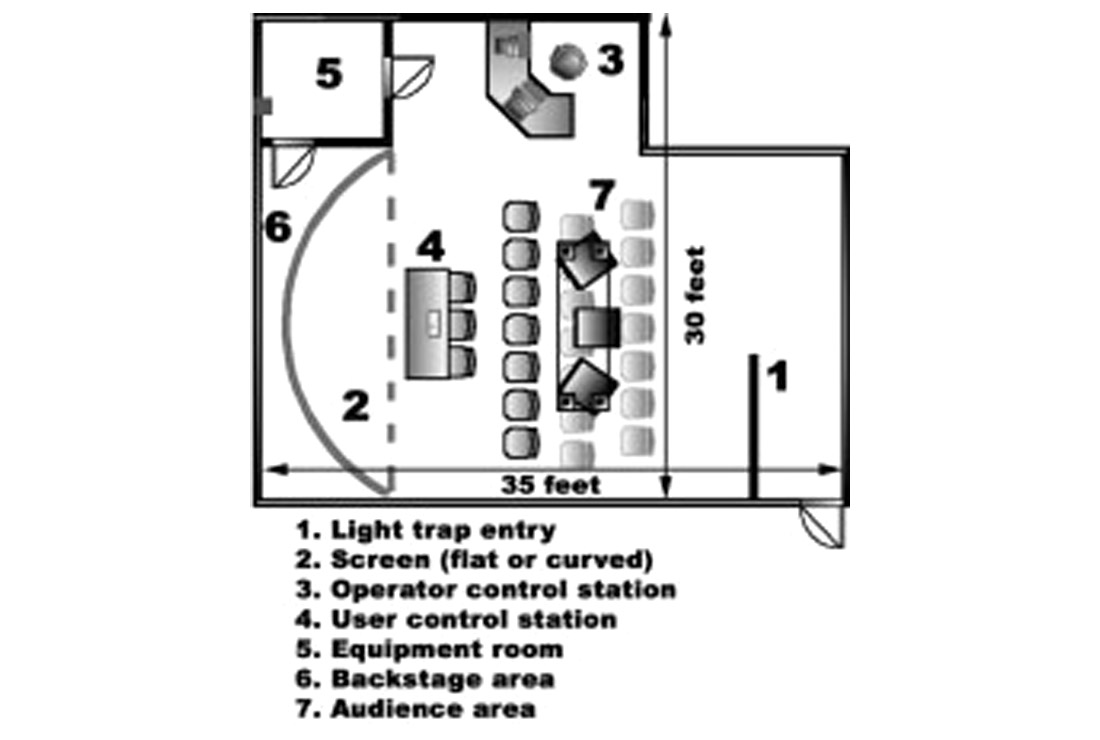
As far a physical space goes, the ideal space is 40' X 50' X 15' to accommodate work groups of 10-15 as well as full presentation capabilities for 30-40 people. Of course, no one ever has that kind of space. 30' X 40' rooms can be found, but that 15' ceiling height is very rare!
Most often, these visualization facilities are fit into existing buildings with standard 9' drop ceilings. The room allocations tend to range from 30' X 30' and up. This is adequate for front, rear, curved or flat systems.
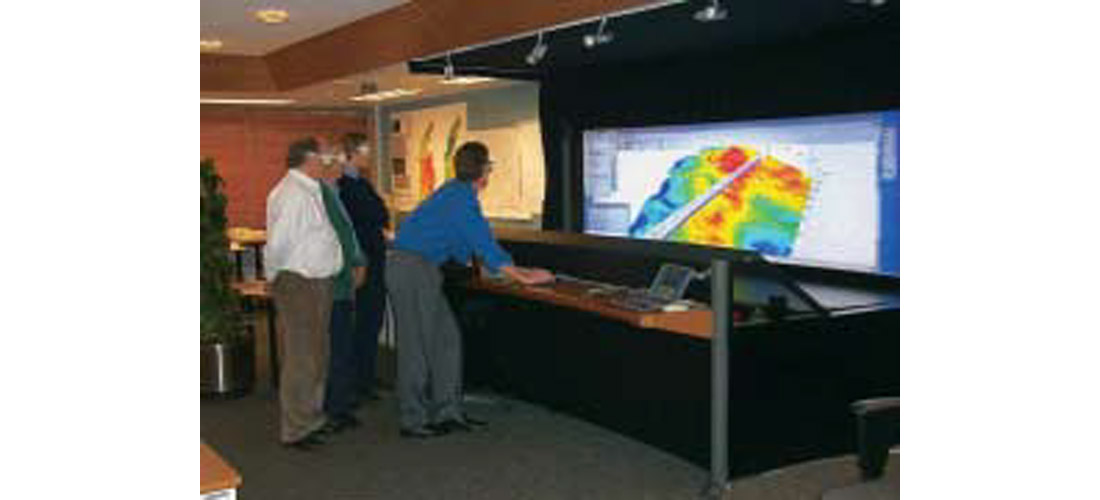
If you have space restrictions, there is another category of visualization system that provides nearly all the benefits of the large scale systems, but are smaller, totally free standing, and require no facility modifications. These are called WorkGroup systems and can make an ideal entry point for organizations that are not ready to commit the physical space or may be considering a single facility to be reallocated to other asset teams on an annual basis. These systems can be fit into facilities with standard height ceilings and into rooms as small as 20' X 20'.
To help you work through this, visualization system integrators like Panoram will typically visit your site and help you work through the physical space issues including HV/AC, electrical, lighting, room layout, room treatment, acoustics and space planning. The integrator will then work with your facilities people to do a final design and draw up plans. Remember that you are not buying hardware, you are buying a capability and the facility plan is as important as the equipment.
The cost of a facility is highly variable but some general guidelines are helpful. A full facility such as those at the major companies will typically have a budget between $600,000 to $900,000 including all hardware, requisite facility modifications, furnishing, lighting etc... Fully functional facilities can be put in place for as little as $350,000. In today's leasing market, this means a monthly cost between $5,000 and $15,000 including maintenance.
If you are simply trying to get your feet wet in this area, you can begin with a simplified facility at under $150,000 and still have a collaborative, 3D, stereoscopic, high brightness projection facility. The main restriction is image size, resolution, maximum data size and performance.
The most basic entry point would be a desktop visualization capability. An example would be a Panoram PV Series display combined with a Sunblade 1000 computer fitted with three Expert 3D-Lite Cards. This type of package is under $50,000 and although not stereoscopic, still provides 3.8 million pixels resolution, on a wide format screen, with a mini collaborative environment for 2-3 people.
Staffing is another cost consideration. Some organizations dedicate a full time employee to the facility. This employee manages the data, prepares the sessions and operates the facility and is often called the "Pilot".
Equally as often, there is no dedicated employee. Someone within the technical staff takes responsibility for general operations but each user group operates in the room independently without support.
In summary, large-scale visualization is a proven tool for upstream development, planning and field operations in the oil/gas industry. You can make a solid business case for getting into the technology with a reasonable expectation of a return on your investment in 1-4 operating quarters. There are several facility types, computer platforms and software choices that need to be sorted through based on your budget, legacy infrastructure and project scale. Your investment to get into the technology will range from an entry-level lease cost of $800 per month to $15,000 per month for a full-blown facility.
The best of luck with your research and may the forces of insight be with you.

Acknowledgements
This article was originally published in “Offshore”, April 2002.


Join the Conversation
Interested in starting, or contributing to a conversation about an article or issue of the RECORDER? Join our CSEG LinkedIn Group.
Share This Article