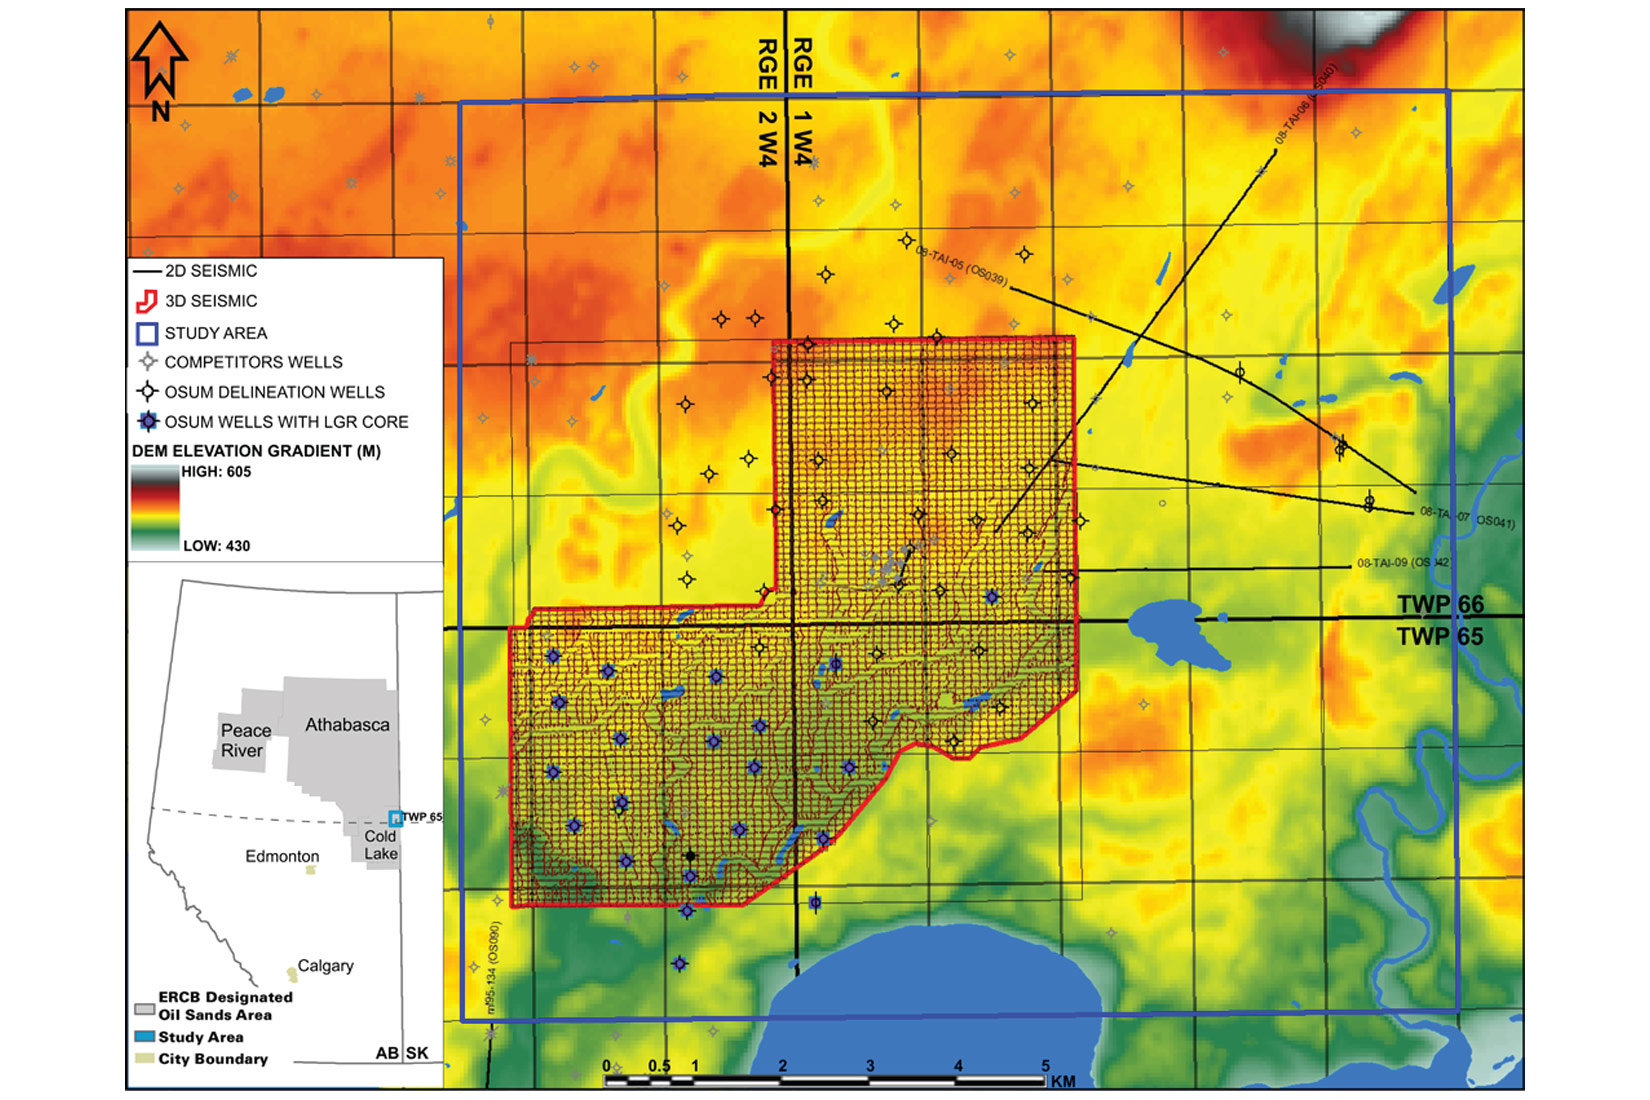
The Alberta Energy Regulator estimates 10.0 billion m3 (62.9 billion barrels) of bitumen initially in place within the Albian-aged Lower Grand Rapids Formation (LGR) in the Cold Lake Oil Sands Region (Marsh and Honarvar, 2014). Despite this significant resource estimate, development of the zone lags behind other bitumen reservoirs in Alberta. Current thermal development of the LGR is from the Wolf Lake B10 SAGD (steam-assisted gravity drainage) project operated by Canadian Natural Resources Ltd. that exploits shoreface sandstones. Husky Oil Operations Ltd. has recently begun piloting SAGD in LGR channel sandstones. The Taiga Project described in this study is located in Townships 65-66, Ranges 1-2 W4 at the eastern edge of the Cold Lake Oil Sands Region (Figure 1). It will also employ SAGD in the LGR.
During Mannville deposition the regional transgression of the Boreal Sea led to deposition of the shales of the Clearwater Formation (McLean and Wall, 1981, Hayes et al., 1994). In the Cold Lake area, Clearwater deposition is associated with a change in sediment provenance with Cordilleran sources dominating, and pre-Clearwater sediments were derived mainly from the Canadian Shield (Williams, 1963; Mellon, 1967; Putnam and Pedskalny, 1983). The Cordilleran sediment was transported by fluvial systems feeding northward prograding shorelines of the LGR at Cold Lake. These shorelines were repeatedly incised with valleys and channels during sea-level falls that were subsequently filled during sea-level rise (Maynard et al., 2010).
In the study area, we show complex stratigraphy similar to that displayed within Maynard et al. (2010) approximately 40 km east-northeast of their study area. Analysis of the high-resolution 2D and 3D seismic data, including both compressional and shear components, tied with densely-spaced wells with petrophysical logs and core has allowed us to accurately characterize the stratigraphy and reservoir properties of the LGR shoreface and channel reservoirs. Additionally, we define a complex incised valley of non-reservoir facies that appears analogous to the valleys interpreted by Maynard et al. (2010). Study results have allowed us to increase our mapped pay and will be used to optimize future pad locations, horizontal well placements and well performance once the Taiga Project moves into development.
Dataset and Methods
Well Data
The majority of the delineation wells at Taiga were drilled by Osum Oil Sands Corp. (Osum) from October 2008 to April 2009 prior to the interpretation of seismic data. The study area includes sixty-five wells and twenty-one of those wells were cored through parts of the LGR (Figure 1). The petrophysical program for most wells included a standard suite of logs: caliper, spontaneous potential, gamma ray, density, neutron, laterolog and photoelectric effect. Dipole sonic logs were run in six wells and formation micro-imaging logs were acquired in five wells. Cores were subject to V-notch Dean Stark analysis to measure porosity and bitumen saturation. Small plugs were sampled and used to provide estimates of porosity (as measured by Boyle’s Law) and permeability. After analyses were completed the cores were slabbed and described. Vshale logs were calculated and depth-corrected from core photo analysis. Facies were assigned based on examination of lithology, grain size, sedimentary structures and biological structures. The genetic interpretations of these facies were used to identify and map major flooding surfaces and parasequence boundaries.
Seismic Data
In March 2009, Osum acquired the 31.5 km2 three-component 3D seismic dataset and 9.3 km of 2D seismic over four 2D lines (Figure 1). The area is situated within the Boreal Forest in which rapidly to imperfectly drained uplands are dominant. In this area field operations are best accomplished when the ground is frozen as this enables easier access and optimal seismic geophone coupling. The nominal 3D acquisition geometry was source lines every 100 m oriented north-south and receiver lines every 80 m oriented east-west. A natural bin size of 10-by-10 m was chosen, which resulted in 20 m shot and receiver intervals. Sources were single dynamite charges of ¼ kg loaded to a depth of 12 m. The four 2D lines used receiver intervals of 10 m and source intervals of 20 m, and source shots were dynamite charges of ½ kg loaded to a depth of 12 m.
Seismic Resolution
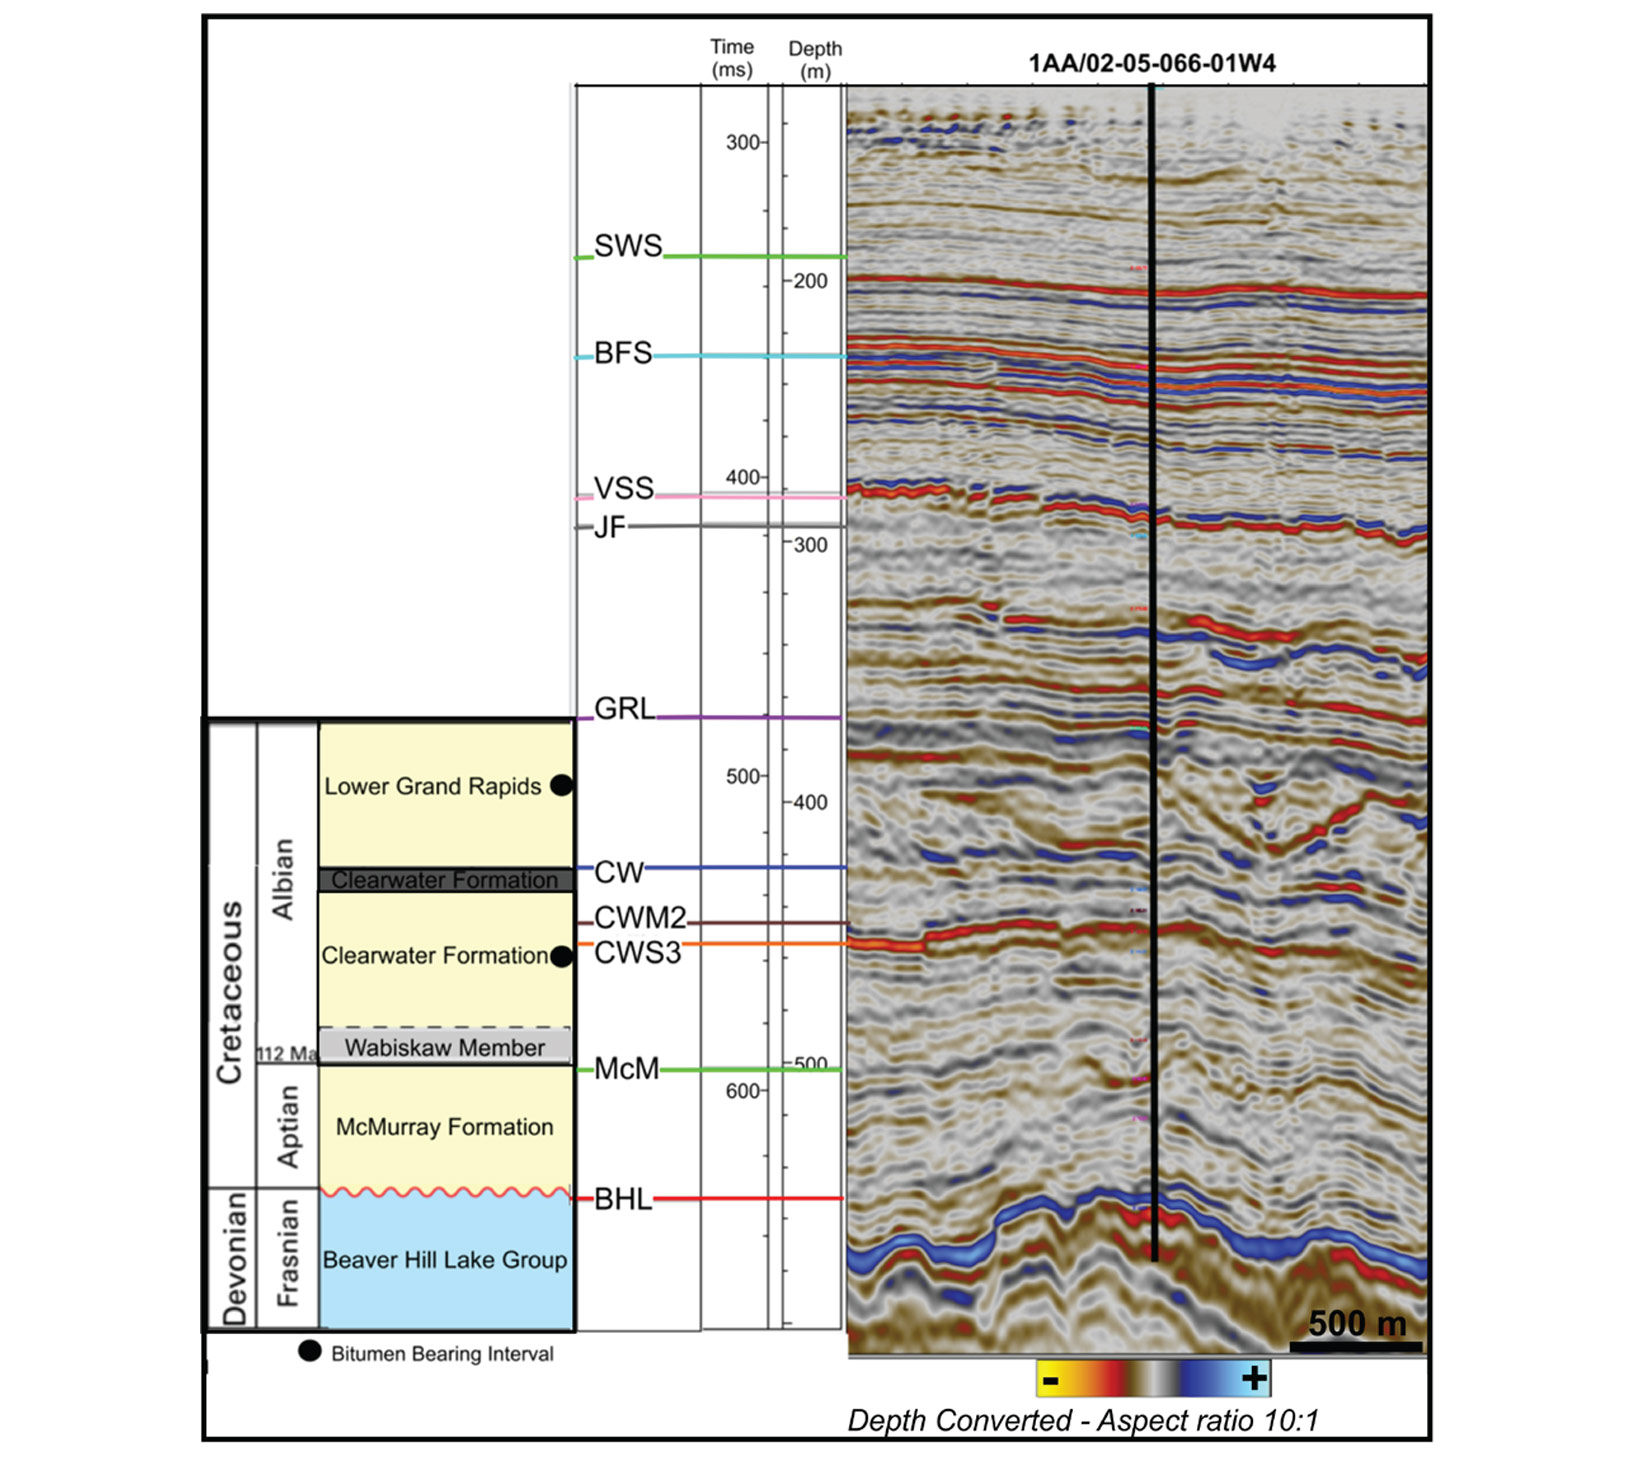
The signal to noise ratio of this seismic dataset is high with a signal band extending from 10 to 200 Hz (Figure 2). The wide bandwidth combined with the shallow target depth of ~375 m and relatively unconsolidated low-velocity strata allows a vertical resolution of 3.0 m. The average interval velocities for the LGR reservoir and non-reservoir rock varies from about 2250 m/s to 2600 m/s. The bulk density of the reservoir and non-reservoir rocks of the LGR varies from about 2.0 g/cc to 2.3 g/cc which provides more distinction than the changes in interval velocity; this density contrast is significant for defining internal LGR stratigraphy.
Seismic Data Processing
The compressional-wave (PP) data from the multi-component 3D dataset was processed with an amplitude versus offset (AVO) compliant processing workflow. The resulting conventional pre-stack time migrated stack volume was used to tie well synthetics, pick horizons and build a stratigraphic framework. The pre-stack time migrated gathers were used as the input for a simultaneous pre-stack inversion (Figure 3).
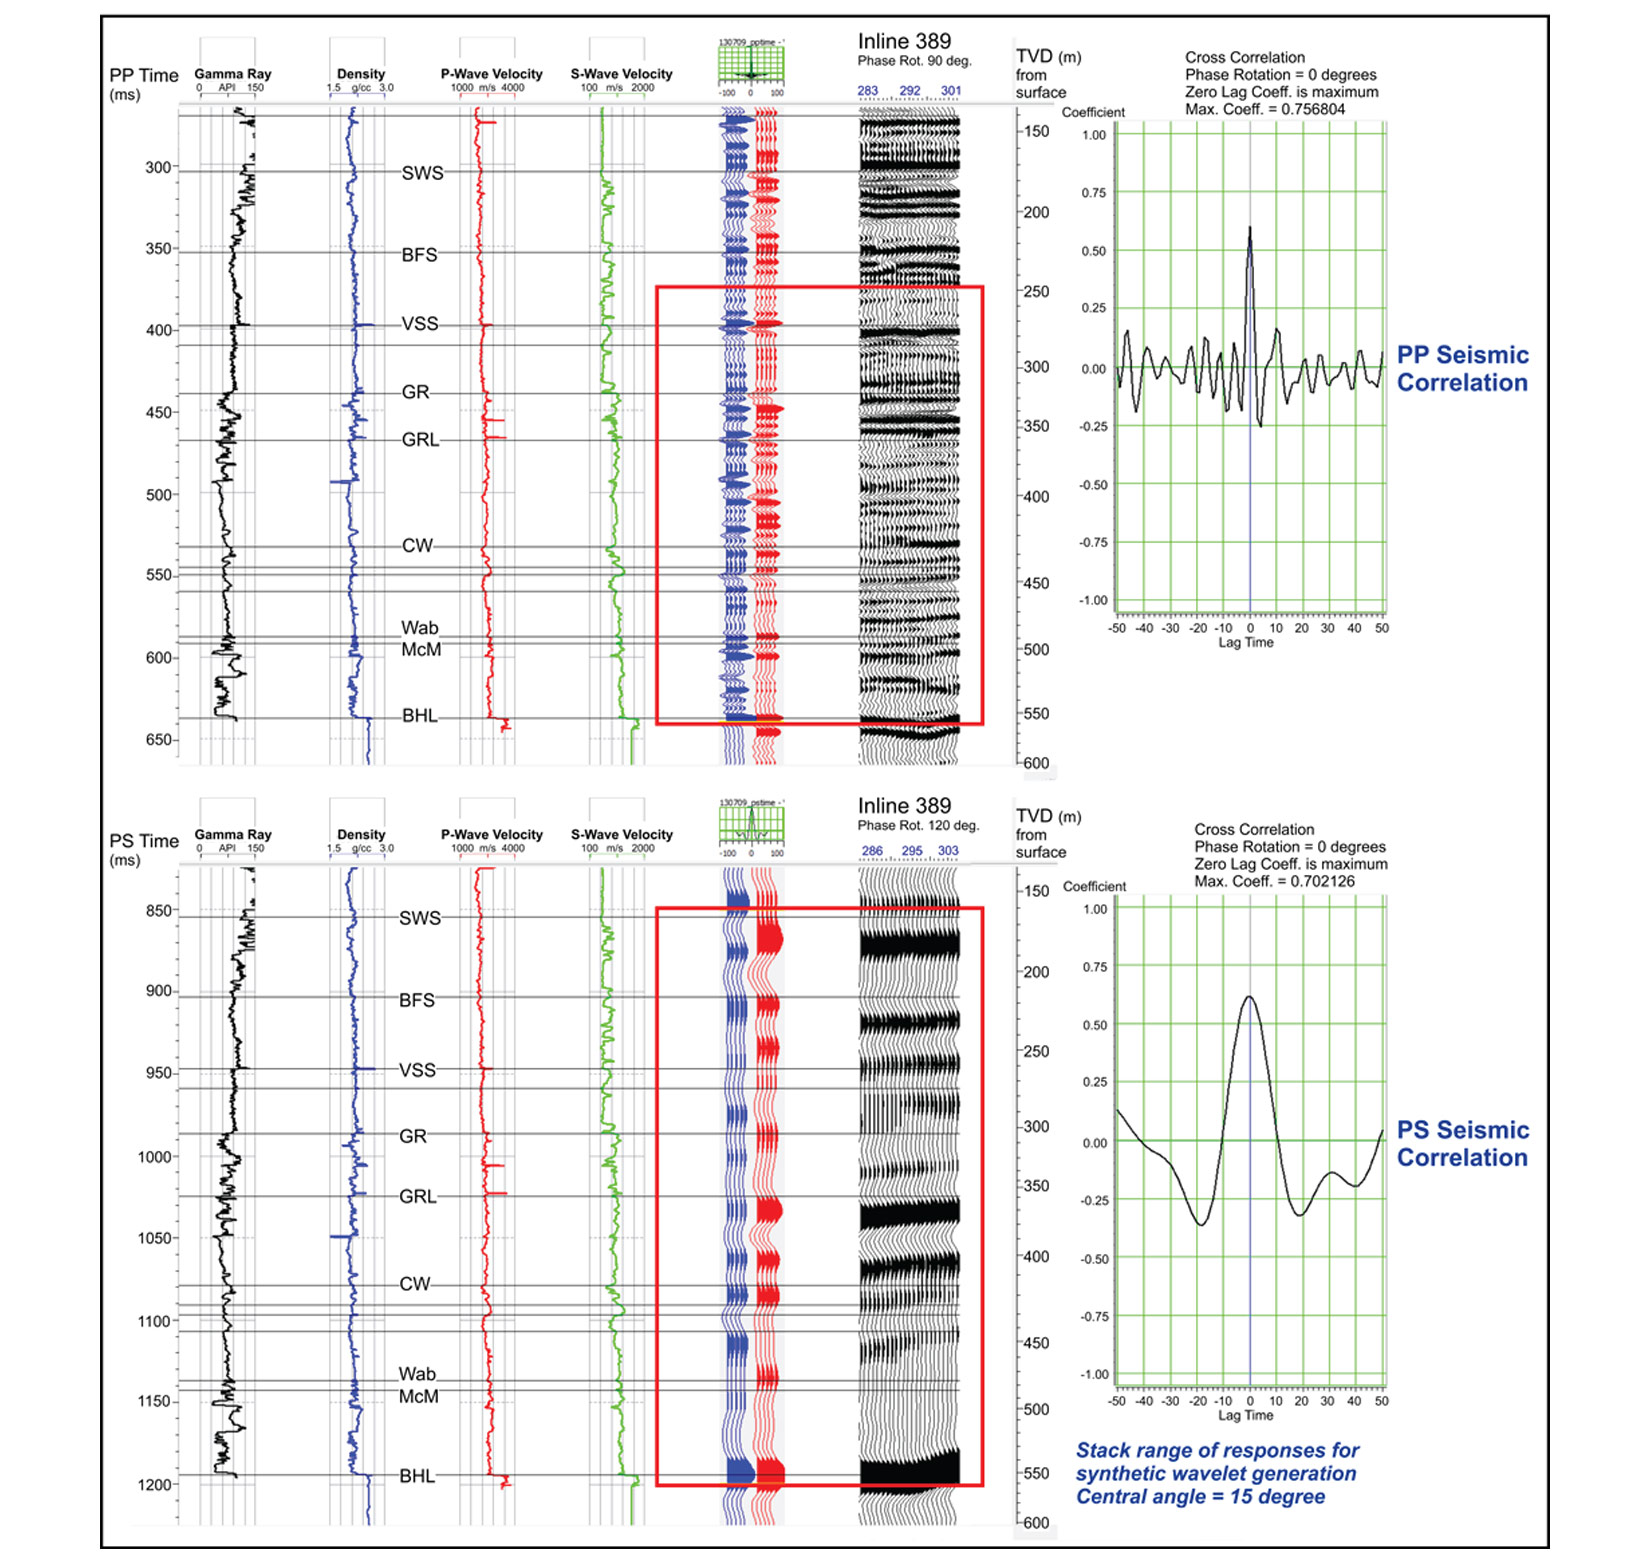
The converted-wave (PS) data was processed to a radial layer-stripped, post-stack-time-migrated, stacked PS volume. Shear-wave splitting analysis was applied using a method similar to Bale et al. (2009). The principle anisotropic shear-velocity component orientations and magnitude S1 (fast) and S2 (slow) were determined from two layers using a layer-stripping method. The anisotropic velocity effects were then corrected in the stacking process to improve the amplitude and resolution of the final stacked PS volume. Dipole sonic logs were used to create PS seismic synthetics to tie geologic horizons to the PS volume (Figure 3) and to register the PS to the PP volume.
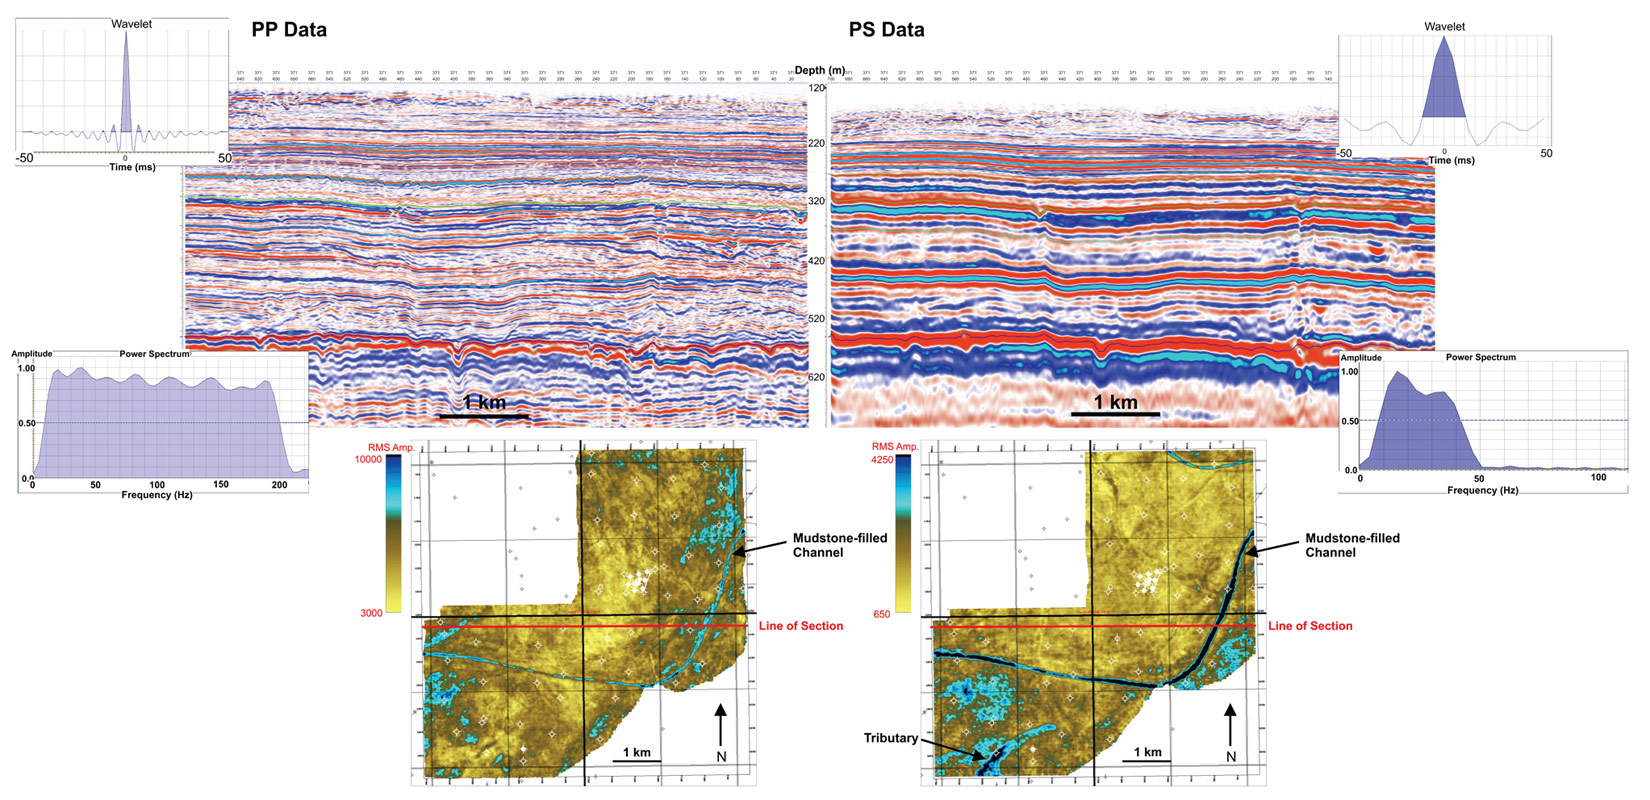
A comparison of the PP and PS stack volumes, both converted to depth, and their power frequency- spectrum estimates is shown in Figure 4. The PP data has higher frequency content as shown by the power spectrums for both volumes. The PS data bandwidth from 8 to 42 Hz is less than the PP data, and the vertical resolution is similarly less, but the decreased bandwidth is compensated for with the slower shear velocities, as can be seen with these two sections displayed in depth. More importantly, the shear reflection energy is more sensitive to fractures and lithology changes, including high-angle faults and mudstone-filled channels.
Chaos Attribute Volume
A chaos attribute volume aided in the definition of structural and stratigraphic features such as faults, channel fill and valley edges, and valley fill architecture (i.e. scroll bars) (Figure 5). The multi-trace chaos attribute (Randen et al., 2000) is a measure of the lateral similarity of the seismic signal; areas that are not laterally similar are defined as chaotic. The volume was generated by applying a multi-trace, three-dimensional edge detection algorithm to the PP data.
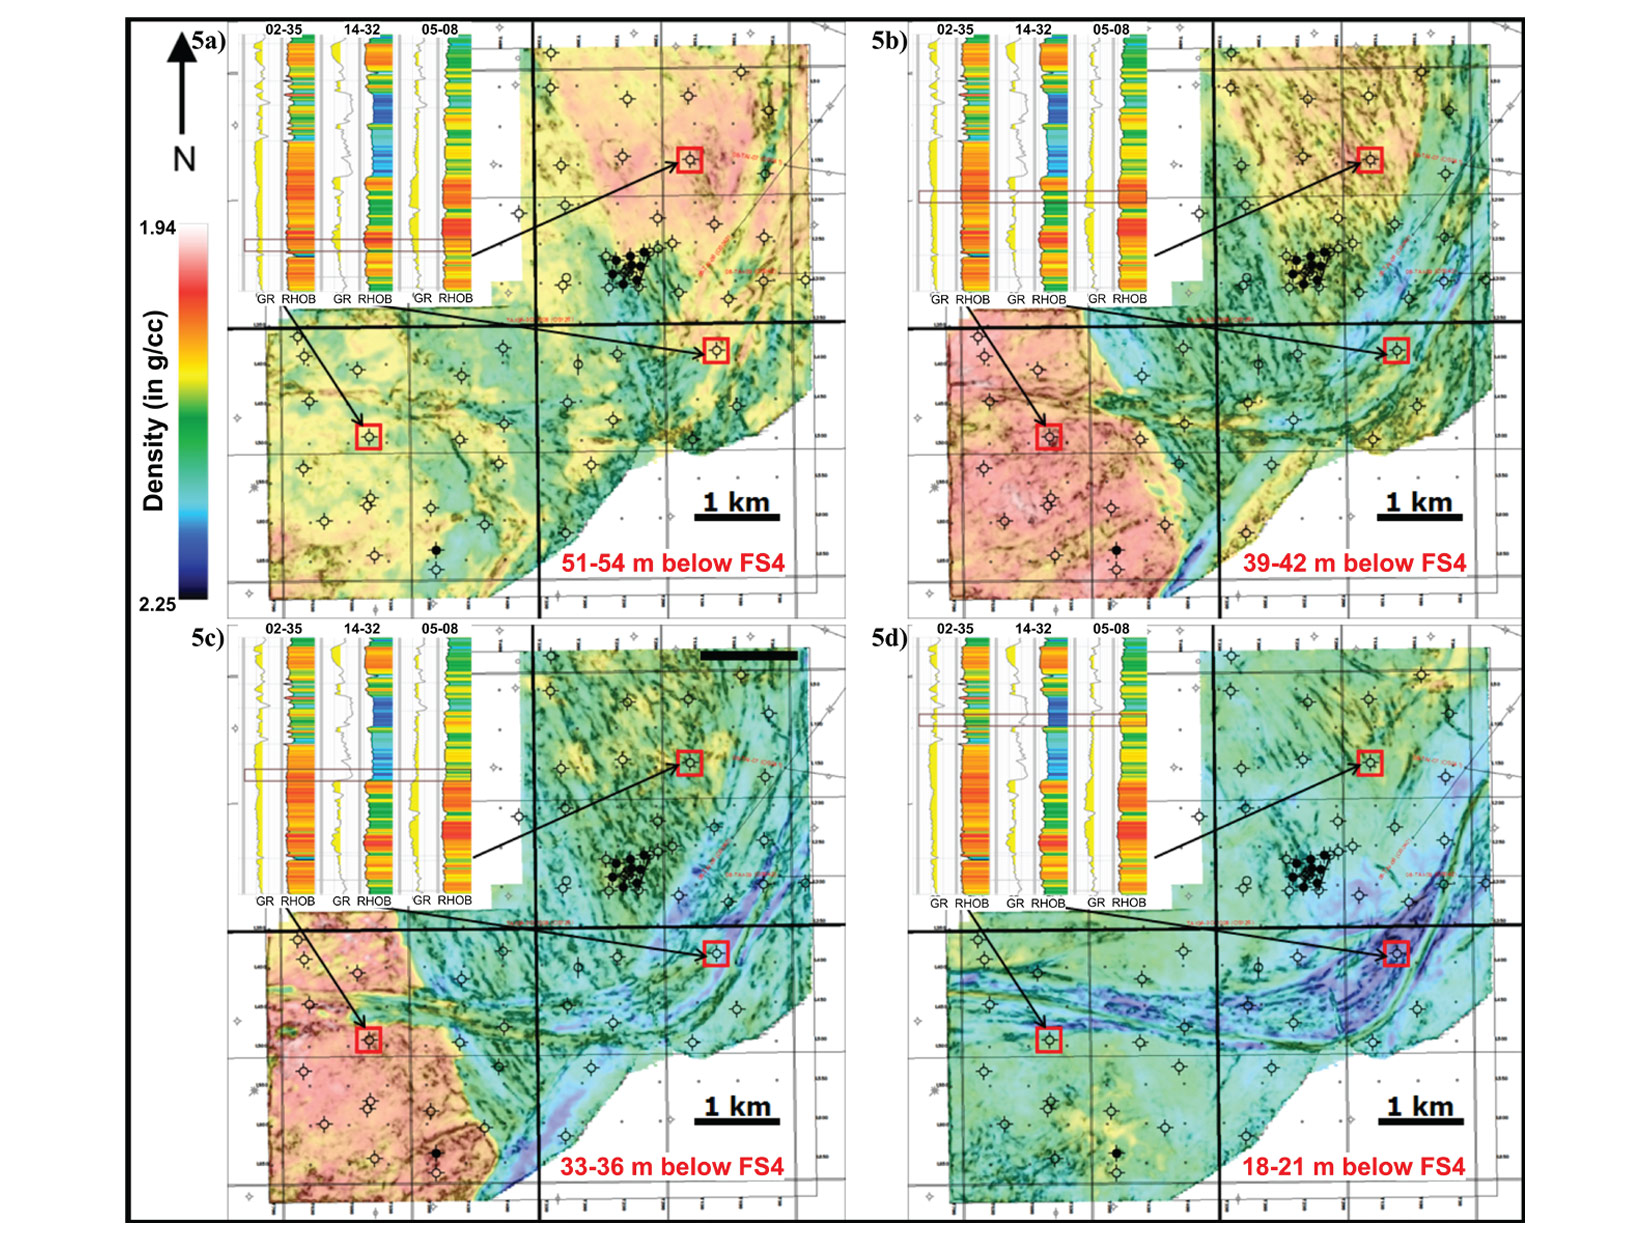
Prestack Inversion – Density Volume
The inversion method used over the Taiga 3D was a model-based, pre-stack simultaneous inversion (Hampson and Russell, 1990). Six seismic horizons and four of the six wells with dipole sonic logs were used to create an initial smooth impedance model. This both constrained the acceptable absolute impedance range and supplied a low frequency trend from the well-log data that was absent in the seismic data. The inversion process produced P-impedance, S-impedance and density volumes. The density volume proved to be the most useful result, allowing for accurate differentiation of the low-density LGR sandstones from high-density mudstones (Figure 5).
Geology-Geophysics Integration
3D modelling software was used to integrate the products of investigation of the well data and seismic volumes. Flooding surfaces were numbered from the bottom up, starting with flooding surface zero (FS0) and ending with flooding surface four (FS4). This mapping process was iterative. Important surfaces from core description were compared against geophysical responses to assess the degree of imaging. Conversely, features from the seismic volumes were compared to the available well data (Figure 5). Mapping of surfaces was facilitated by a grid of cross sections including all 65 wells with logs.
Observations and Interpretation
Depositional Interpretation
Shoreface Reservoir
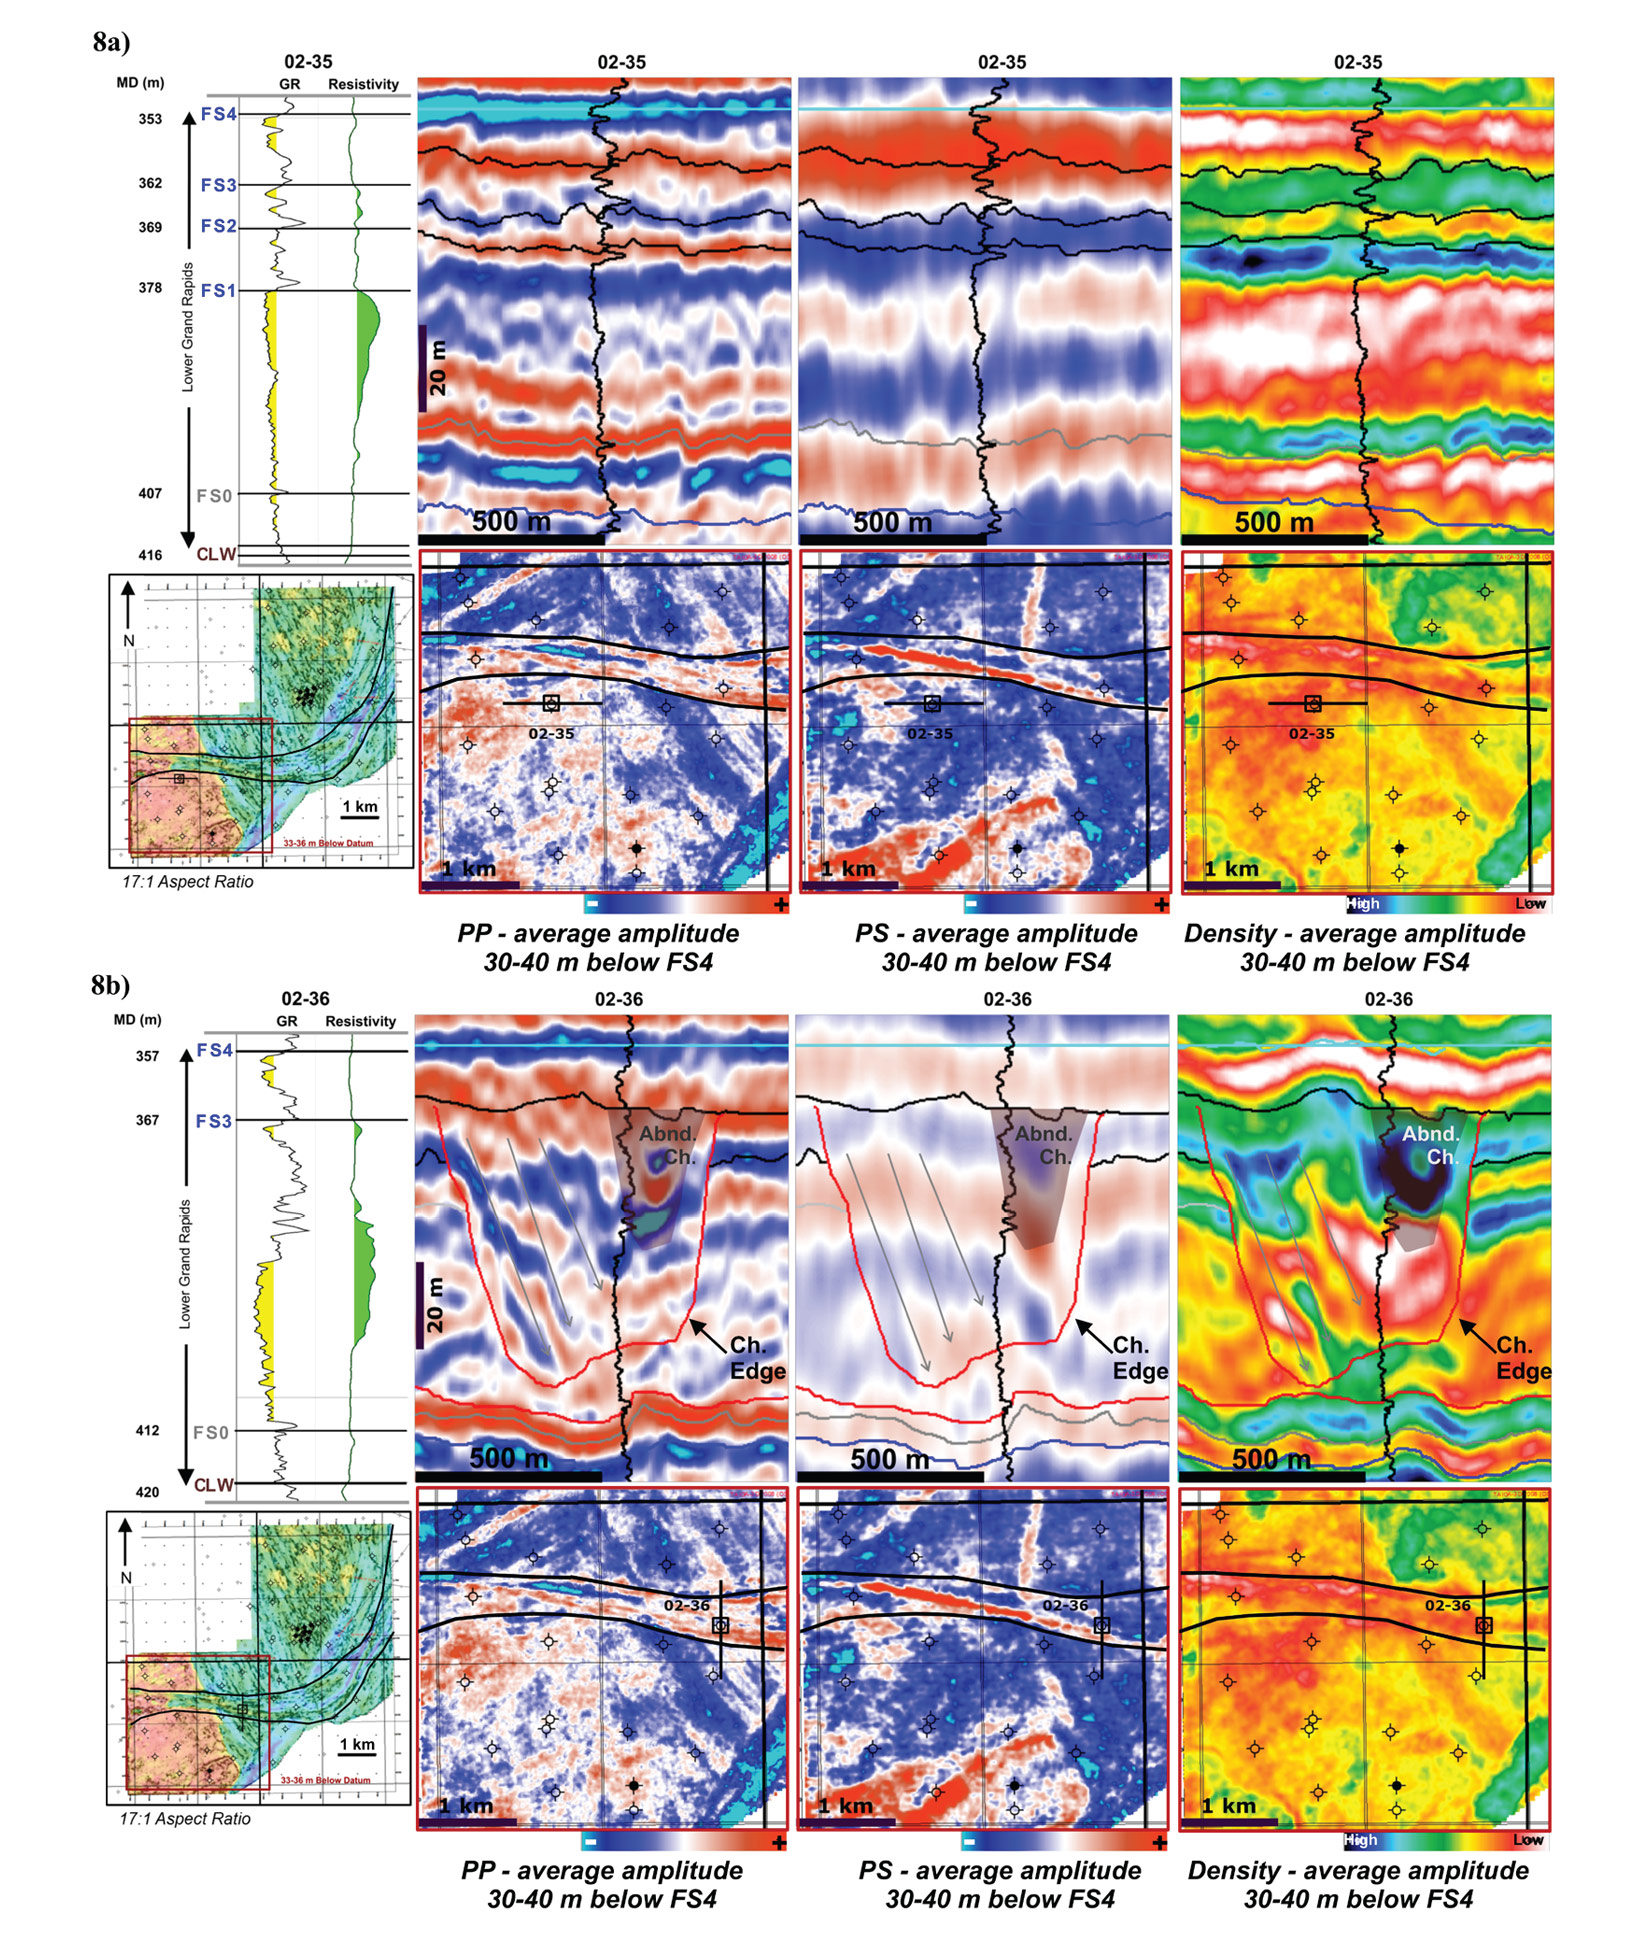
Figure 6 shows the type log for this facies 1AA/02-35-065-02W4 (02-35) with a geophysical well log suite, Vshale, and selective intervals of the core description log with core photos. The grain size coarsens upward from upper-fine to upper-medium grained. There are no mud interbeds, but centimeter-scale carbonaceous laminations are common. Horizontal and low-angle-parallel laminations are the dominant sedimentary structures (Figure 6b). The sandstone-rich interval is capped by medium-grained sandstone with rootlets and authigenic kaolinite (Figure 6a). It is overlain by a coal up to 55 cm thick which can be mapped in multiple wells where not removed (Figure 10). Seismic reflectors are continuous and parallel and the density volume shows a homogeneous, low-density package (Figure 8a).
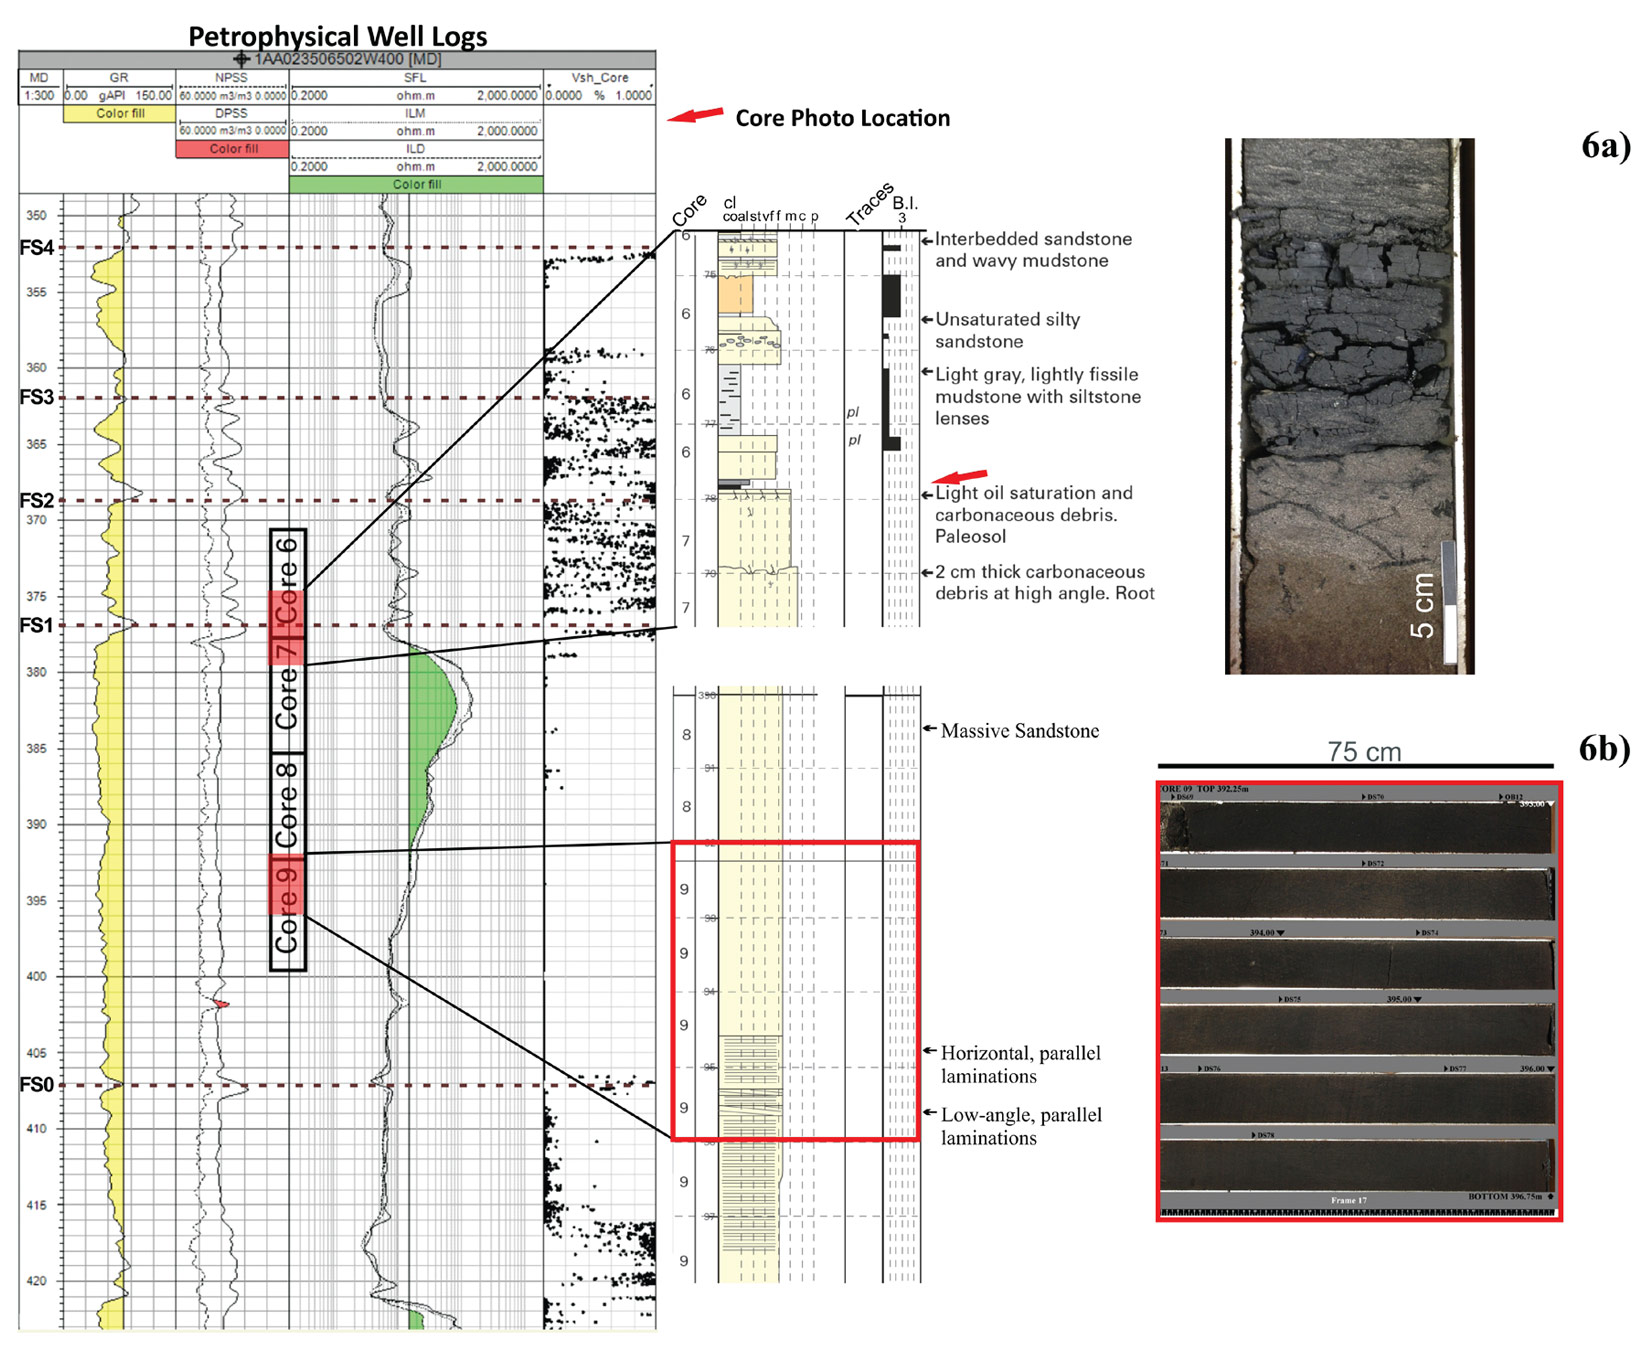
The high sandstone content, the homogeneity of the sandstone seen in wells and seismic, the sedimentary structures and the capping by a paleosol and coal is used to interpret this core as being deposited in a wave-dominated shoreface setting.
Fluvial Reservoir
Figure 7 shows the type log for this facies 1AA/02-36-065-02W4 (02-36) with a geophysical well log suite, Vshale profile and selective intervals of the core description with core photos. The grain-size fines-upward with medium sandstone at the base transitioning to mudstone interbedded with fine-grained sandstone, and mudstone at the top. Cross-bedding is common (Figure 7b). Mudstone breccia beds are present in minor amounts (Figure 7a). An adjacent well, 1AA/05-35-065-02W4 (05-35), has a 2.35 m thick mudstone clast bed 7.25 m above an abrupt coarsening of grain-size. Sub-angular mudstone clasts range from 0.5 cm to greater than the diameter of the core (ca. 10 cm). The PP and density volumes show shingled downlapping seismic reflectors and a high density anomaly at the top (Figure 8b); time slices show a channel geometry where these wells were drilled (Figure 5).
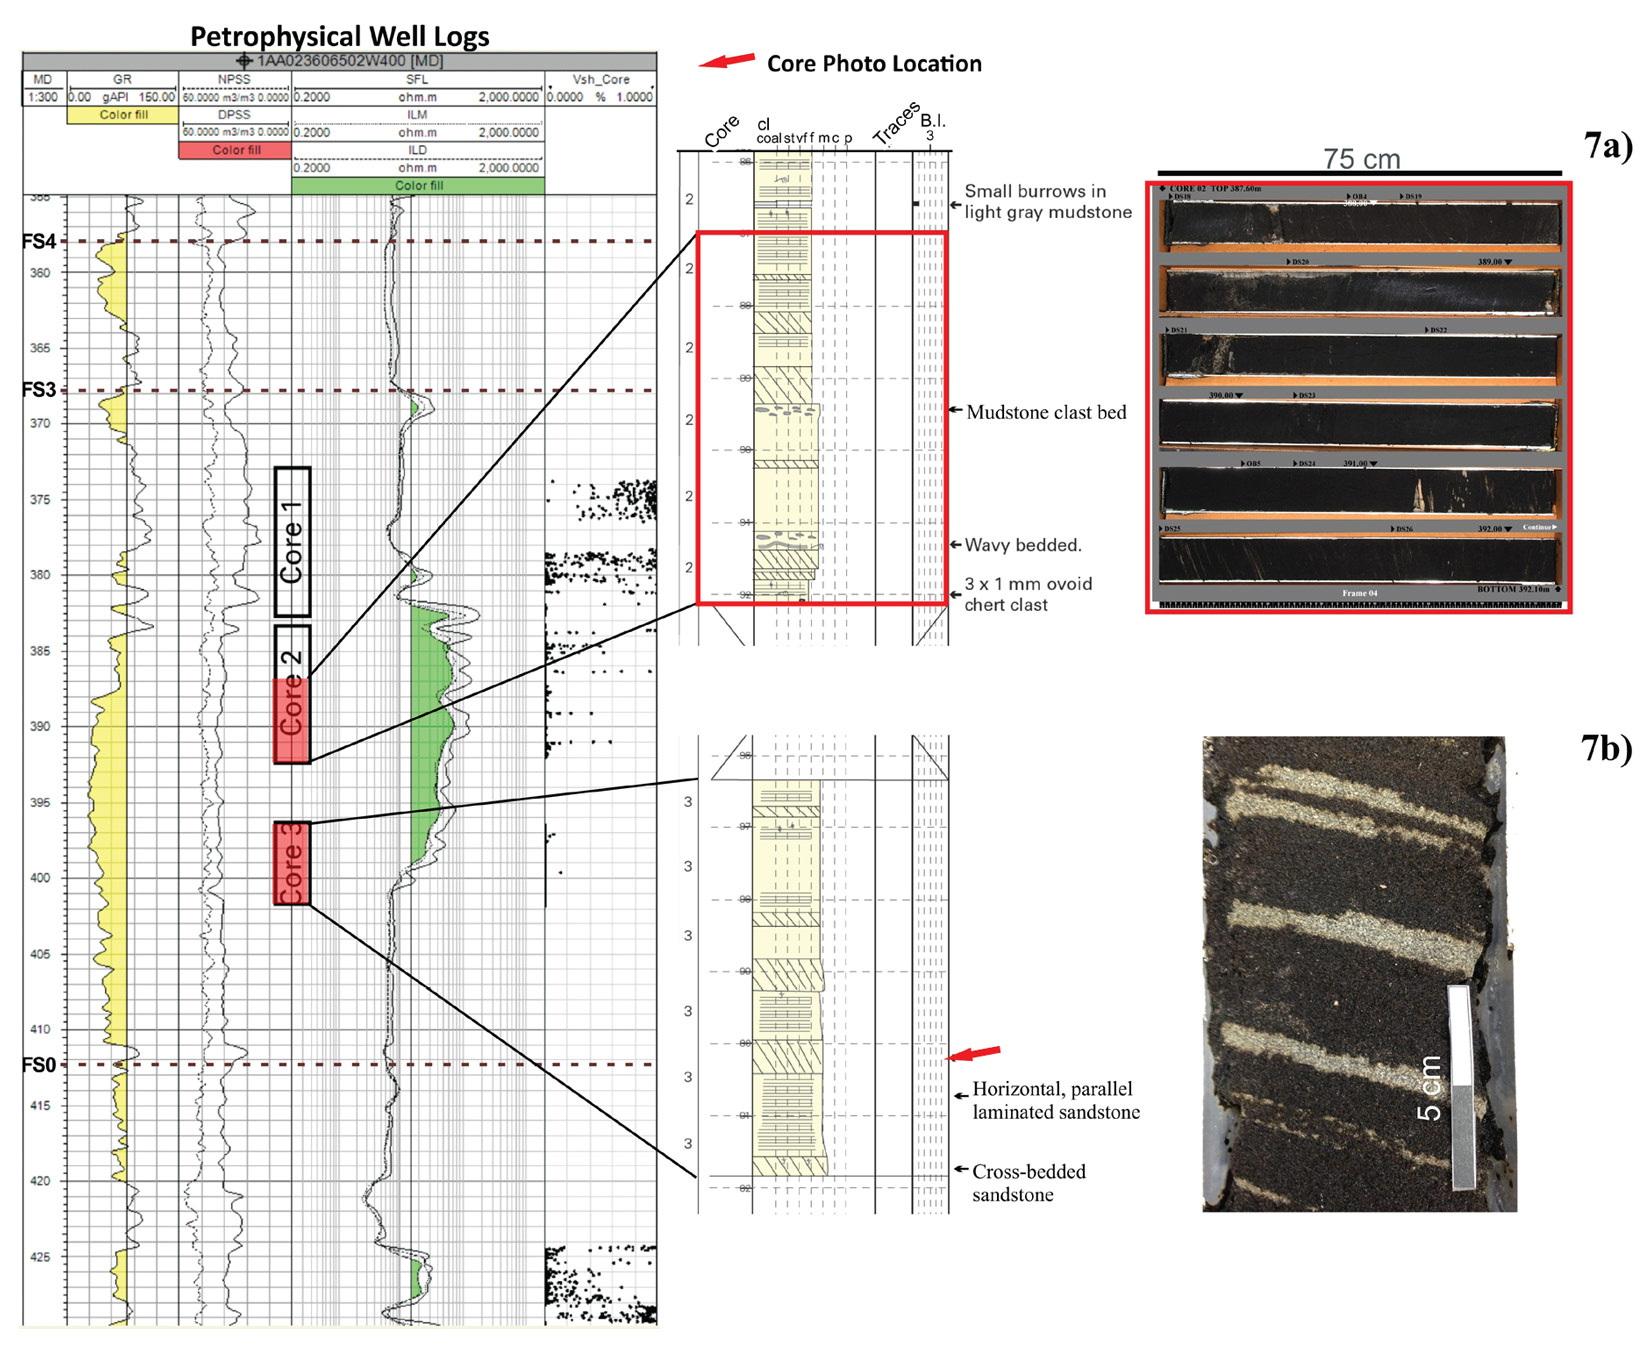
The interpreted processes are high energy currents, bank collapse, variations in flow regime leading to heterolithic sedimentation, suspension settling of mud, and a hybrid of lateral and vertical accretion. These processes are consistent with the interpretation of a fluvial channel-fill with mudstone-filled abandonment.
Complex Valley Fill – non-reservoir
Figure 9 shows logs from two seismically-resolvable architectural elements in wells 1AA/04-05-066-01W4 and 1AA/01-08-066-01W4. The gamma ray profile for 1AA/04-05-066-01W4 shows two major fining upwards packages present. The lower package in this well is lower density on the seismic and cleaner on the gamma than the upper package.
The type log for the upper package is well 1AA/01-08-066-01W4 which shows a serrated gamma ray profile (Figure 9b). The upper package is thicker, and the lower package is thinner in this well than in 1AA/04-05-066-01W4. The upper package has a serrated gamma ray profile and prominent high-density layers.
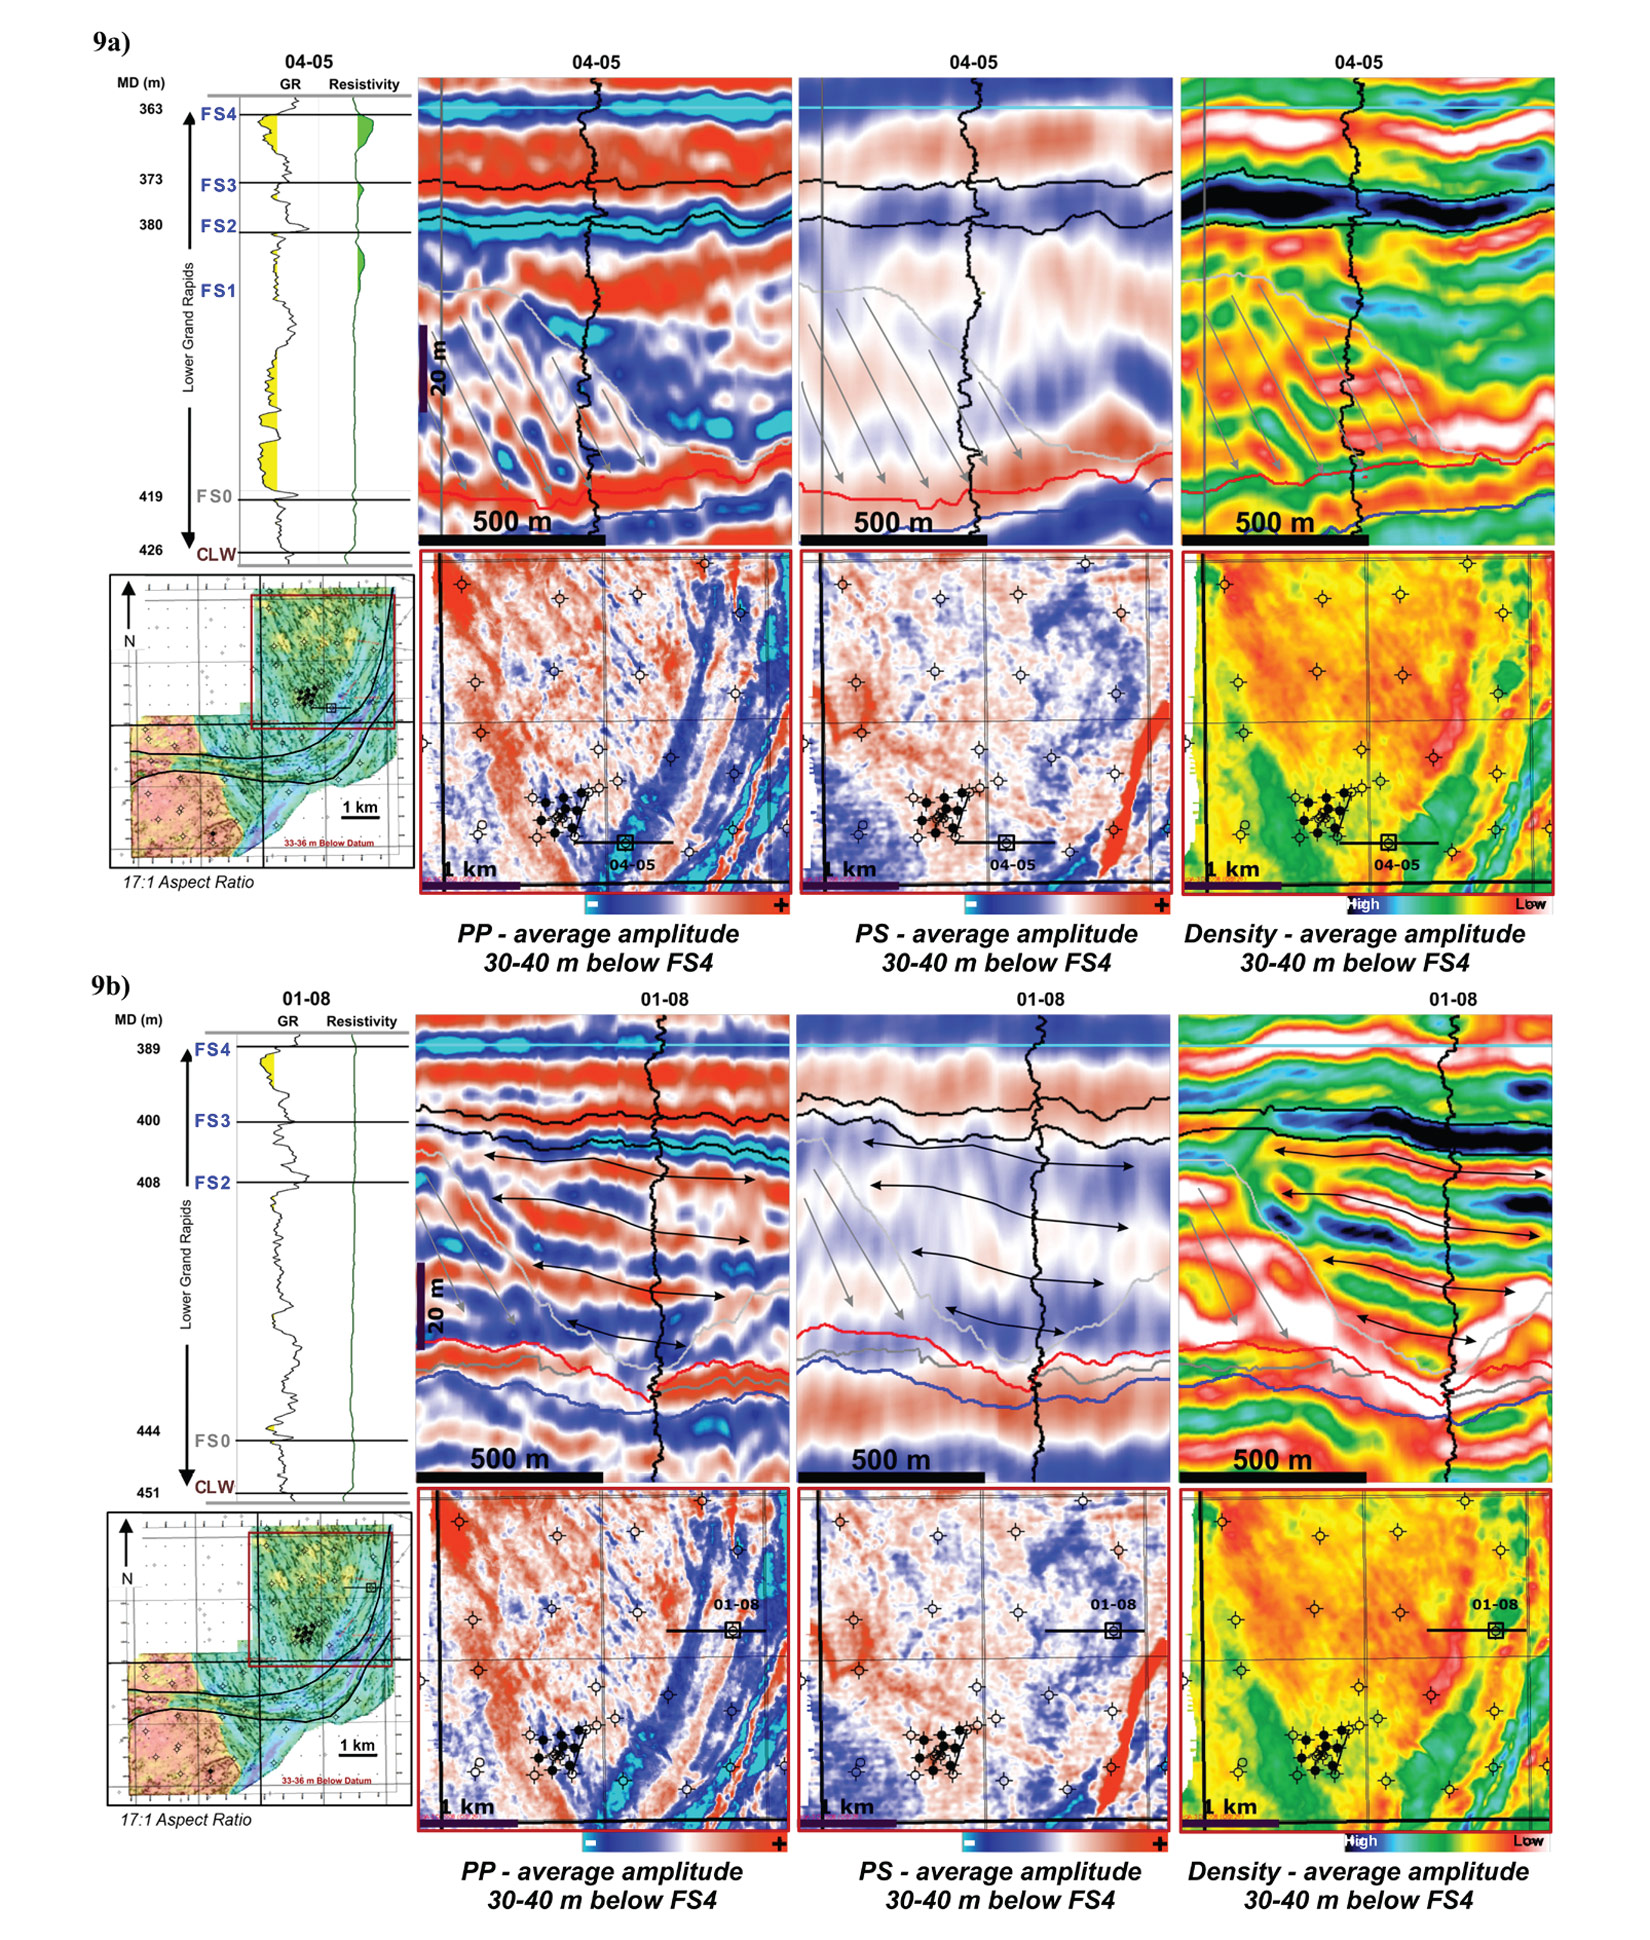
In the lower package, seismic reflectors are inclined and shingled; whereas, the upper package is characterized by parallel reflectors. The resistivity of the sandstone in both packages is low (Figure 9).
The lower package is interpreted as a laterally accreting, sandstone bar. The upper package is interpreted as vertically accreting heterolithic architectural element, a bar or channel fill. Both are water saturated.
Stratigraphic Interpretation
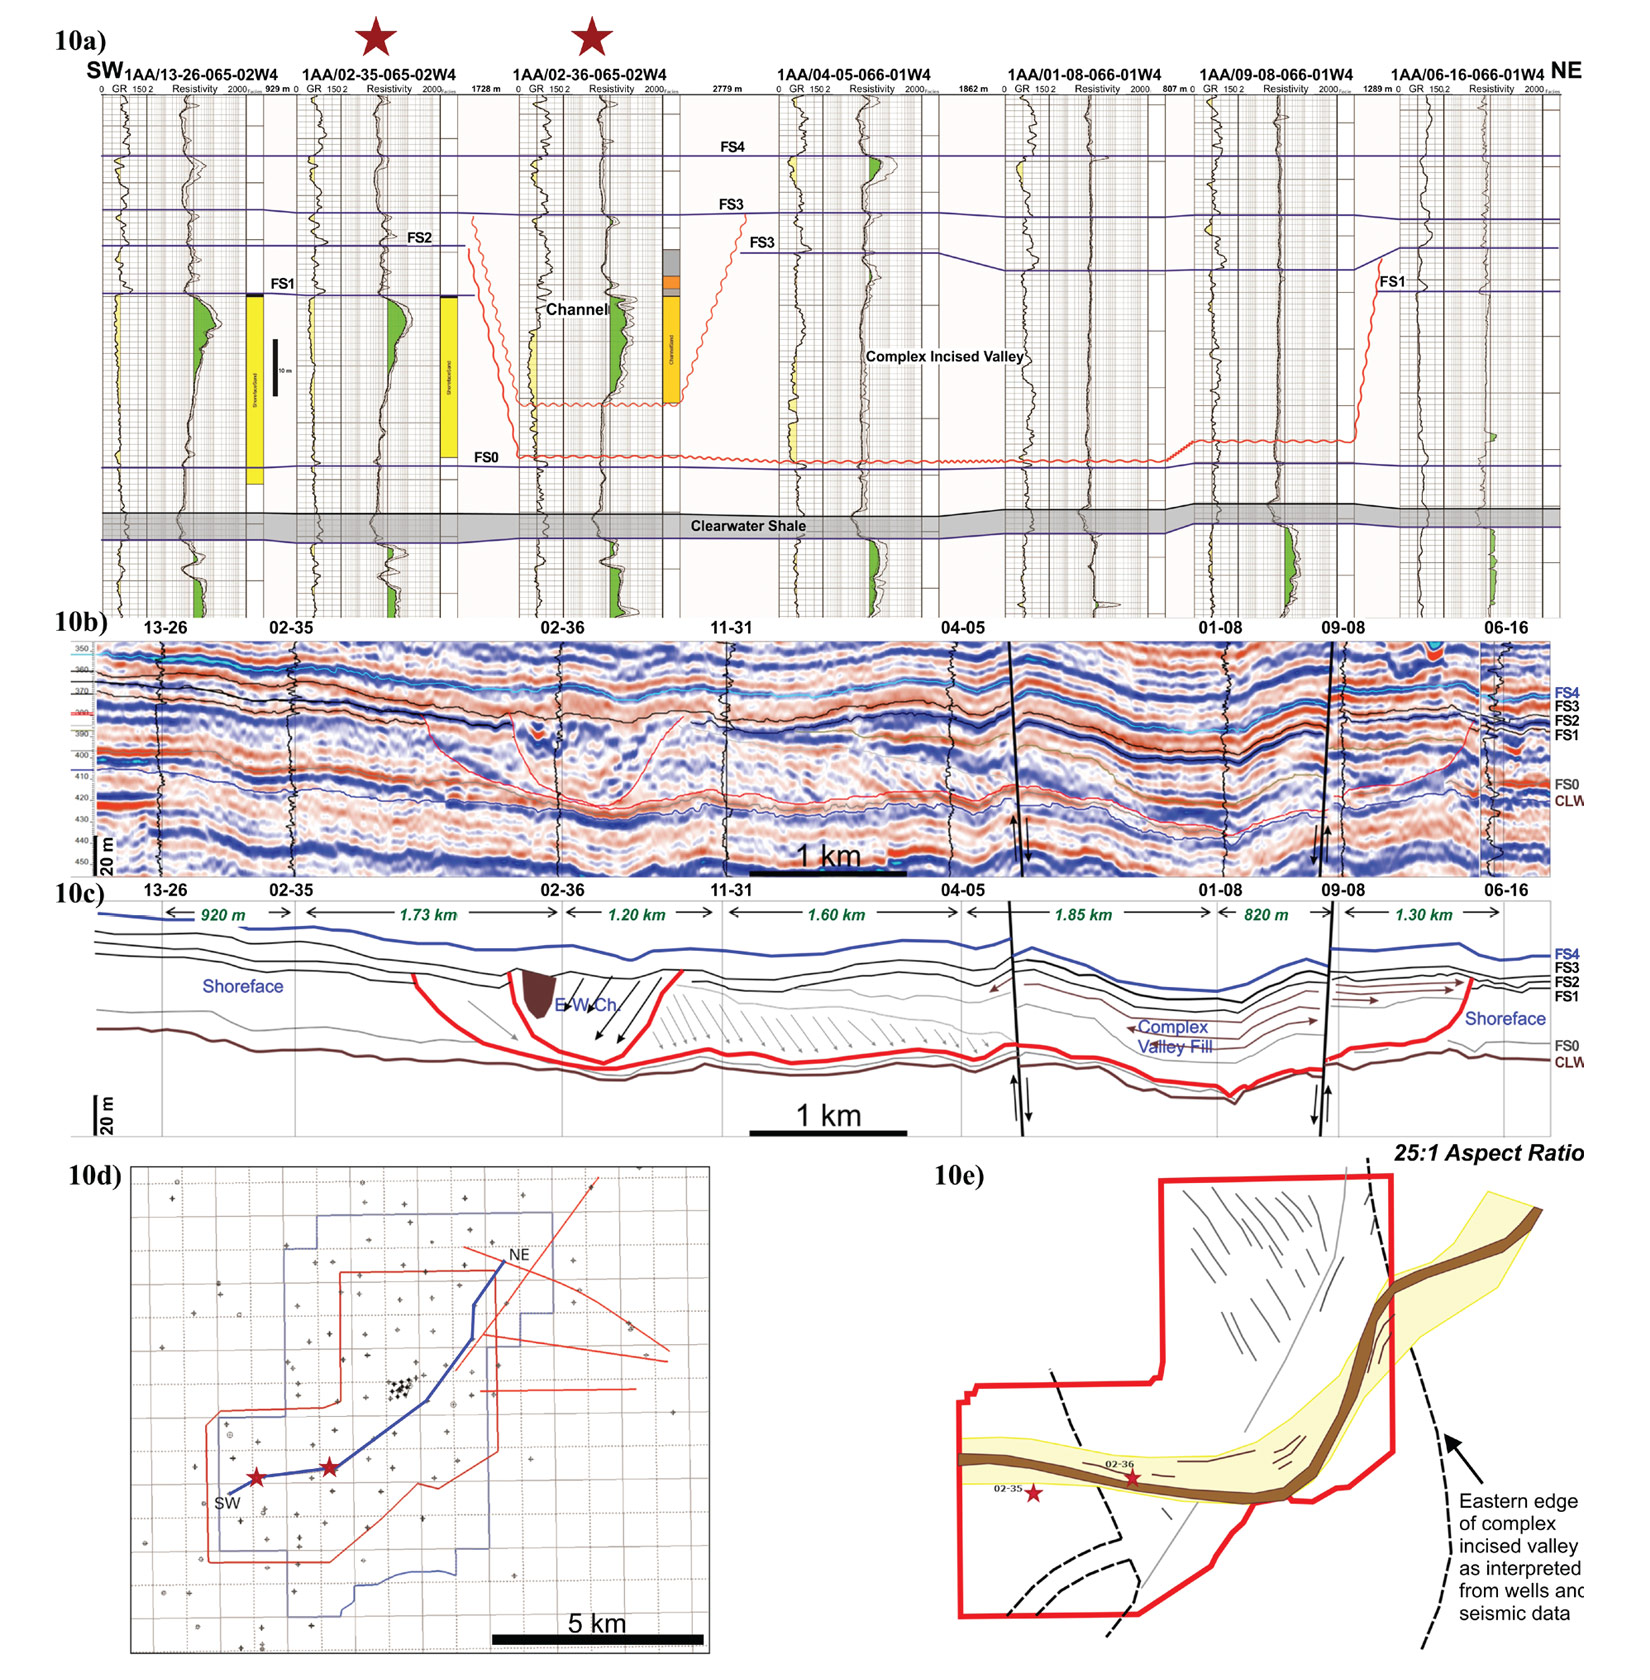
Examination of the presence of flooding surfaces leads to the following interpretation of the timing of events summarized in Figure 10. The lowermost flooding surface is FS0, which is present in almost every well except where it has been incised by later events. Where FS1 is present, wells display the full shoreface succession including the paleosol and coal. This situation is present in the southwest and northeast of the study area. The complex incised valley originates from FS2 and is 6 km wide in the study area. This valley fill shows evidence of multiple events reflected in the different accretion styles described above (i.e. lateral and vertical). The final incision originates from FS3. This appears to be a single channel fill with fluvial reservoir at its base and deteriorating reservoir quality higher in the fill. Examination of deposits at stratigraphically equivalent levels above both the shoreface and fluvial reservoirs augments the interpretation that the channel fill is later. Specifically, highly bioturbated very fine-grained sandstone, siltstone and mudstone deposits overlie the shoreface; whereas, stratified medium-gray mudstone with fine-sandstone lenses and thin mudstone interbeds overlie the channel succession. It is interpreted that this facies juxtaposition was the result of erosion of the bioturbated sediments and replacement by more terrestrial unbioturbated sediments. The uppermost flooding surface mapped throughout the study area, FS4, marks transgression at the top of the LGR (Figure 10).
Shoreface Reservoir
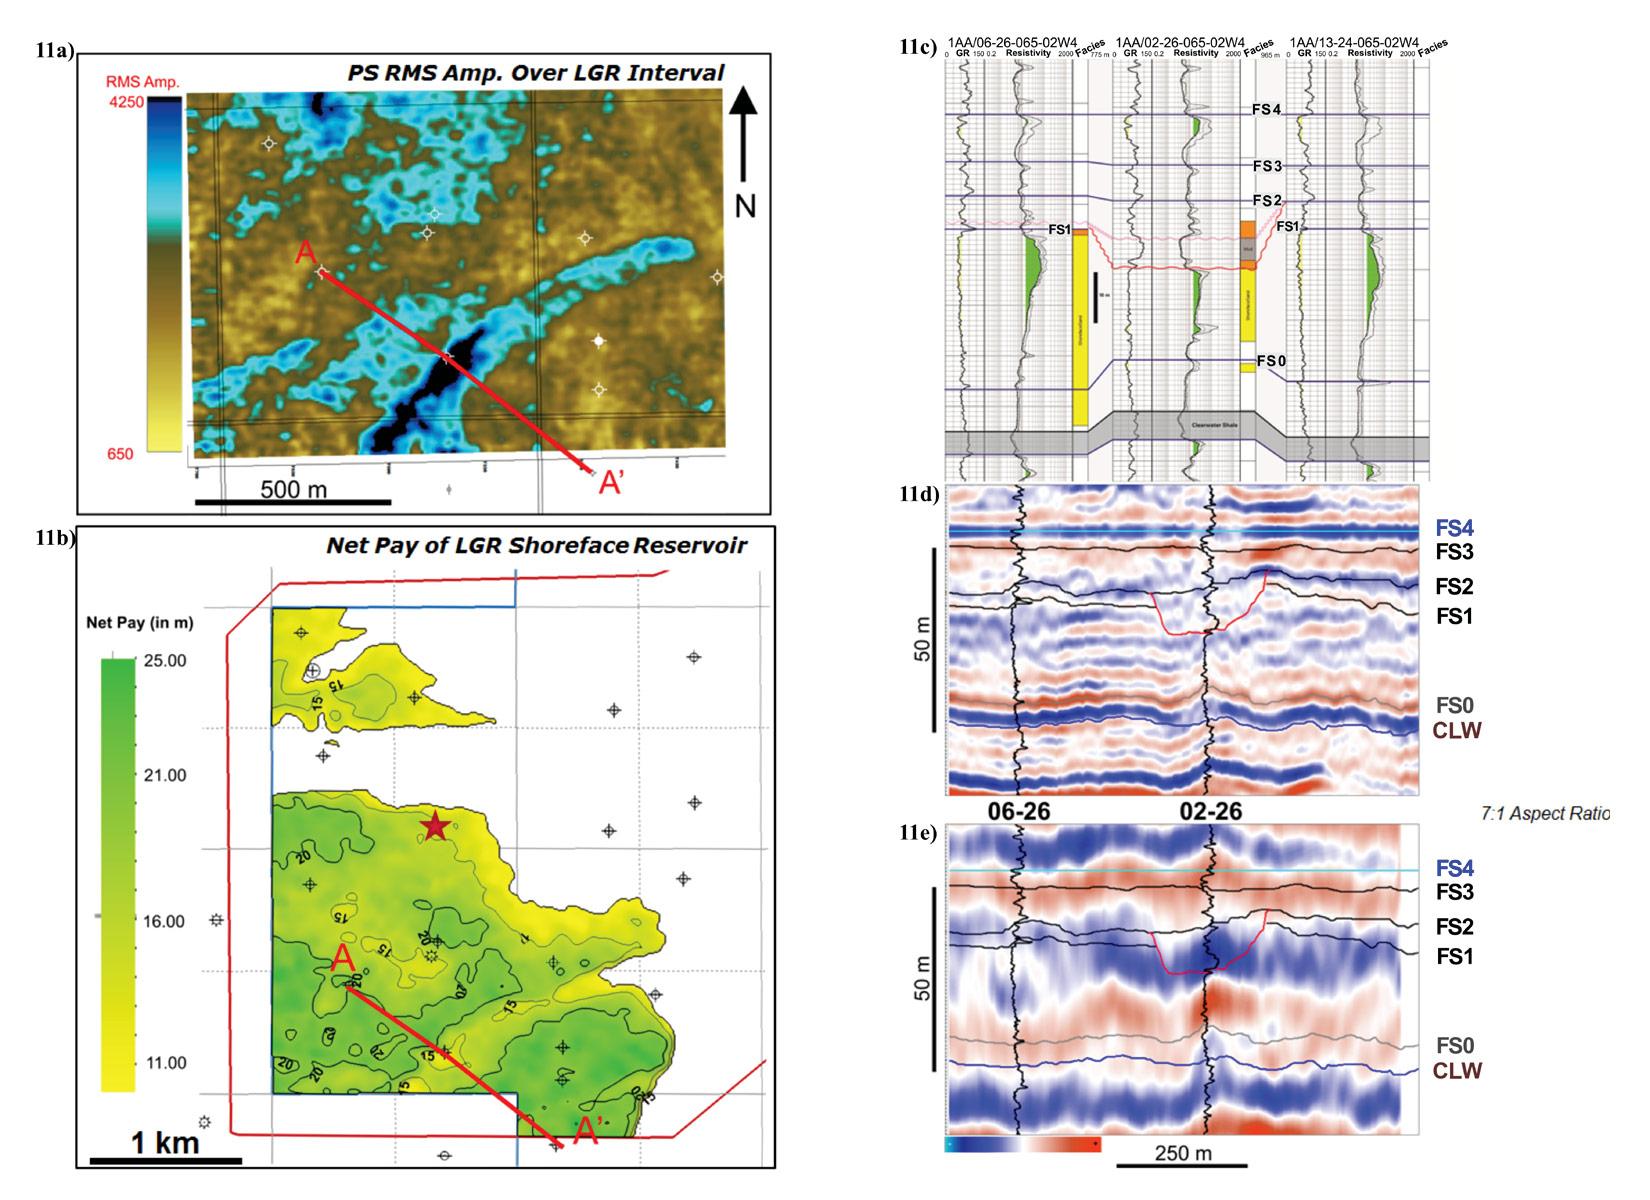
The density mapping of the shoreface sands in the southwest show internally homogeneous ‘blanket sands’ where the shoreface is preserved (Figure 5c); however, there are places where the shoreface has been partially removed and replaced by later events (Figure 11). The later channel fills have a more chaotic, variable seismic signature (Figure 12). The channel seen at the top of the reservoir as shown in the 1AA/02-26-065-02W4 well originates from the same flooding surface as the complex incised valley and has a channel geometry (Figure 11). It is interpreted as a tributary fill associated with this valley fill. Despite this small heterogeneity, the homogeneous nature of this shoreface sandstone and its areal extent make this shoreface unit the primary target at Taiga.
Fluvial Reservoir
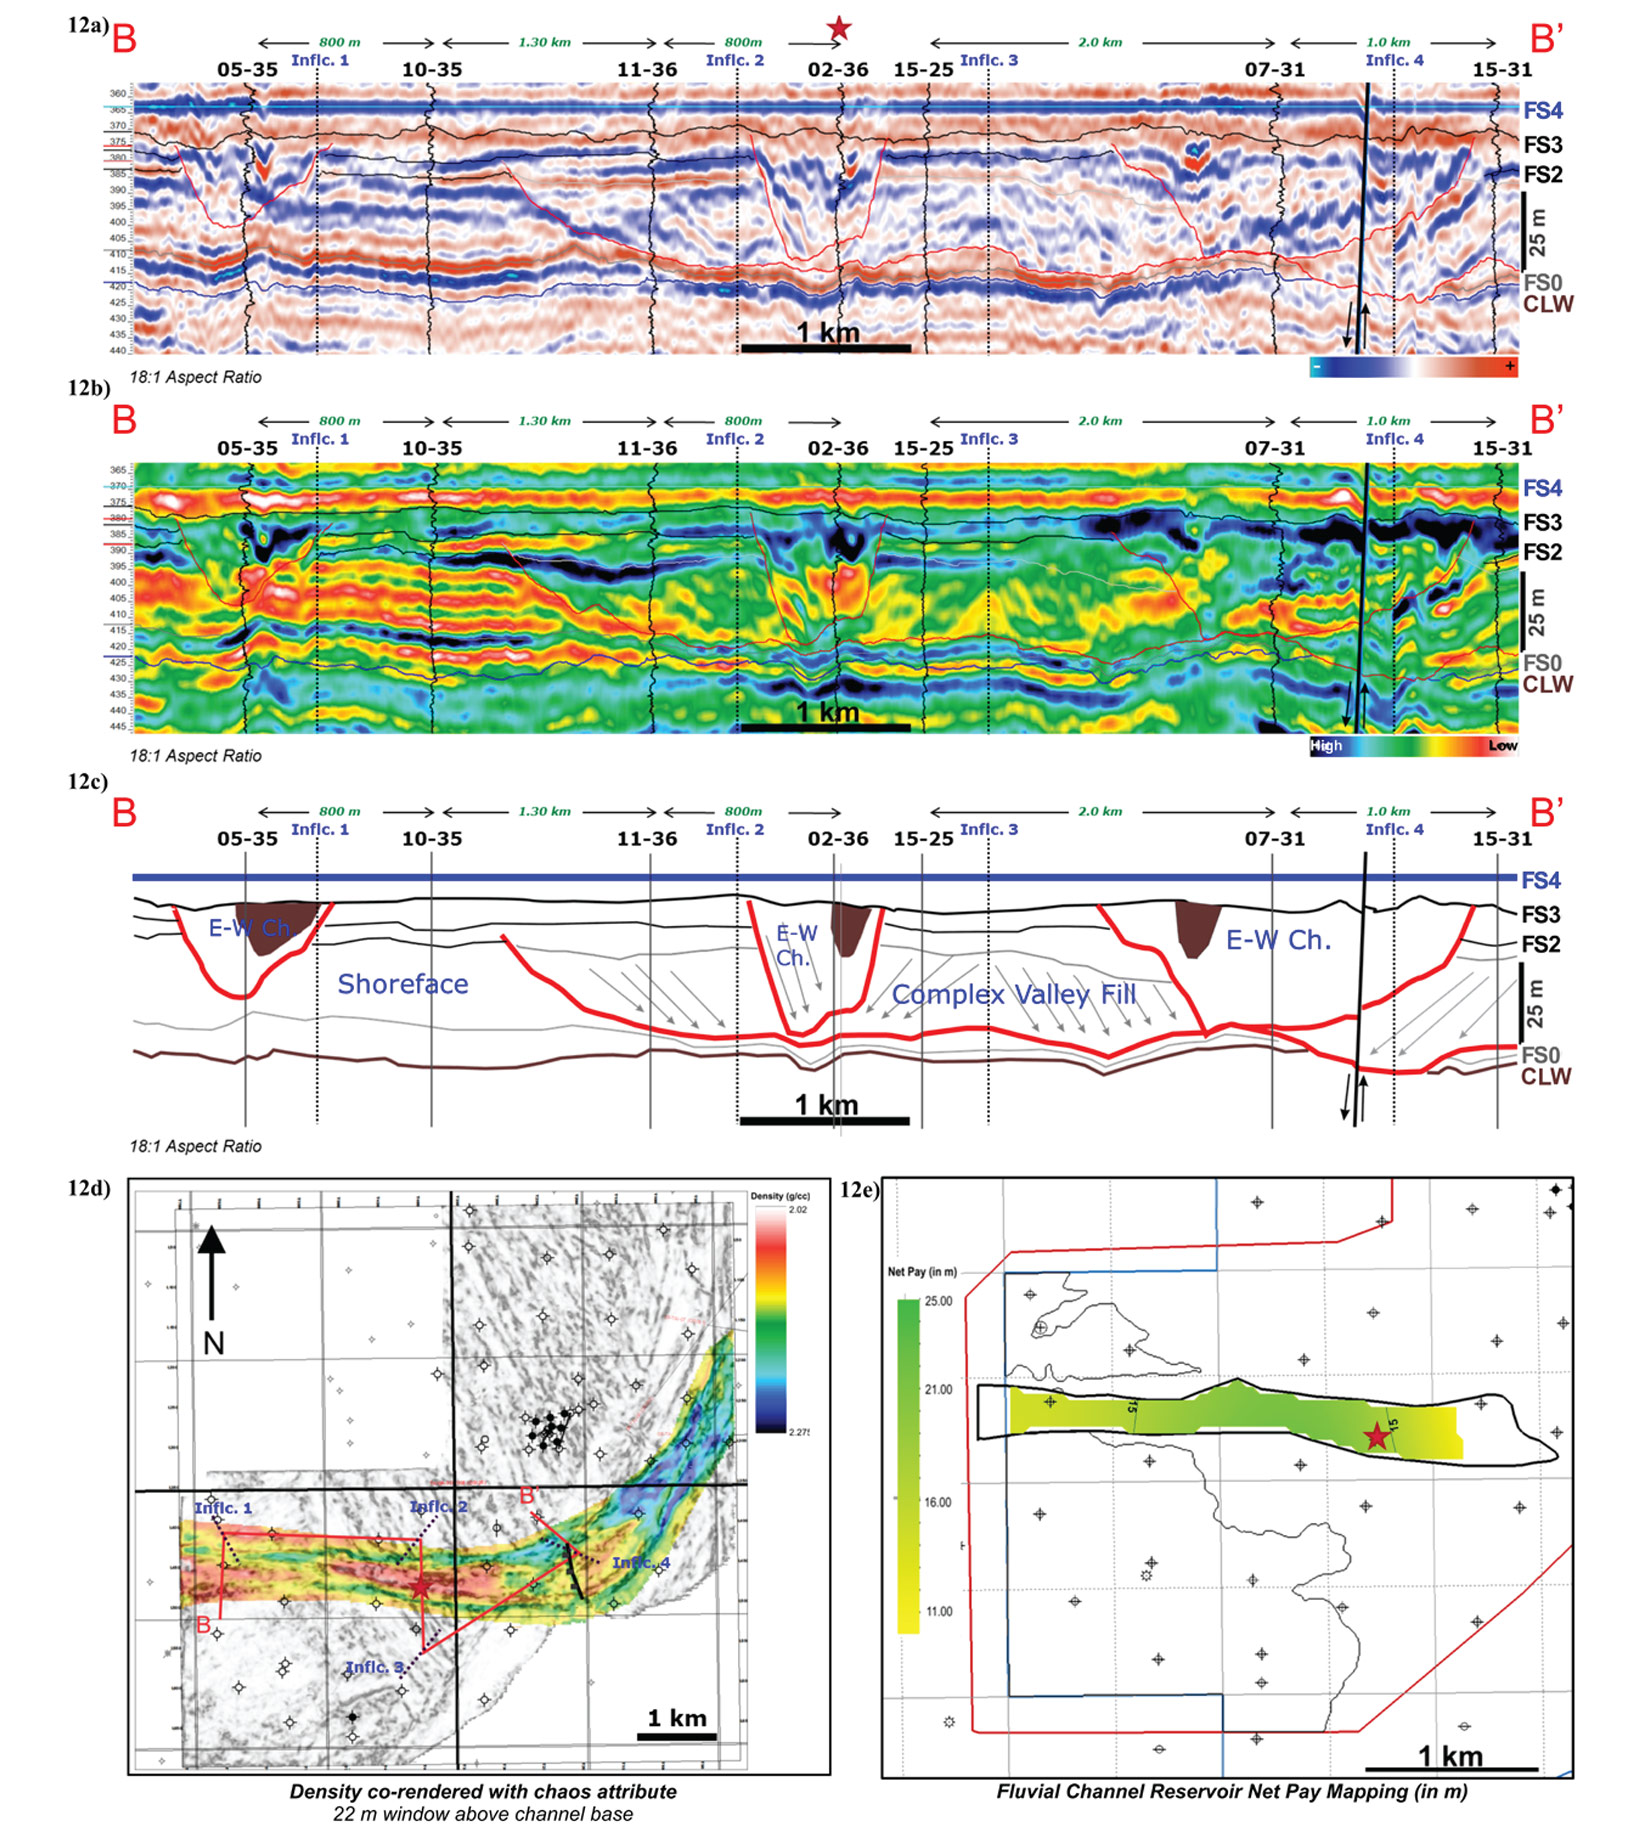
The density mapping in the west of the study area shows an elongate lens of homogeneous low density sandstone interpreted as the fluvial reservoir (Figure 12). The areal trace of this lens includes both the 02-26 and 05-35 wells which both show interpreted fluvial features in core. This trace is approximately 600 m wide. The lenses may be connected beneath the mudstone that is interpreted as the abandonment phase of deposition.
Discussion
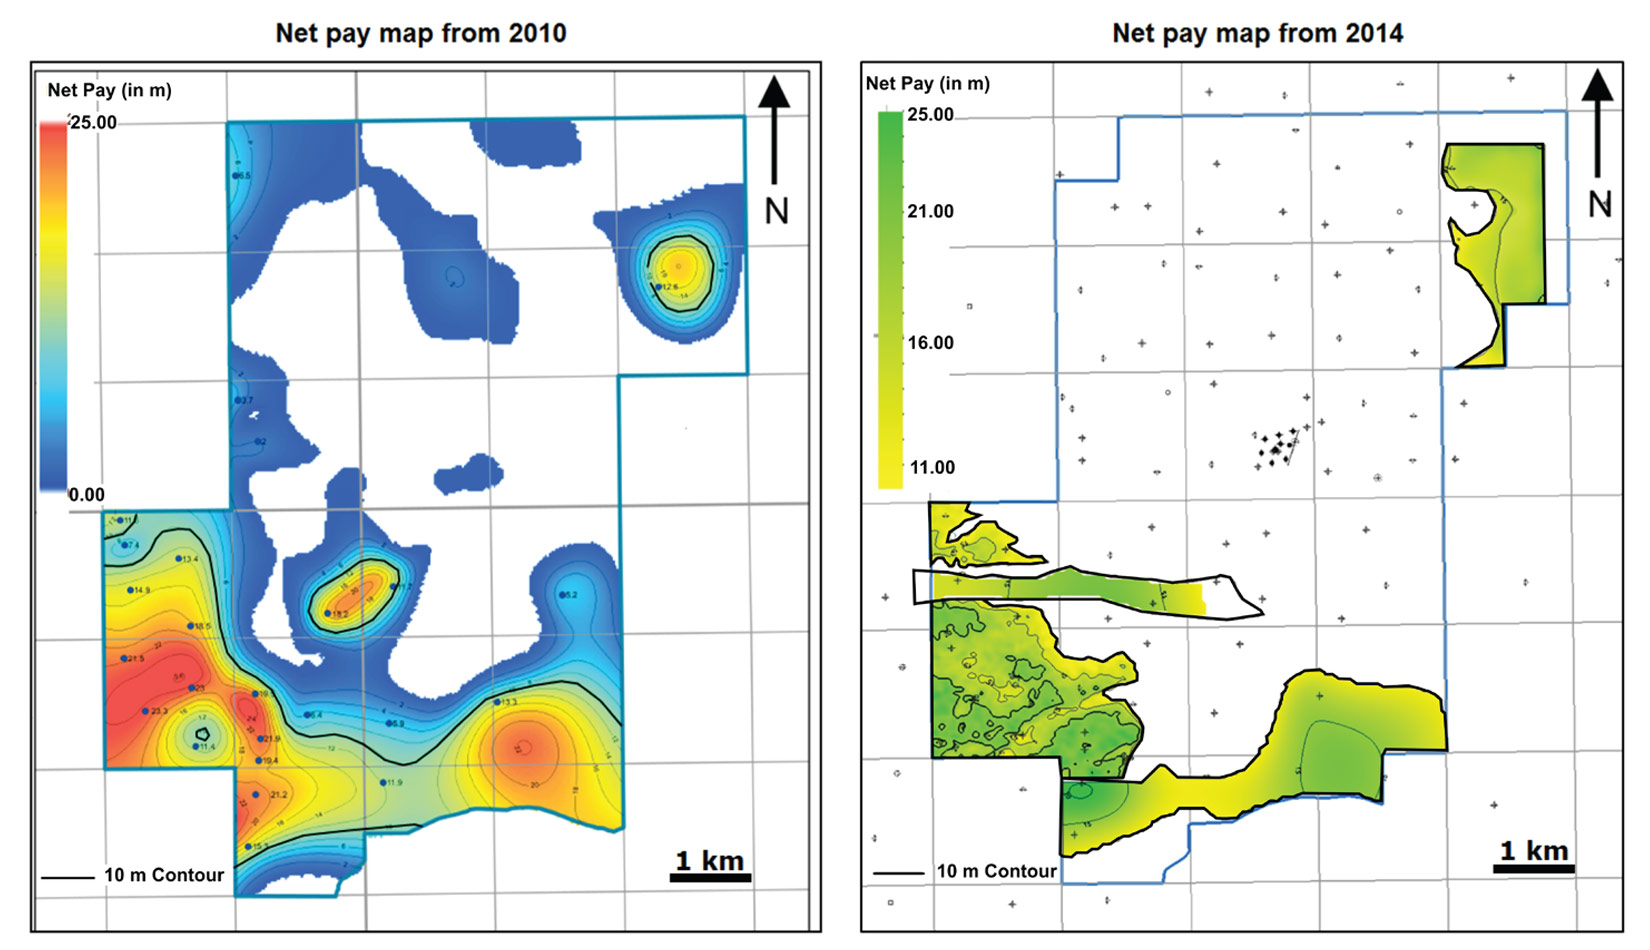
This study has resulted in increasing the overall mapped net pay estimate compared with the initial mapping from 2010. The earlier mapped net pay estimates incorporated log and core analysis with the PP seismic data. In contrast, this study integrated core and well log analysis with PP and PS seismic volumes and the seismic density inversion. The revised mapping varies from previous interpretation in three areas.
First, the 2010 mapping contained an unconstrained thinner net pay data point at the 1AA/02-26-065-02W4 location. This single well point can be constrained with a reasonable geometry based on the interpretation of a small tributary to the incised valley (Figure 13). Without the interpretation of the PS volume the geometry of this feature would have remained unresolved (Figure 11).
Second, the new interpretation adds 1AA/05-35-065-02W4 to the fluvial reservoir and allows for the expansion of the western extent of this unit, correcting another unconstrained well point from the 2010 mapping (Figure 13). Figure 12 illustrates the most recent net pay map for the fluvial channel reservoir showing any vertically continuous pay greater than 10 m. The confidence level of this mapping is less than that of the shoreface as there are only three wells for control. This interpretation depends heavily on the geometries from the density and chaos volumes. Acquiring and interpreting the seismic data prior to drilling delineation wells may have led to more wells in this unit to better understand the internal heterogeneity. There is still uncertainty about whether, and at what depth, the shoreface and channel sandstones are horizontally juxtaposed; the pay-map in Figure 13 shows a gap between the two units, whereas Figure 8b appears to show the units juxtaposed arguing for further revision of the mapping.
Third, the remnant shoreface outside of the complex incised valley in the northeast was revised to reflect a new interpretation of the valley edge. This was done through increased scrutiny of the 2D data augmented by flooding surface mapping (Figure 10).
The complex incised valley in the study area is mostly non-reservoir but this is not for lack of sandstone. The laterally accreting lower package in the northern part of the 3D volume has nearly two sections of sandstone as imaged by the density volume (Figure 5). It is structurally low and water wet. Similar sandstones are a viable exploration concept in other areas, in addition to shoreface and more areally confined channel sandstone that are the reservoir units at the Taiga Project.
Conclusions
This study highlights the complexity of the stratigraphic architecture of the LGR. It shows how valuable the integration of core, well-log data and multiple high resolution seismic volumes can be in identifying and mapping reservoir quality, geometry and continuity. The systematic organization of strata complicated by differing depositional styles and post-depositional modification (i.e. erosion) can be deciphered through the approach provided here. Portraying the non-random distribution of reservoir beds and enclosing strata leads to more efficient development of thermal reservoirs. This study provided characterization for both shoreface and fluvial reservoirs at Taiga. The deeper understanding of the lease presented here will be used to optimize pad locations, horizontal well placement and well performance throughout the life cycle of the Taiga Project.

Acknowledgements
The authors wish to thank their colleagues who contributed to this project. Jen Russel-Houston, Shawna Christensen, Rob McGrory and John Carey did the initial interpretation of the core, well log and seismic data for the Taiga project which was presented at the 2010 AAPG International Conference and Exhibition. This material was presented at the 2014 GeoConvention as a joint oral and core presentation by the authors. Regional studies of the LGR that form the framework for this analysis was presented at the 2014 GeoConvention Core Conference by Brad Hayes and Garrett Quinn. Thank you to our Osum colleagues Andrew Tomlinson, Peter Putnam, Alex MacNeil and Ken Gray for their contributions to this paper. Sensor Geophysical conducted the AVO-compliant processing for the conventional compressional wave data and processed the converted wave data. We are grateful to the Management of Osum Oil Sands Corp. for permission to show this work.


Join the Conversation
Interested in starting, or contributing to a conversation about an article or issue of the RECORDER? Join our CSEG LinkedIn Group.
Share This Article