Introduction
Newly emerging plays with high reserves replacement potential include the deep-water sediments of ocean margins worldwide, sub-salt reserves and high-pressure high-temperature environments, all of which are subject to significant overpressure, that is pore pressures above “normal” or hydrostatic. In each of these environments the pore pressures can reach values as high as the fracture gradient, leading to extreme drilling challenges as well as the possibility of hydrocarbon leakage. Pore pressure prediction is therefore an integral process in the well planning procedure as well as the geological evaluation of a potential trap. Predictions are based mainly on a combination of remote data, such as seismic and basin modelling, and/or by analysis of nearby (offset) wells. Little may be known of the mechanisms which generated the overpressure conditions, and data quality is likely to be variable. Additionally there may be only few direct measurements of pore fluid pressures (for example, wireline pressure tests such as RFT/MDTs or production tests such as DSTs) to calibrate any prediction. Observations during drilling, however, coupled with interpretation of LWD/MWD data permit updating of the prediction in real time. This paper examines the methodology and assumptions involved in extracting pore pressure prediction from seismic and wireline data sources, and strives to comment on the challenges which exist in particular environments.
Basis for porosity-based techniques
Pore pressure prediction uses the Terzaghi stress relationship between total stress (vertical and horizontal compressive stresses due to gravitational loading and sideways “push”), effective stress (consider this as the combined effects of all the grain to grain contacts), and the pore pressure, in the simplified equation:
S = σ + Pp
where S is the total stress; σ is the effective stress and Pp is the pore pressure. The total vertical stress (Sv) is derived from the overburden, the combined weight of the sediments and contained fluids. The density log or a density-sonic transform is used, coupled with an estimate of average sediment density from the top of the logged interval to the seabed. Note that incorrect estimate of average sediment density in the shallow section is carried forward as a systematic error in a pore pressure prediction. The magnitude of the two horizontal stresses (SH, Sh) is less well constrained; Sh can be most readily estimated from borehole data, whilst the magnitude of SH is only rarely known. Many practitioners use vertical effective stress (difference between pore pressure and total vertical stress (also known as overburden or lithostatic pressure; Figure 1) as a proxy for mean effective stress. Hence, there is a tendency to use vertical effective stress in pore pressure prediction.
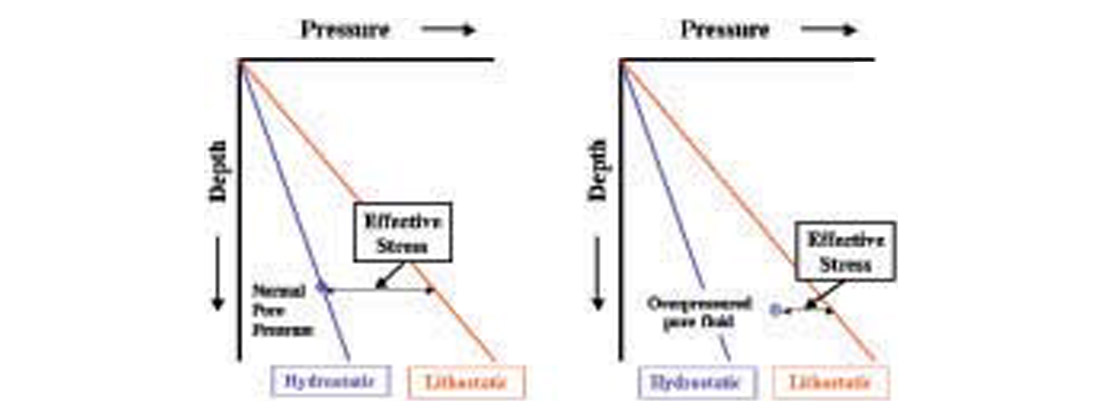
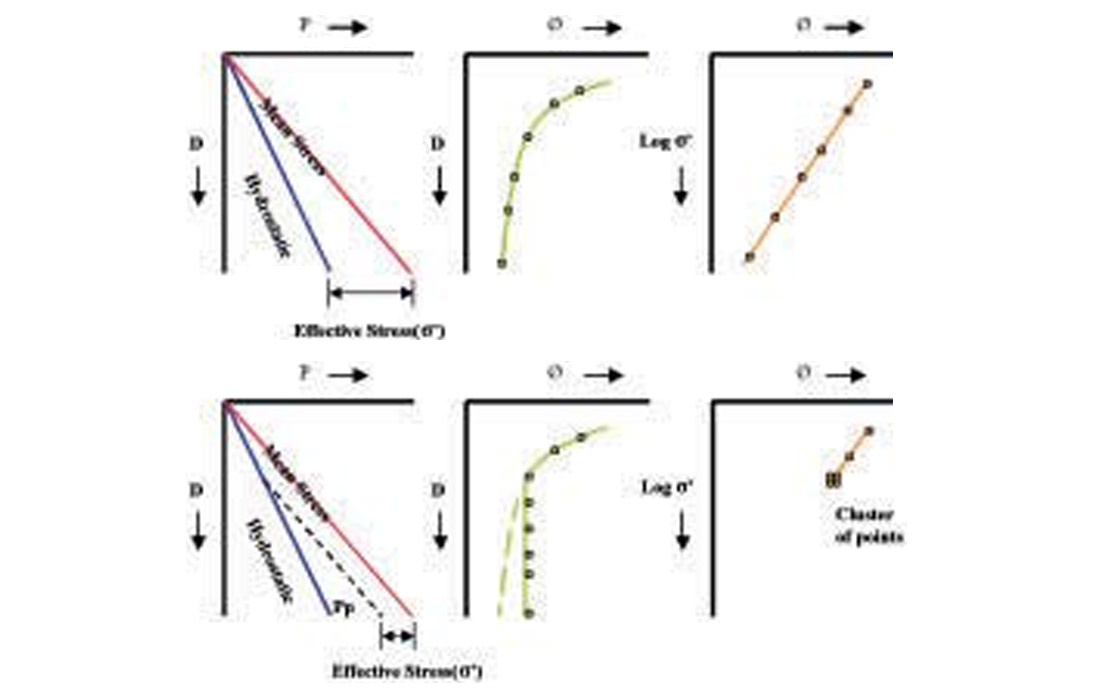
If pore pressure is the unknown in the above equation, where does the magnitude of the effective stress come from? Effective stress (grain to grain contact stress) is the principal driving mechanism for the compaction of compressible sediments. The magnitude of effective stress increases with depth when the pore pressure remains hydrostatic or normal which in turn leads to reduction of porosity (Figure 2). Porosity can be used, under the right conditions, as a direct indicator of effective stress. With overpressure due to ineffective dewatering, compaction is slower than expected relative to the depth of burial and “normal” effective stress. Although the sediments are overpressured they still retain the correct relationship between porosity and effective stress (Figure 1b). In this case the rocks are undercompacted and will retain sediment properties, such as porosity and permeability, which are associated with shallower depths of burial. This framework describes the basis for porosity-based pore pressure prediction, in which porosity is assumed to be controlled solely by compaction (i.e. no chemical processes involved) and to reflect the current effective stress of the sediment. These principles are summarized in Figure 2.
In practice porosity is not measured directly during conventional oilfield drilling operations. Rather porosity values are derived from wireline response (e.g. density, sonic, resistivity, neutron log), or a porosity attribute may be used directly, for example velocity data derived from seismic. This methodology works well in low temperature, young, fine-grained sediments, particularly where the lithology remains similar (in composition and grain size) throughout the section drilled, and where an upper shallow section exhibits a recognizable “normal compaction curve”. However, porosity based pore pressure prediction does not always deliver a satisfactory pore pressure estimation, either because these assumptions are not valid, or because there is insufficient data. There are several reasons for failure of the traditional porosity-based methods, especially in “older” (higher temperature) basins and where mixed lithologies are found. Solutions are found in (a) calibration using offset wells – essentially introducing a “fudge factor” which will be locally developed; (b) maximizing the number of direct pressure measurements; (c) employing multiple complementary techniques to help understand the uncertainty.
The two main methods employed in porosity-based pore pressure prediction are the Eaton Ratio Method and the Equivalent Depth Method. Both methods are best suited to pore pressures resulting from disequilibrium compaction, and require development of a type curve to characterise the change of porosity with depth, referred to as the “normal compaction curve”.
Normal Compaction Curve
It is widely known that different lithologies compact at different rates, and from contrasting starting porosity. Lithological variability is accounted for by “best fit” of the shallow data, assumed to be normally compacted if the porosity is decreasing with increasing depth. This normal compaction curve is used to compare actual porosity on the curve such that an estimate of effective stress can be made, and hence the pore pressure estimated. Alternatives to a best fit of data include (1) a standard algorithm to describe normal compaction behavior of the same lithology, for example the shale compaction curve of Balwin and Butler, (1985), or (2) a user-defined porosity-depth curve or similar function based on local experience.
Once the normal compaction curve is defined, the pore pressure prediction involves comparison between observed porosity (or rather the attribute which is reflecting changing porosity, such as interval velocity or wireline density) and the normal compaction curve. The comparison is made at the depth of interest when using Eaton’s Ratio Method, or comparison of the same porosity value on the normal compaction curve using the Equivalent Depth Method. Both methods assume that the compaction is mechanical, and both can provide satisfactory pore pressure estimation when the origin of overpressure is undercompaction and the sediments are young and at low temperatures.
Eaton Ratio Method
The Eaton Ratio Method is typically applied to seismic or acoustic velocity data, and to resistivity data. The procedure is to examine the “porosity” vs depth data and to make a ratio comparison between (a) the value recorded, and (b) the expected value if the pore pressures were hydrostatic, i.e. plotted on the normal compaction curve. The form of the Eaton equation is:
Pp = Sv – (Sv – Pn) (Aobs/Anorm)X
Where Pp is the pore pressure; Sv is the total vertical stress (overburden/ lithostatic pressure); Pn is the normal or hydrostatic pressure; Aobs is the observed attribute (sonic, resistivity etc); Anorm is the attribute when pore pressure is normal, and “X” is an empirical constant.
Eaton developed empirical constants to apply to velocity data (where x = 3) and resistivity data (where x = 1.2).
Equivalent Depth Method
The Equivalent Depth Method also uses a reference normal compaction curve. The procedure here is to compare the Aobs with the depth at which Aobs would on the normal compaction curve. This “equivalent depth” can then be used to compute the magnitude of the effective stress, if the lithostatic is known (for vertical effective stress) or magnitude of three principle stresses are known (for mean effective stress). The pore pressure is then calculated by subtracting the vertical (or mean) effective stress from the vertical (or mean) stress at the depth of Aobs. The implicit assumption, therefore, is that porosity is controlled only by effective stress, driven by mechanical compaction.
Pitfalls in porosity based pore pressure prediction
The main reasons for failure of the method are (1) lateral transfer, involving tilted reservoirs; (2) shallow top overpressure; (3) mixed lithology; (4) vertical vs. mean effective stress; (5) overpressure mechanisms other than disequilibrium compaction; (6) non-mechanical compaction.
1. Lateral transfer
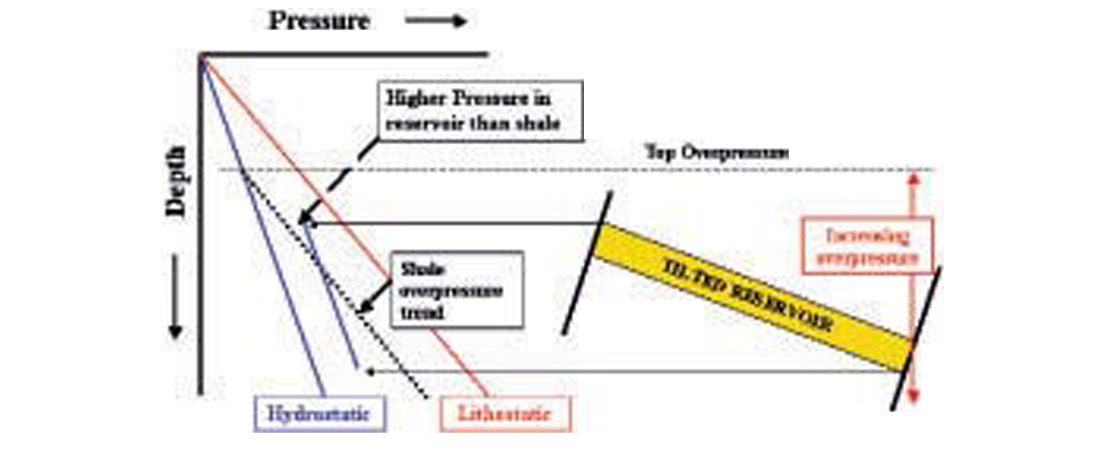
With continuous burial of fine-grained lithologies, such as shales, the magnitude of overpressure increases with burial depth. Hence the fine-grained sediments at the crest of a structure have lower overpressure than the more deeply buried “offstructure” sediments. However, a difference in overpressure cannot be sustained in high-permeability reservoirs over geological time. Hydraulic linkage of reservoirs connected between the crest and downdip locations leads to higher pressures in the reservoir at the crest than expected in the overlying shales, and can lead to underestimation of the overpressure at the crest of the structure using conventional pore pressure prediction techniques. Fluid flow modeling offers the only real insights into the magnitude of the effect. One-dimensional modeling does not capture this lateral pressure transfer; 2-D modeling (or ideally 3- D) can capture both the hydraulic linkage and the dynamics of flow associated with progressive burial over time, and hence the lateral transfer induced by the arrangement of reservoir and surrounding shale overpressure (Yardley & Swarbrick, 2000). Lateral transfer is most prominent where sedimentation is concurrent with development of structure, as in areas of growth faulting and salt tectonics, both prevalent in the Gulf of Mexico. The magnitude of the effect relates directly to the vertical relief of the high-permeability reservoirs, and is in addition to the buoyancy overpressure in the petroleum phase of a conventional hydrocarbon trap (Figure 3).
2. Shallow top overpressure
Overpressure commences at very shallow depths, close to the mud-line, in areas of high sedimentation rates coupled with ultra fine-grained, low-permeability sediments. Conventional drilling operations rarely provide porosity data in the very shallow section. Consequently, there may be no part of the section available for determination of a “normal compaction curve”. One of the principle hazards in this environment is shallow water flows where overpressure is encountered in shallow water-bearing reservoirs, whilst drilling without a riser. Drilling into the reservoir leads to upwards flow and dewatering occurs at the seabed, with spectacular consequences (Pelletier, 1999). Conventional porosity based techniques is likely to yield an underestimation of pore pressures, especially if the shallow sediments are assumed to be normally pressured for the purposes of a normal compaction curve. Traugott et al, (1999) suggest that pore pressure prediction from basin modeling using seismic velocity data in advance of drilling can help to identify the possibility of shallow overpressure.
3. Mixed lithology
A wide variety of lithologies exist in petroleum basins, related primarily to differences in mineralogy, grain size distribution, and grain shape. Lithological variability creates a challenge in the choice of appropriate normal compaction curves. Changes in shale provenance and composition render application of a single curve useless for prediction. Use of inappropriate “normal compaction curves” leads to either underestimation or overestimation of pore pressures. In the Central North Sea, where pore pressure prediction is most critical in the very high pressure Jurassic/Triassic reservoirs, overlying sediments for derivation of a normal compaction curve include glacial, smectite-poor, smectite-rich and kerogen-rich shales. This lithological diversity makes it impossible to create appropriate “normal compaction curves” for prediction purposes. The Gulf of Mexico near-shore region is another example: here an upper deltaic sand-dominated section overlies a lower pro-delta muddy section with isolated overpressured sands. Here the mudrock lithology of the upper section from which to create a normal compaction curve is not the same as the deeper section associated with high-pressure reservoirs.
4. Vertical vs. Mean effective stress
Compaction of mudrocks results from the combined effects of the vertical and two horizontal compressive stresses. Vertical stress from the overburden is the most straightforward to estimate, and may be the dominant stress in relaxed, extensional basins. usually using the bulk density from the density log or a density-sonic transform, coupled with estimates of average sediment density from the top of the logged interval to the sea-bed. In extensional settings the minimum horizontal stress magnitude can be estimated from leak off test data if wells have already been drilled in the area. Maximum horizontal stress magnitude is more difficult to estimate, although borehole break-out data and knowledge of the regional stress can be used to infer differential horizontal stress magnitude. Hence, whilst recognizing that mean stress is the control on compaction (Goulty, 1998), pragmatically the vertical stress is used most often to estimate pore pressure. Harrold et al (1999) have shown that in extensional basins in SE Asia, the use of vertical effective stress can significantly underestimate the magnitude of pore pressures when using the Equivalent Depth Method.
5. Origin of overpressure from fluid expansion
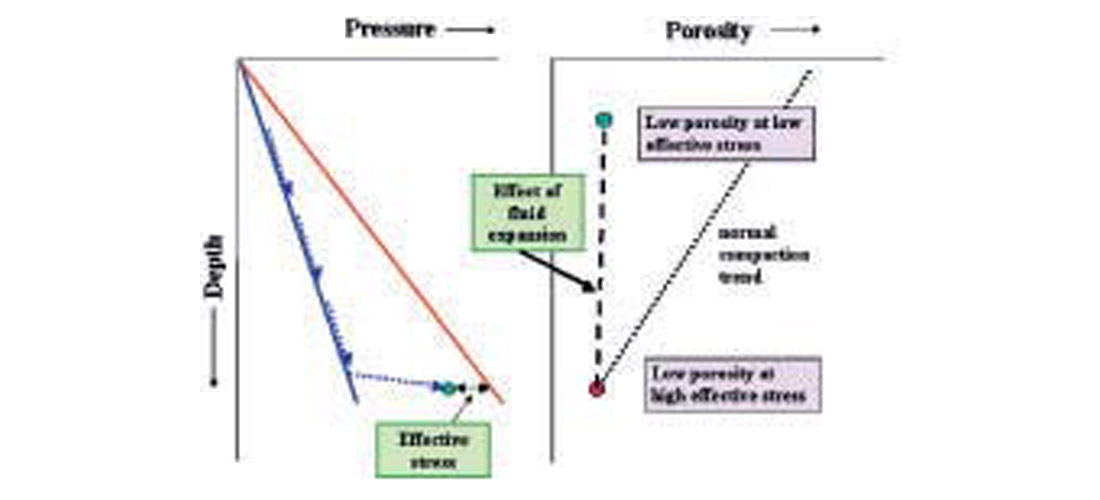
A variety of fluid expansion mechanisms may generate overpressures; these include aquathermal expansion, clay dehydration reactions, mineral transformations and osmosis. Fluid expansion, though only a secondary sources of overpressure in most basin settings (Osborne & Swarbrick, 1997; Swarbrick et al., 2002), reduces in-situ effective stress. Since there is only a small recovery of the elastic component of compaction the porosity recovery is also small, and the unique relationship between porosity and effective stress defining mechanical compaction is lost (Figure 4). Conventional porosity-based pore pressure estimation assumes undercompaction, and underestimates the pore pressures, where fluid expansion has generated all or part of the overpressure.
6. Non-mechanical compaction
Chemical processes occurring in sediments involve mineral change (e.g. k-feldspar + smectite to illite + quartz), cementation (e.g. precipitation of carbonate as pore-filling cements) and dissolution (e.g. k-feldspar). These chemical processes both reduce and enhance porosity. They also remove the sediment from its position on the normal compaction trend. If cementation takes place to reduce porosity in addition to mechanical compaction, anomalously low porosity is created relative to the expected porosity on the normal compaction curve. The effect of a low porosity is to calculate a higher effective stress and hence to underestimate the pore pressure using traditional pore pressure prediction techniques. Unfortunately, the magnitude of porosity reduction (and enhancement) from chemical diagenesis is difficult to quantify, especially in shales. Chalk is another fine-grained lithology, and prone to porosity reduction by chemical diagenesis even during early burial. Age appears to be important also. Young, rapidly deposited fine-grained sediments have had little time to dewater, but also little time at elevated temperatures to have undergone much chemical change.
Conclusions
- Porosity based pore prediction techniques work best where a “normal compaction curve” can be reliably developed, where the lithology is moderately constant, and where the overpressure is due to disequilibrium compaction.
- Lateral transfer can inflate the pore pressure at the crest of tilted reservoirs relative the overlying shales on which their pressure prediction is made.
- Lithological variability and shallow overpressure create difficulty in defining the appropriate normal compaction trends for pore pressure estimation.
- Fluid expansion mechanisms and chemical compaction processes destroy the link between porosity and effective stress associated with normal compaction behavior and challenge traditional porosity-based pore pressure prediction techniques.
- Most of the above challenges lead to an underestimate of the pore pressures, which in turn can lead to a drilling surprise.
- Solutions to the above challenges include:
(a) Calibration using offset wells – developing local understanding of wireline and rock properties to calibrate prediction results.
(b) Taking direct pressure measurements in all permeable units – nothing adequately replaces the benefit of knowing the true pore pressures.
(c) Employing multiple techniques in pore pressure prediction to help understand the uncertainty in each of the methods used. For example, employing basin modeling, seismic and wireline-based prediction techniques provide complementary results and valuable insights into the realistic range of uncertainty in prediction.
(d) Recognizing that petroleum systems are both complex and diverse, and always specify a range of uncertainty in pore pressure predictions for future wells.


Join the Conversation
Interested in starting, or contributing to a conversation about an article or issue of the RECORDER? Join our CSEG LinkedIn Group.
Share This Article