Summary
The density contrast parameter may reveal important and crucial information about the presence and saturation of hydrocarbon. In this paper, we demonstrate the relation between density contrast and gas saturation and a methodology for extracting this parameter from seismic data. We used both the linear and nonlinear formulation of the AVA equation. Field data example shows an encouraging result of discriminating low saturation gas zones from the commercial accumulation. Comparison with well log also shows a good match between the inverted density parameter and the density log data.
Introduction
Estimation of hydrocarbon saturation from seismic data is an intriguing and a challenging issue. It is known that the density parameter may reveal important and crucial information about the presence and saturation of hydrocarbon, especially gaseous hydrocarbon. The question is: a) how reliable is the density parameter estimated from seismic data (using AVA inversion process) and b) how unique is the relation between the density parameter and the fluid saturation. These are the two issues we try to address in this paper.
We will discuss the basic structure of the amplitude versus angle (AVA) equations and try to understand the sensitivity of the various contrast parameters that may be estimated from AVA inversion. We will discuss and illustrate the region of sensitivity of the various contrast parameters in AVA equation. A data example is presented from Mahogany field in Trinidad. The challenge was to discriminate low saturated gas zones from the commercial accumulations. Density inversions generated by using both linear and nonlinear AVA equations show promising results. Also a brief synthetic data study is presented in order to understand how unique is the relation between density contrast parameter and gas saturation. Although some qualitative saturation information may be inferred from the density parameter, any quantitative saturation appears to be remote at this time.
General structure of the AVA equations
Knott-Zoeppritz (K-Z) equation defines the fundamental formulation governing the amplitude versus angle (AVA) at an interface. The equation is complex and is not intuitive at all. Various approximations are made in order to simplify the equation and a variety of equations exists in the AVA/AVO literature. In this section we would like to present a unified description of all these variations which helps us understand the basic structure of the AVA equations. No matter which equation we use, we can always write the reflectivity Rpp at an angle θ, as a function of four independent parameters (three contrast parameters and one background parameter) as
shown by Equation (1). ΔVp/Vp is the contrast of P-velocity, ΔVs/Vs is the S-velocity contrast, ΔVρ/Vρ is the contrast of density at the interface and Vs/Vp defines the background parameter.

Aki and Richards (1980) made an approximation for small contrast parameters resulting in the following linear AVA Equation (2). We clearly see that we need only four parameters to define the reflectivity at a given angle of incidence.

Another variation of Equation (2), which is very common in AVA literature, is represented by Equation (3). This form is very similar to Shuey’s equation (1985) and makes similar small contrast approximations. Again, we need only four parameters to uniquely forward model the reflectivity at a given angle and AVA inversion can give us only four independent parameters.

Thomsen and Hanson (1985) suggested another formulation of the AVA equation using Gardner’s empirical relationship between density and P-velocity. Equation (4) does not have the density contrast parameter but we have a different parameter g = 0.25 .

There are more variations of the AVA equations in the literature but all of those variations can be expressed by the general formulation represented in Equation (1). If we see more parameters in the AVA equation, that simply means all the parameters are not independent of each other. If we see fewer parameters that means some assumptions are made for the missing parameters.
In order to solve the full nonlinear K-Z equation, we reparameterized the K-Z equation in a slightly different way but in terms of four independent parameters (same as in the linear case). Equation (5) represents the new formulation and the new parameters are defined as follows (Lavaud et al., 1999).

From the six initial parameters αi (P-velocities), βi (S-velocities) and ρi (densities) where i=1,2 indicate respectively the upper and the lower layer, we introduce the background variables, α , β , and χ such that

and the three rock properties contrast parameters ep (contrast of P-wave velocity), es (contrast of S-wave velocity) and ed (contrast of density) defined by

Both Equations (1) and (5) represent a general inverse problem where there is no restriction on the estimation of any of the parameters (provided we have reasonably good quality AVA information up to high angles). The sensitivity of each of the parameters (in inversion) depends on the contribution of that parameter in the AVA equation. In that way it is model dependant. If we have density contrast (across an interface) larger than P-velocity contrast then the inversion will produce better density contrast parameter estimate and vice versa. If we know the dominant parameter in a model then we may expect a better estimation of that parameter by AVA inversion process.
Region of sensitivity of various contrast parameters in AVA inversion
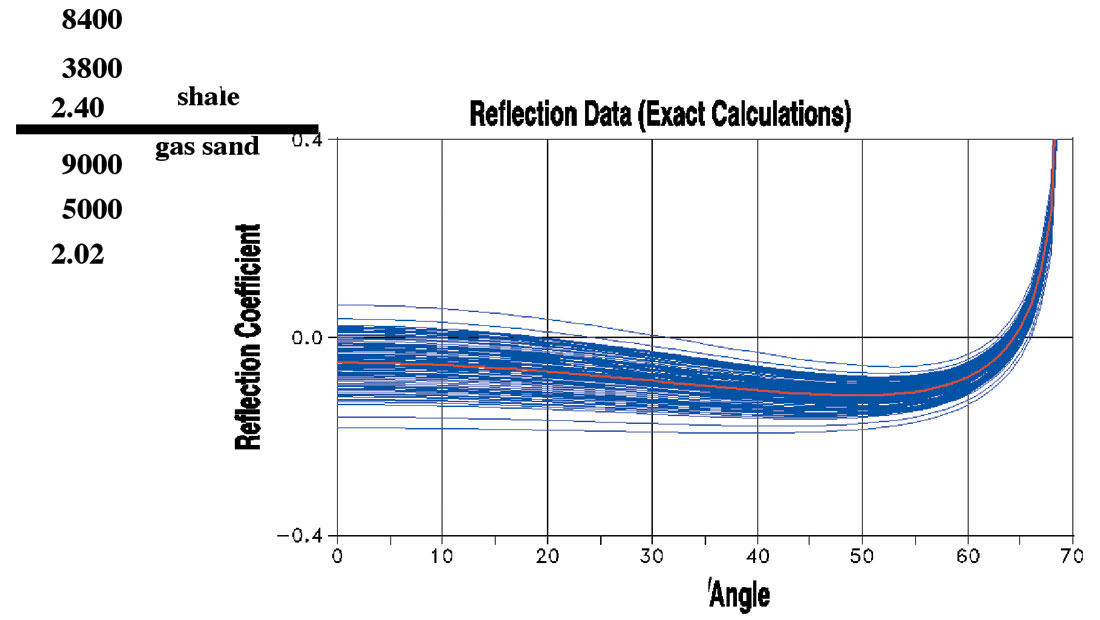
In this section we illustrate the sensitivity of the various contrast parameters in AVA inversion. It is important to understand which angle range information are more sensitive to which contrast parameters. We used full K-Z equation using the well data as shown in Figure 1 to generate these illustrations. Only the gas sand as indicated by the arrow is used. Figure 2 shows the physical parameters of the gas sand. Figure 3 represents the forward modeling of 100 reflectivity curves generated by randomly varying the Vp of the bottom layer between +20% and -20%. The red curve in the middle represents the reflectivity of the initial parameters. These curves illustrate that ΔVp/Vp contributes to the reflectivity curve over the full range of angles but it is most sensitive at the far angles (or offsets). In fact, if we know the critical angle we can perfectly compute the ΔVp/Vp parameter.
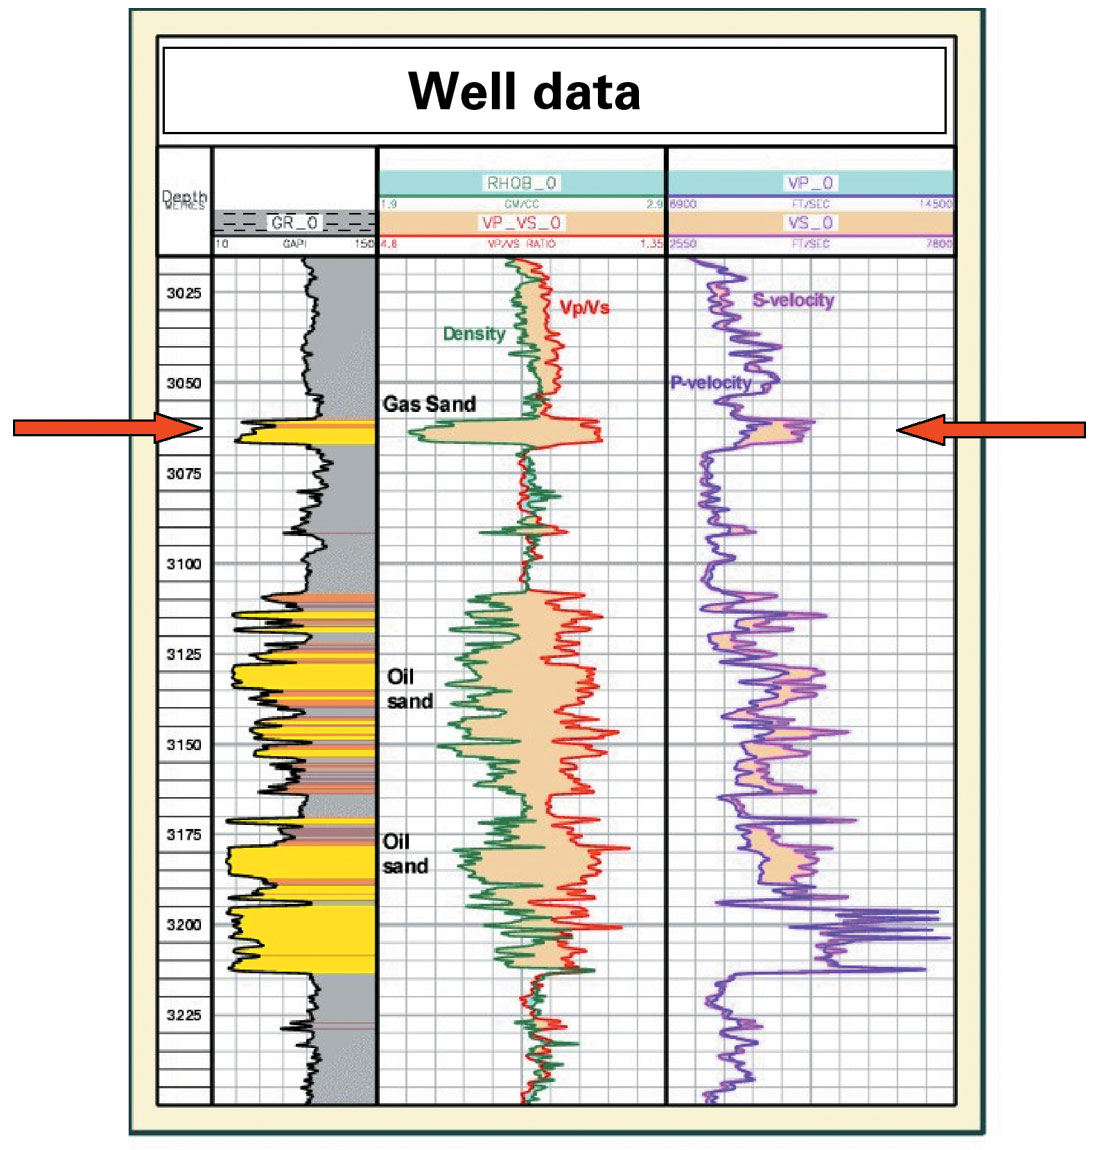
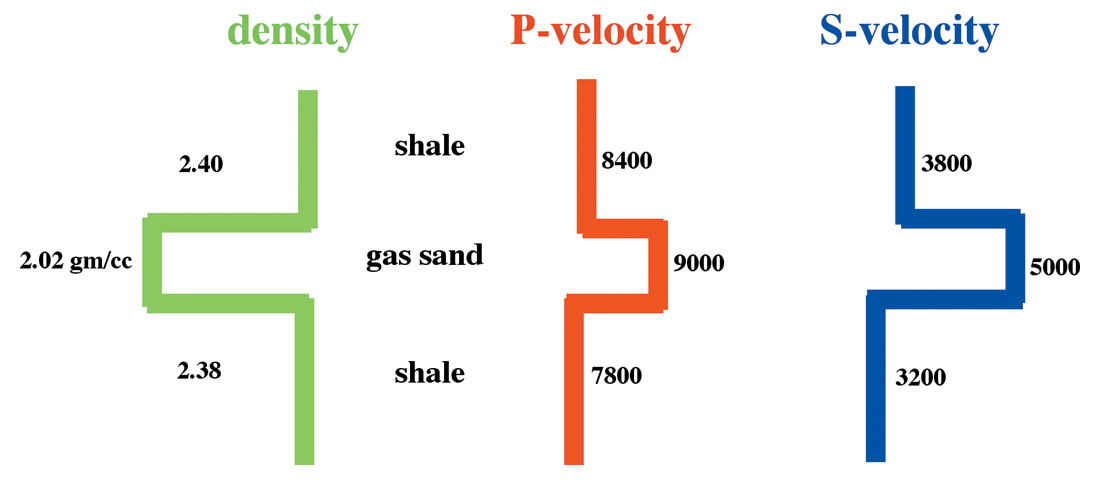
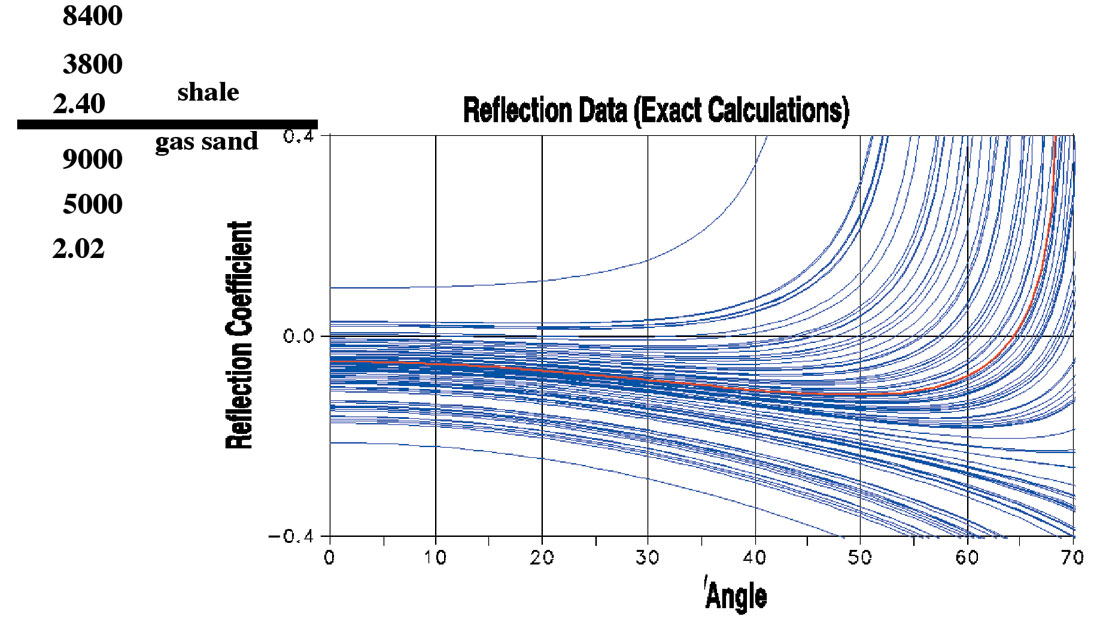
Figure 4 illustrates the sensitivity curve for the Vs generated by varying the Vs of the bottom layer between +20% and -20%. Again the red curve in the middle represents the reflectivity of the initial parameters. These curves illustrate that ΔVs/Vs contributes to the reflectivity curve at the far angles. If we want to estimate the ΔVs/Vs parameter then we need good quality reflectivity information up to high angles.
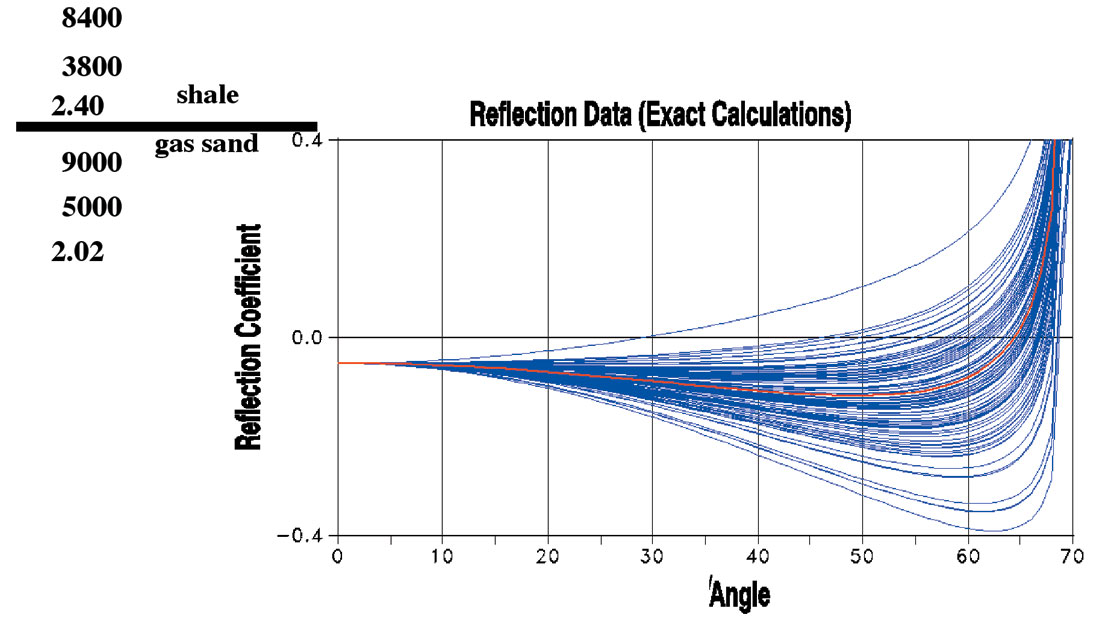
Figure 5 illustrates the sensitivity curve for the density parameter generated (the same way) by varying the density of the bottom layer between +20% and -20%. These curves illustrate that Δρ/ρ contributes to the reflectivity curve mostly at the near angles. Comparison of the Figures 3 and 5 shows that the contributions of ΔVp/Vp and Δρ/ρ to the reflectivity curve are complementary to each other and very often coupled. This also illustrates why the estimation of the acoustic impedance is so robust for any angle. Although the Δρ/ρ contributes mostly at the near angles we require good quality AVA information up to the far angles in order to decouple it from the contributions of ΔVp/Vp. Decoupling of the parameters occurs at the far angles.
Data Example: Mahogany field in Trinidad
Mahogany field is located offshore east coast of Trinidad. Figure 6 shows the location map of the Mahogany field in Trinidad. Water depth is 285 feet. The field came into production in 1998. Production is from 13+ stacked, thick (~400 ft) shelf edge deltaic intervals enclosed in a faulted anticline. Figure 7 represents the map view across the field showing the various fault blocks from which production comes. The Line of Section shown in Figure 8 indicates how complex the field is, with many stacked pays in various fault blocks. Seismic amplitude has been very successfully used to identify and map hydrocarbon intervals in Mahogany field. Most of the gas sands show strong amplitudes on the stacked seismic section. As infill drilling continues as part of field development, discrimination of the strong amplitudes from low saturation gas zones becomes increasingly important. In this section we illustrate a qualitative approach to identify low saturation gas zones in Mahogany field.
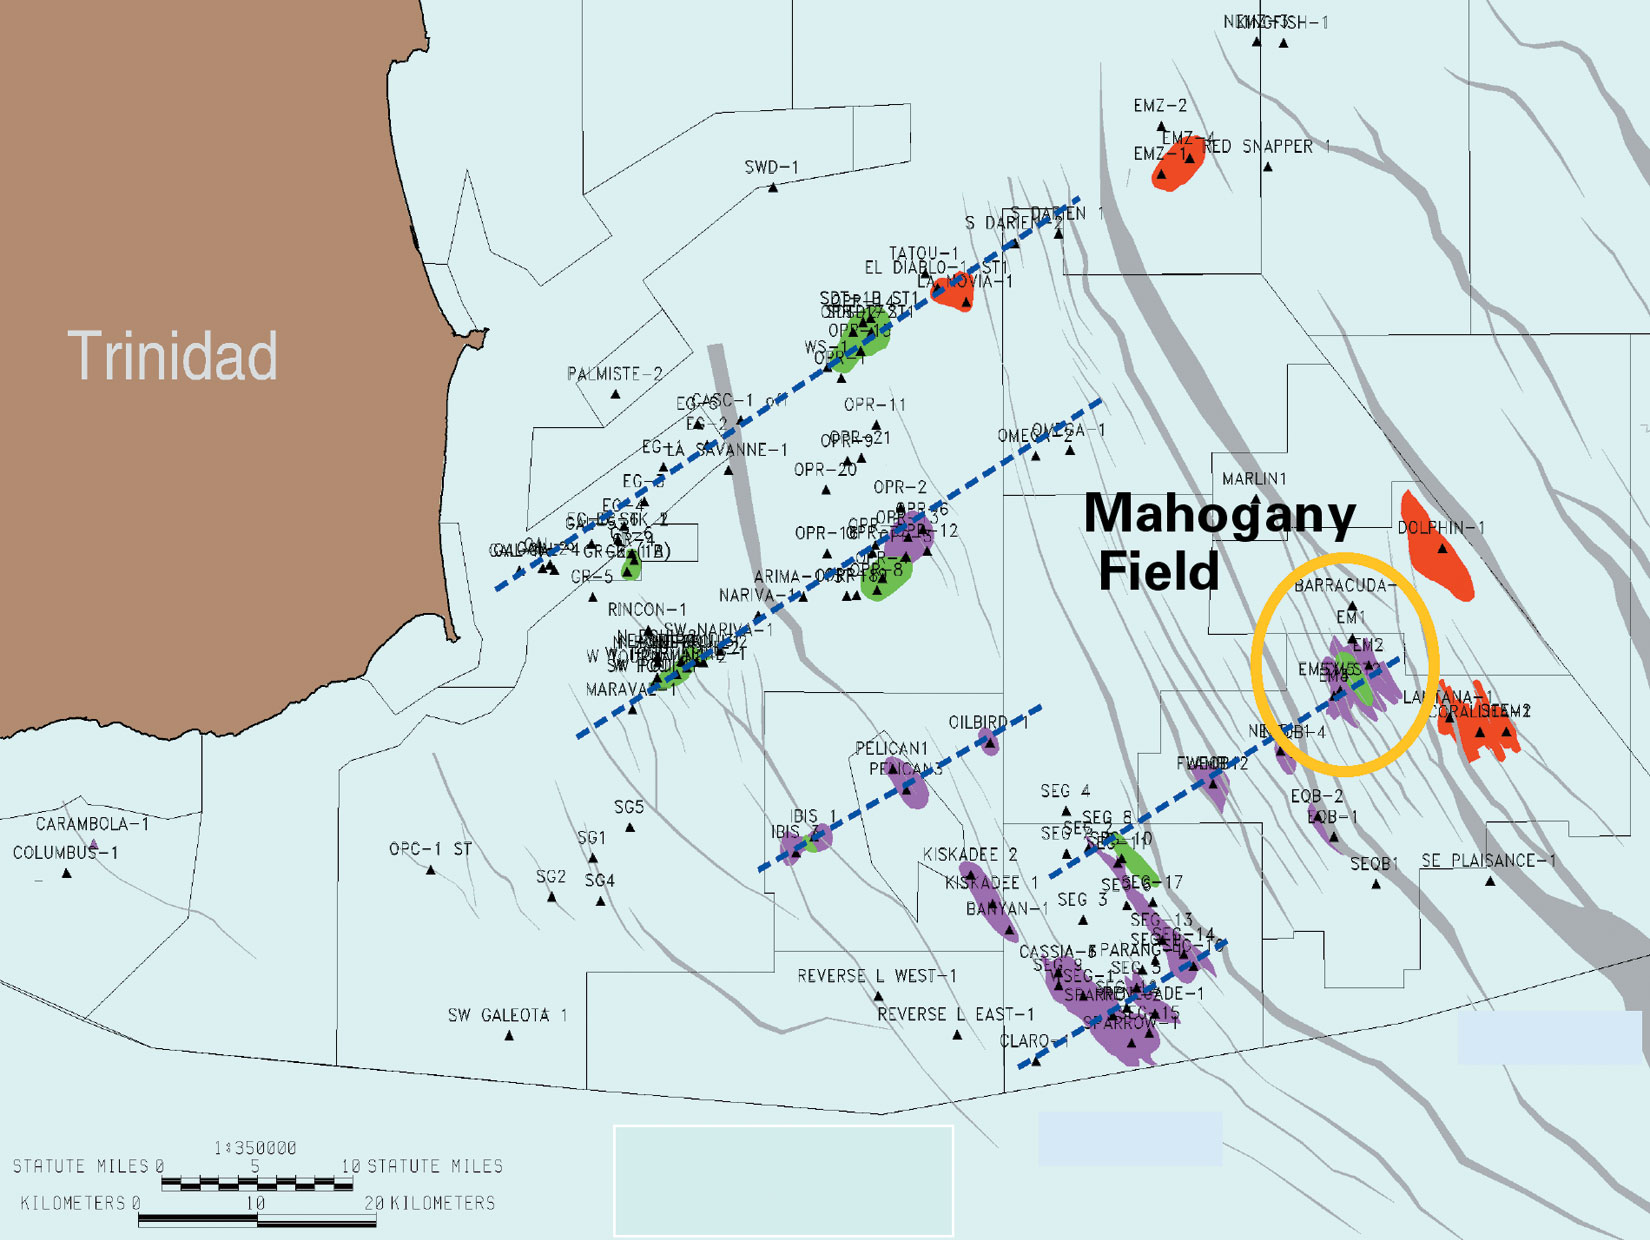
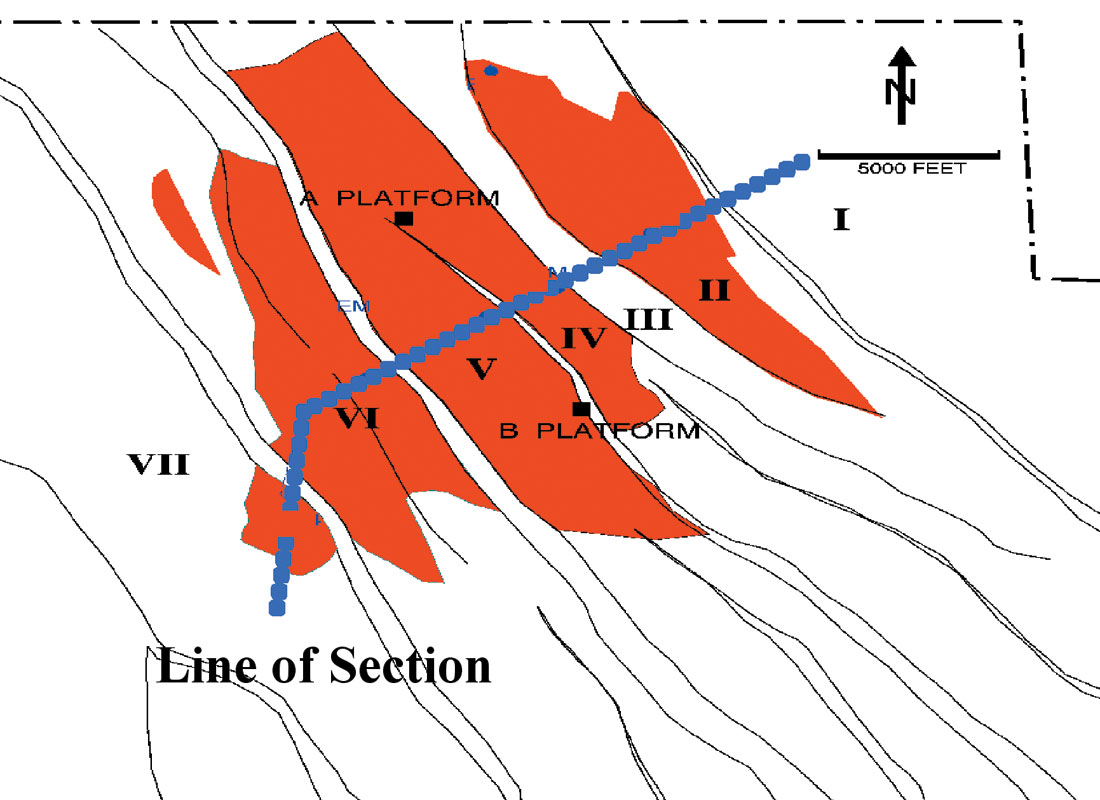
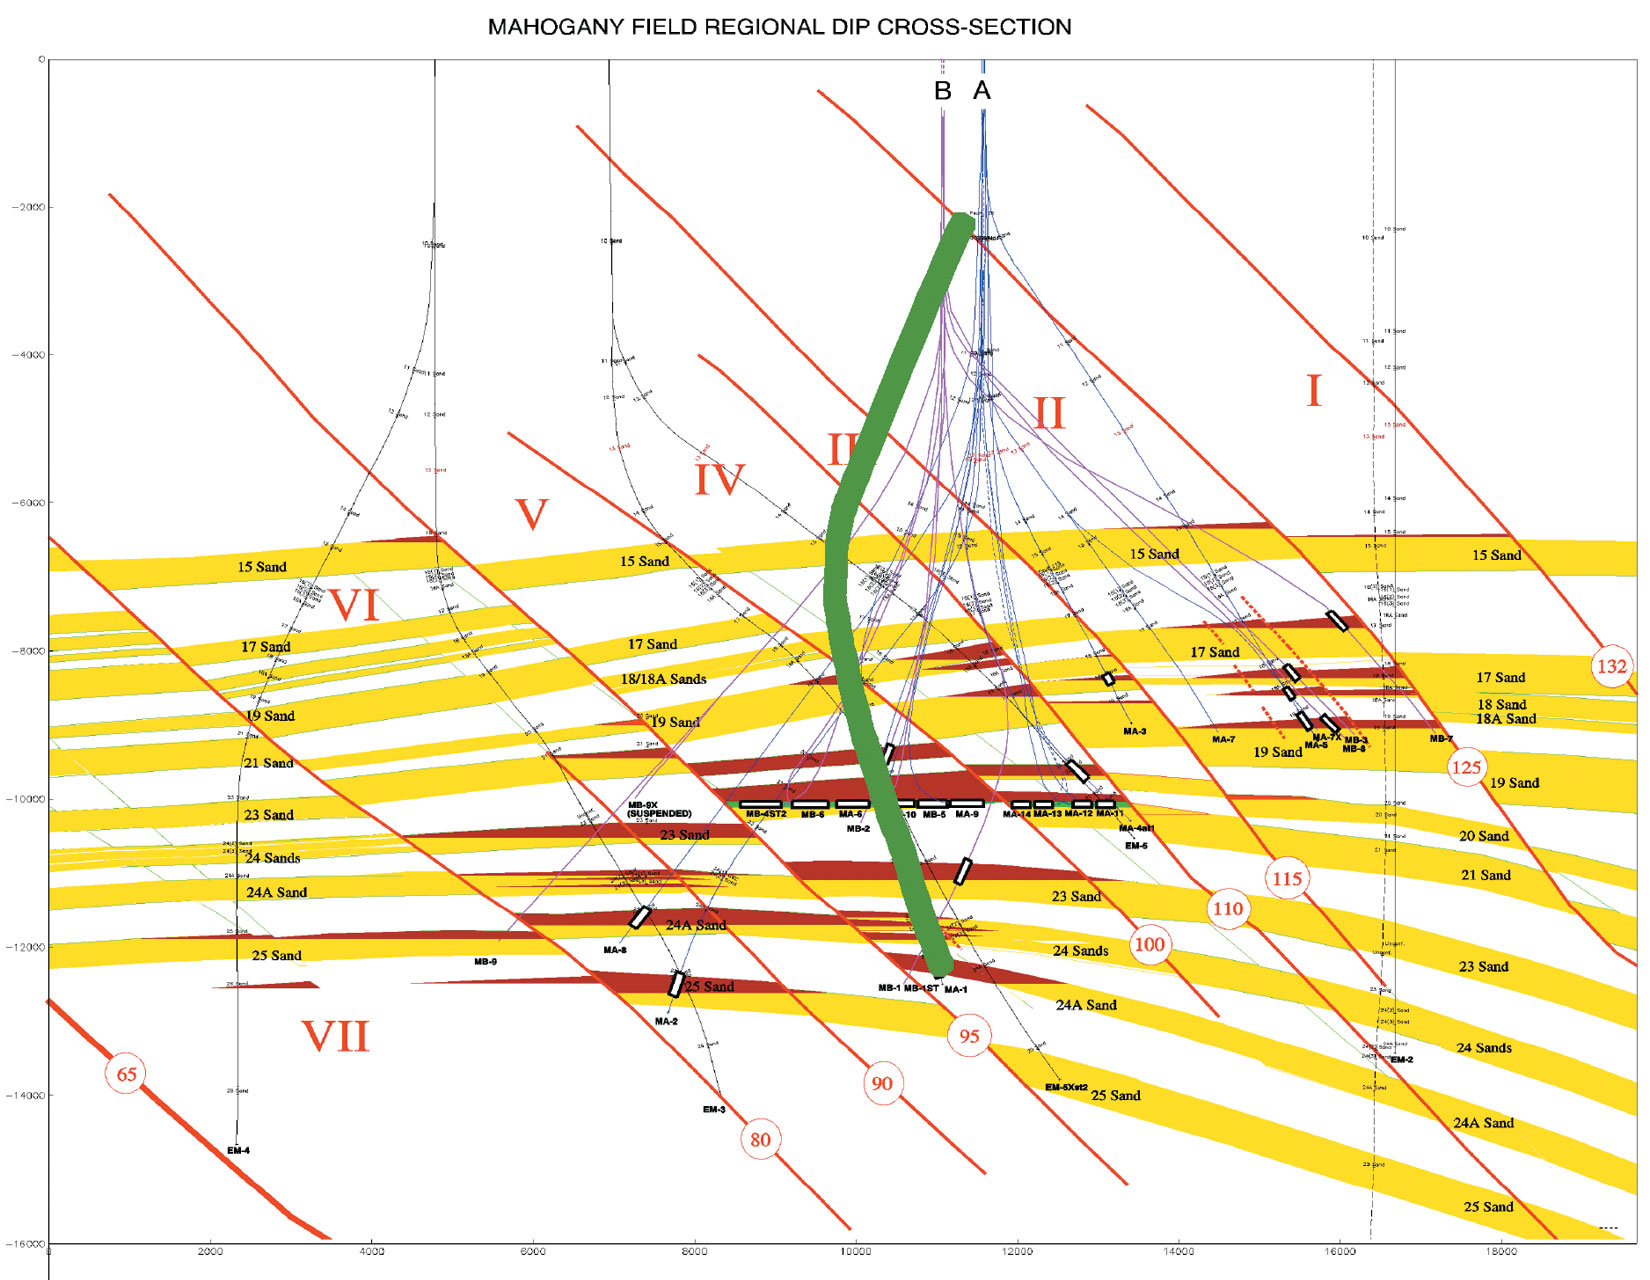
Figure 9 represents a density section generated by using nonlinear Zoeppritz solution (after colored inversion is applied to it). Nonlinear Zoeppritz solution produces a density contrast section, colored inversion applied to it generates approximate relative layer density section. This section passes through Well-2. This section shows the relative measure of density, red represents low values and blue represents high values of density. Black curve represents the density log at the Well-2. Another black curve on the right represents the saturation curve. A consistent red color at the top of a sand would indicate a higher saturation (or possible commercial accumulation) of gas content. A consistent blue color at the top of a sand may indicate a low saturation (or non commercial accumulation) of gas content. This is a very qualitative measure of saturation that may be inferred from this section.
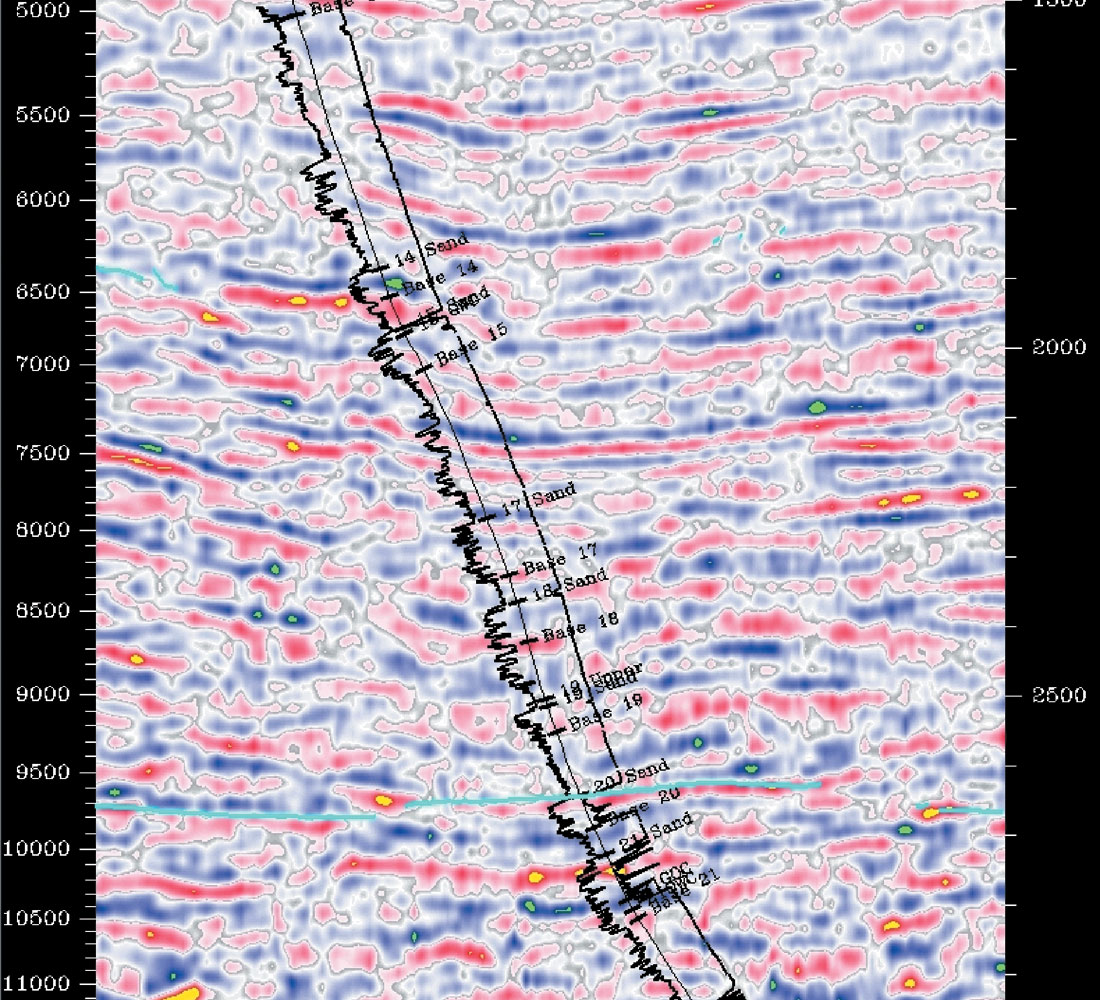
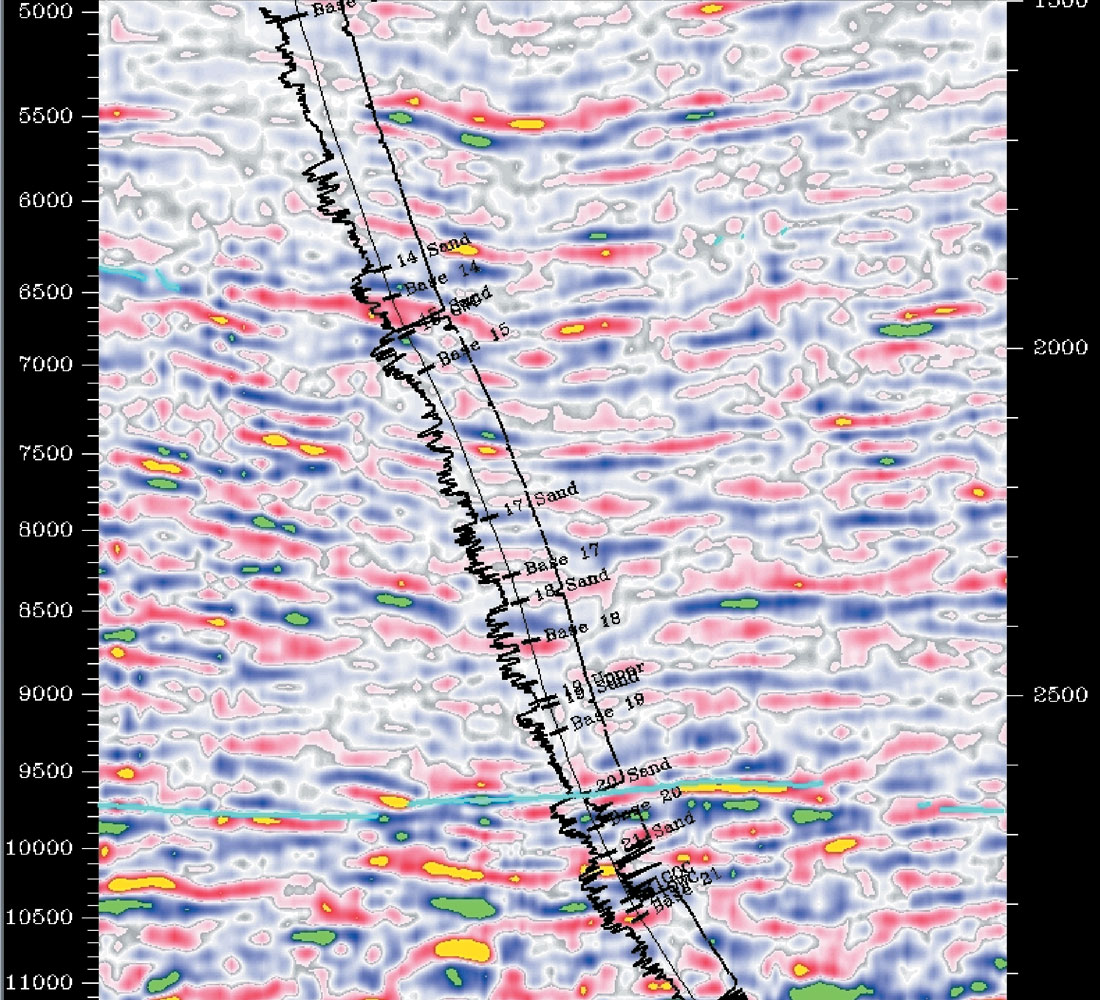
Figure 10 represents the density section generated by using the linear 3 term Aki and Richards’ solution (after colored inversion is applied to it). Both the linear and nonlinear solutions show very similar density output but the nonlinear solution (Figure 9) appears to be more consistent. For sand 14 both the sections show consistently blue color indicating a non commercial accumulation of gas. Same is true for the sands 15, 17 and 18. Top of sands 20 and 21 consistently show red color on both the sections suggesting the possible commercial accumulation of gas. The saturation curve at the Well-2 confirms this interpretation.
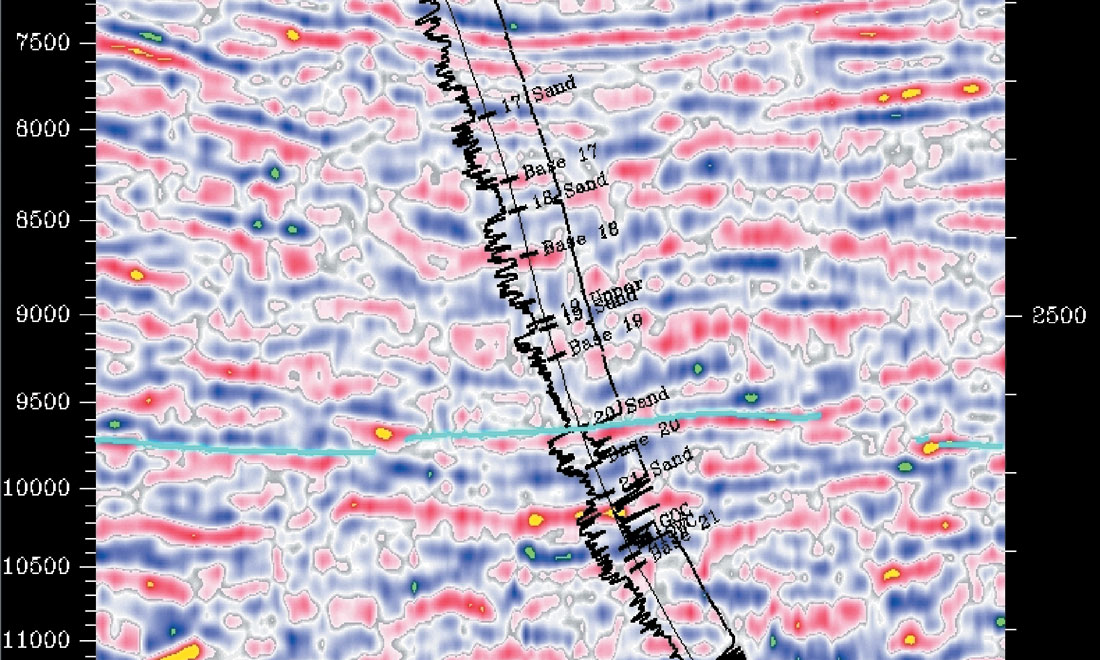
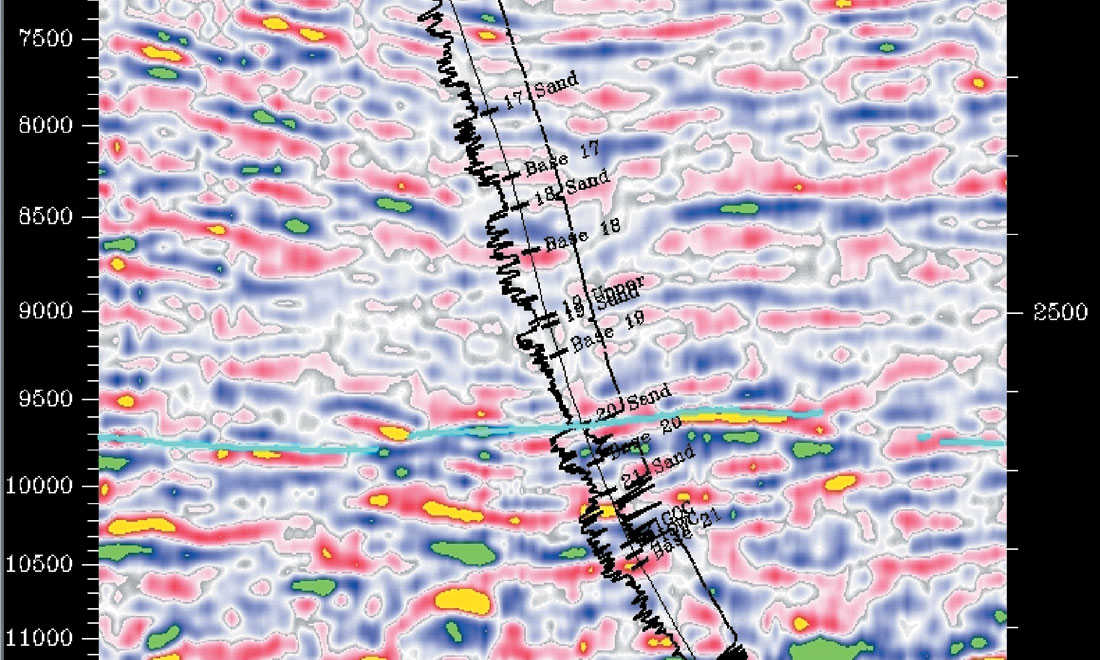
Figures 11 and 12 represent the zoomed in version of the Figures 9 and 10 respectively, which illustrate the density inversion sections for sands 17 through 21.
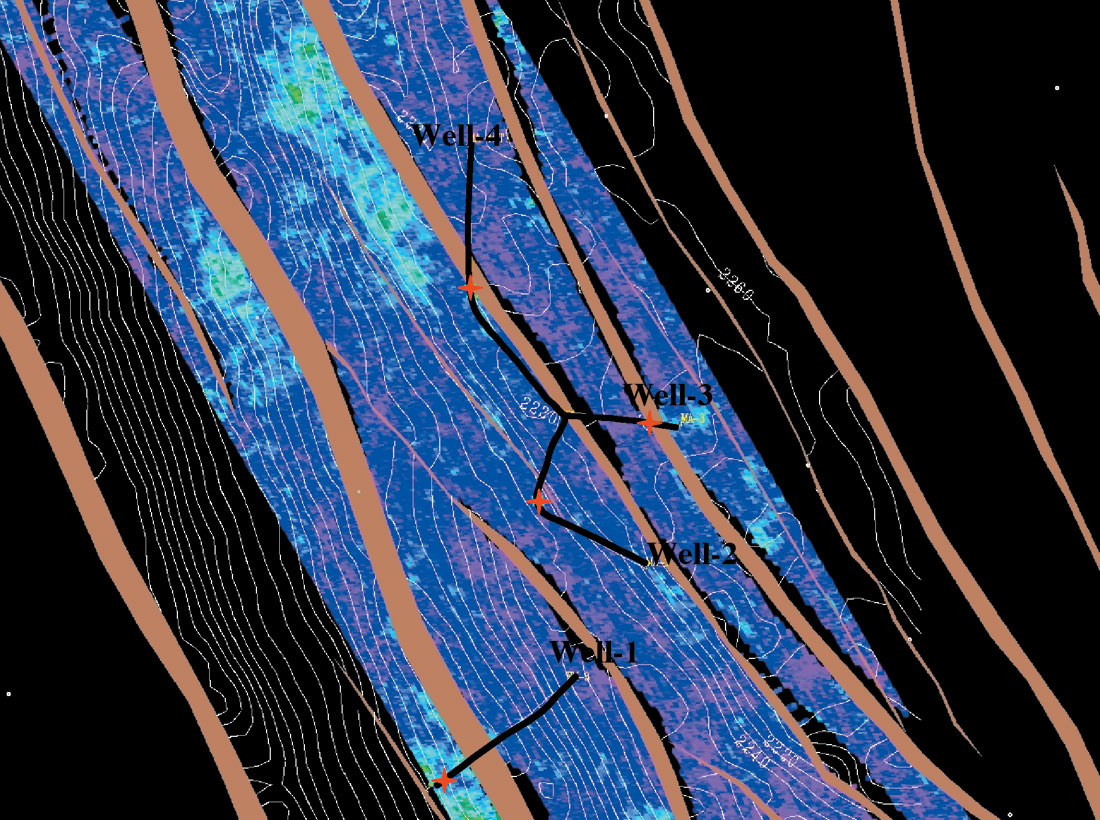
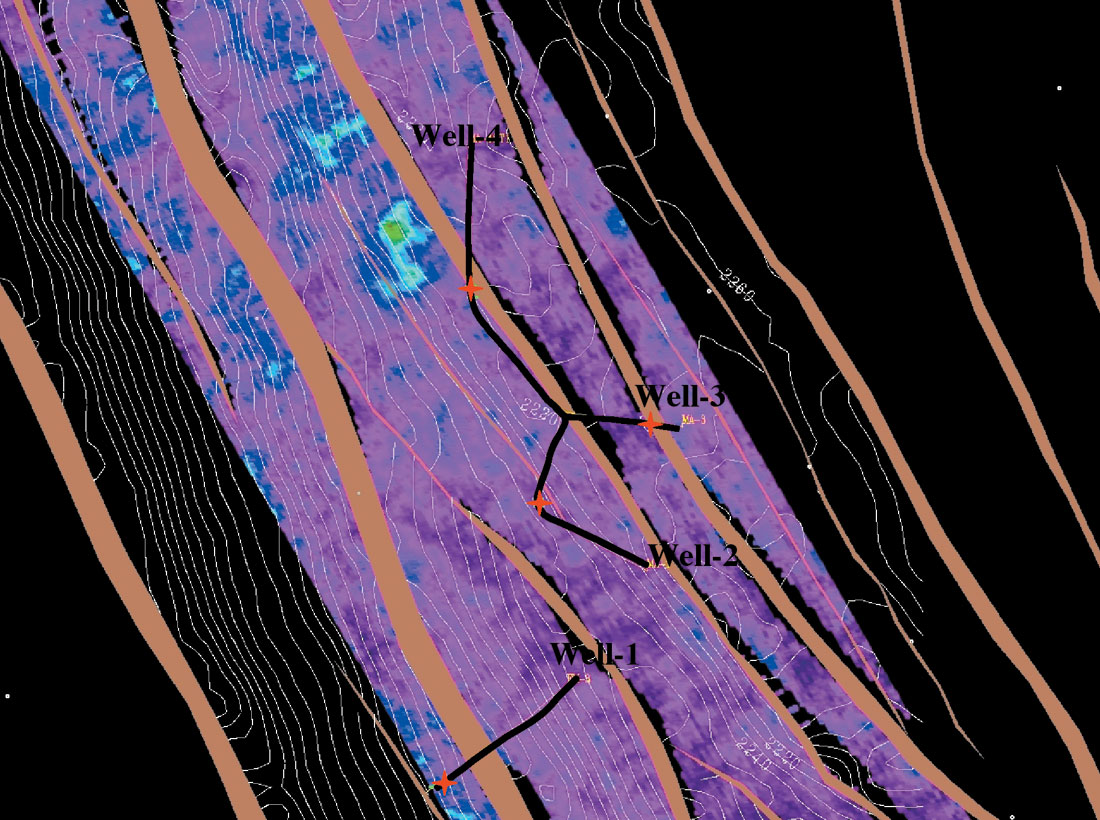
Density maps corresponding to the sands 17 and 20 are presented in the Figures 13 through 16. Four wells (Well-4, Well- 3, Well-2 and Well-1) penetrated sand 17 at the locations marked by red stars on the density map presented by Figures 13 and 14. Figure 13 is the density map generated by the nonlinear Zoeppritz solution and Figure 14 represents the density map generated by 3 term Aki and Richards’ linear solution. Neither map suggests any commercial accumulation of gas (bluish color is indicative of relatively higher density suggesting lower saturation of gas content).
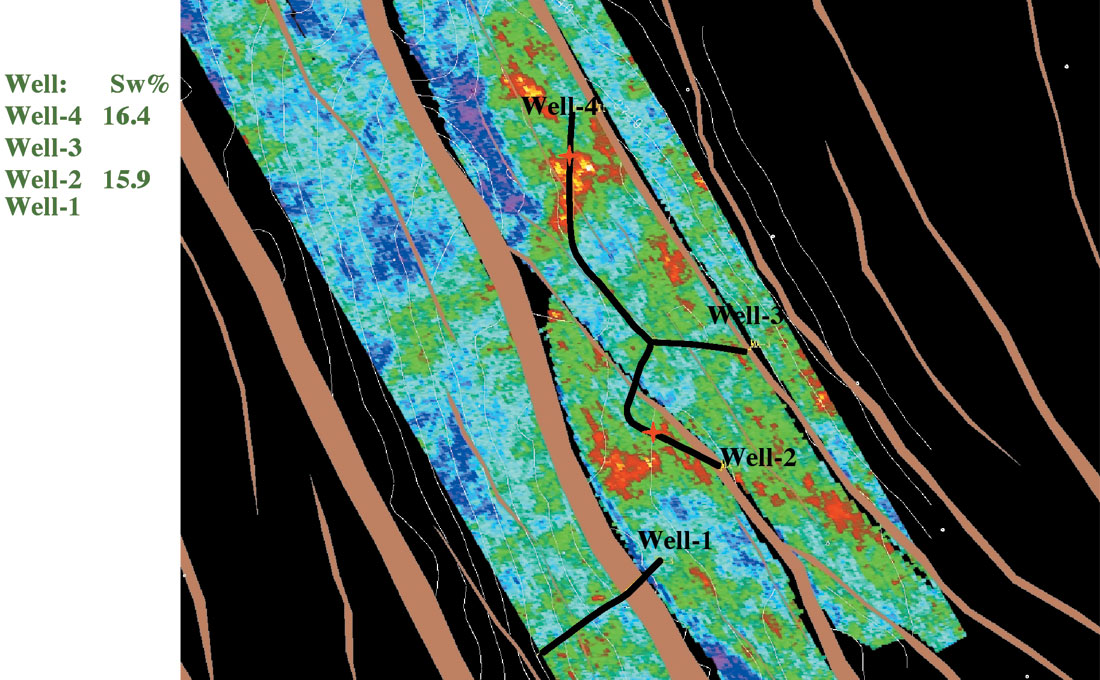
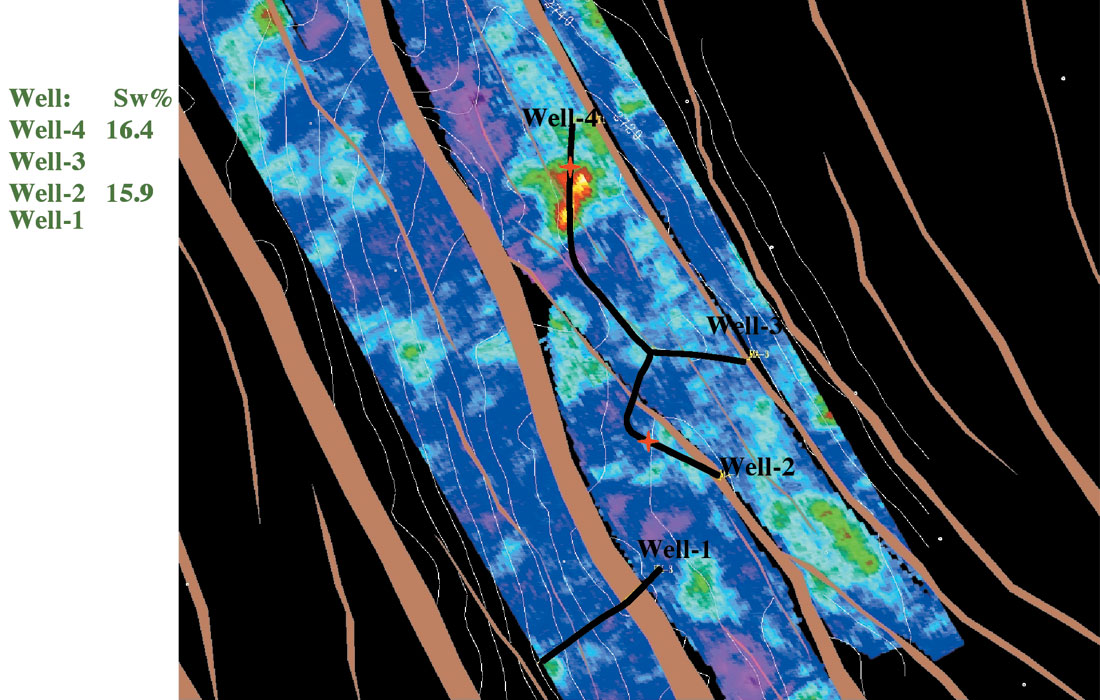
Figures 15 and 16 illustrate the density map corresponding to sand 20. Well-4, and Well-2 penetrated sand 20 at the locations marked by red stars on the density map presented by Figures 15 and 16. Figure 15 is the density map generated by the nonlinear Zoeppritz solution and Figure 16 represents the density map generated by 3 term Aki and Richards’ linear solution. Around Well-4, we see a clear indication of possible commercial accumulation of gas on both the nonlinear and the linear solutions. For Well-2, nonlinear solution in Figure 15 clearly suggests a commercial accumulation of gas (red-greenish color is indicative of relatively lower density suggesting higher saturation of gas content). Figure 16, representing the linear solution, is less clear on the presence of commercial accumulation of gas. Well data show that the central two blocks are the producer of gas. Notice that we used the relative density maps in a very qualitative way in order to infer about the saturation or the commercial accumulation of gas.
In the next section we will present a brief study in order to understand the quantitative estimation of gas saturation using the density information.
Quantitative estimation of gas saturation: synthetic data Example
In this section, we present a brief study to understand the quantitative nature of gas saturation estimation using seismic data inversion for density parameter. Figure 17 shows the partial gas fluid substitution of sand 20 at well-2. Figure 18 displays two synthetic seismograms generated with respectively 20% and 80% water saturation for sand 20. Figure 17 clearly shows that density is a dominant factor for sand 20; the corresponding variation of P-velocity is small compared to the density. The arrow in Figure 18 indicates the seismic response of sand 20 at Well-2. The amplitude cross section is displayed above the respective synthetic seismograms. We notice some variations in the amplitude versus angle. Also the two amplitude profiles, corresponding to respectively 20% and 80% water saturation, are different. However, this is a noise free data and the prospect of using this type of information for inferring saturation information is not very promising.
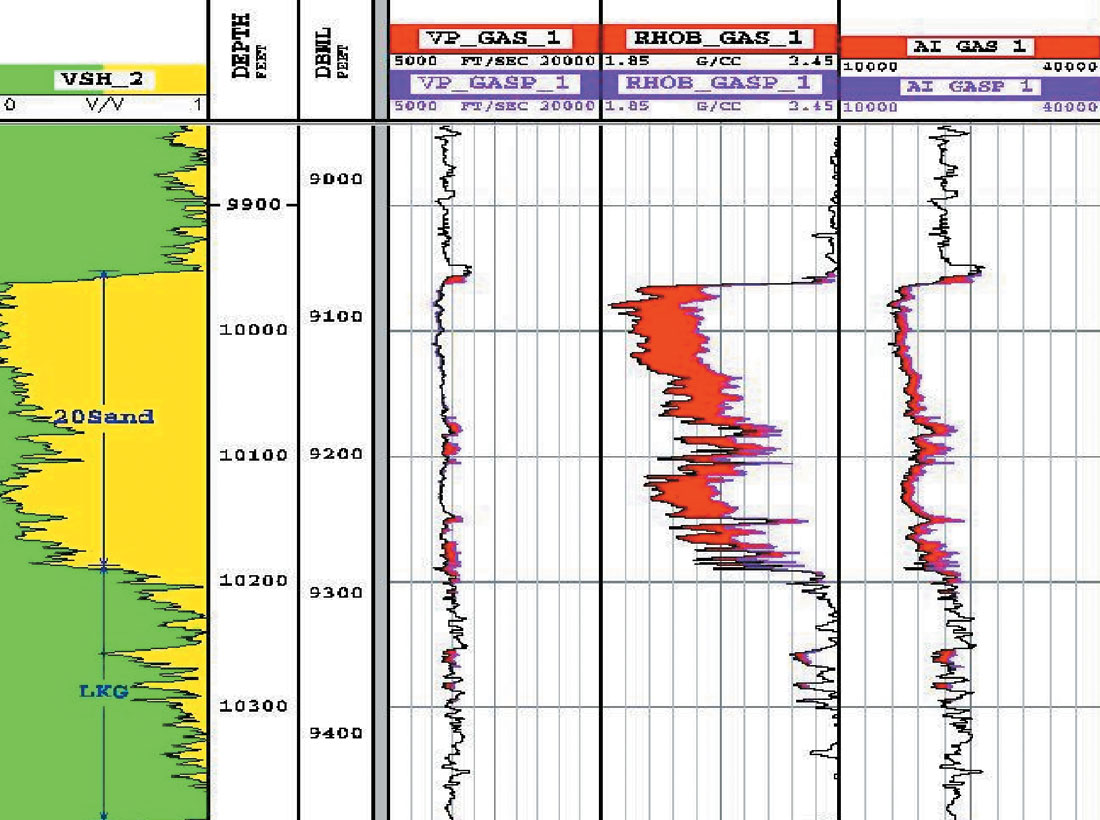
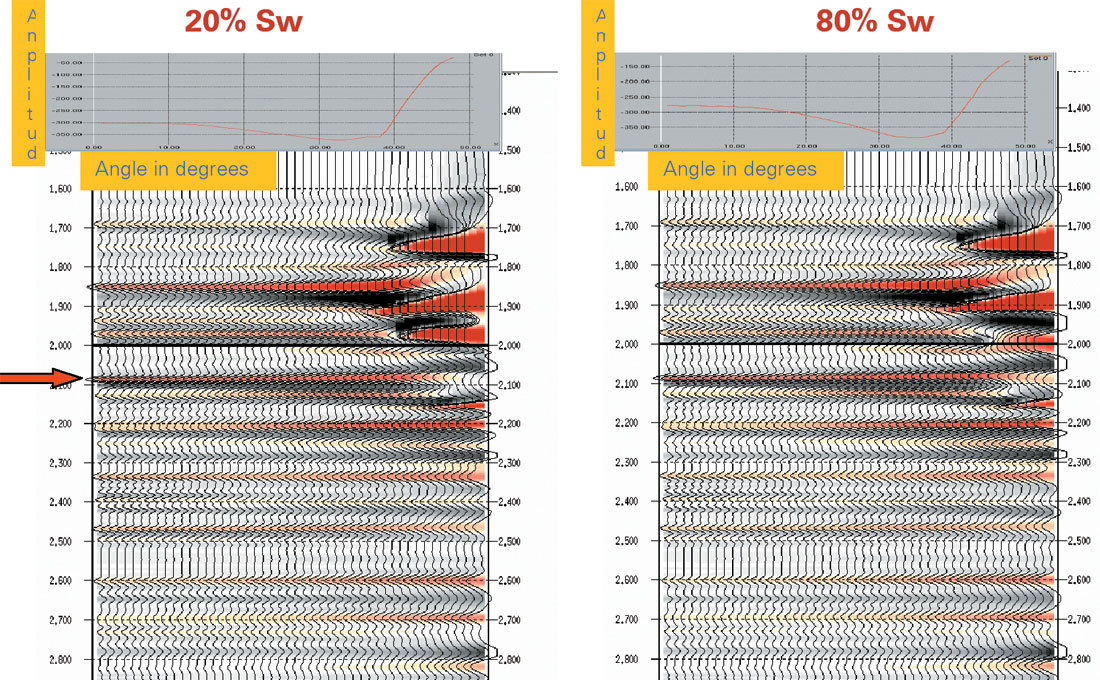
Figure 19 shows the density contrast inversion results for various water saturation using Aki and Richards’ three term equation.
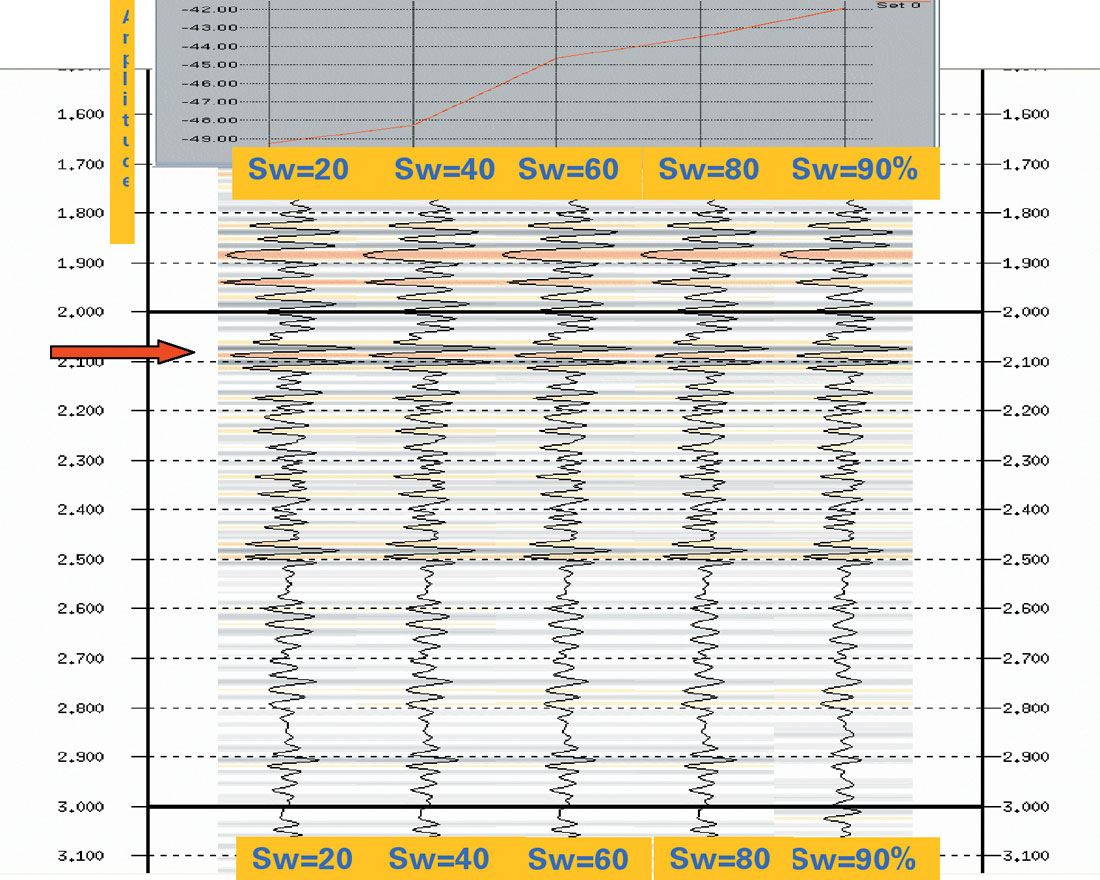
The inputs to this inversion are the synthetic seismograms generated with fluid substituted well logs as illustrated in Figure 17. The amplitude cross section at the level of sand 20 (as indicated by the arrow) is displayed above the inversion results. We clearly observe density contrast linearly increasing with higher water saturation in the sand. Figure 20 represents the inversion results using the full Zoeppritz equation. The amplitude profile shows even better linearity in the relationship between the density contrast parameter and water saturation. For field data, however, it will be very difficult to draw any realistic quantitative saturation information from this type of density information. The inversion results may still be used for some qualitative inference of saturation.
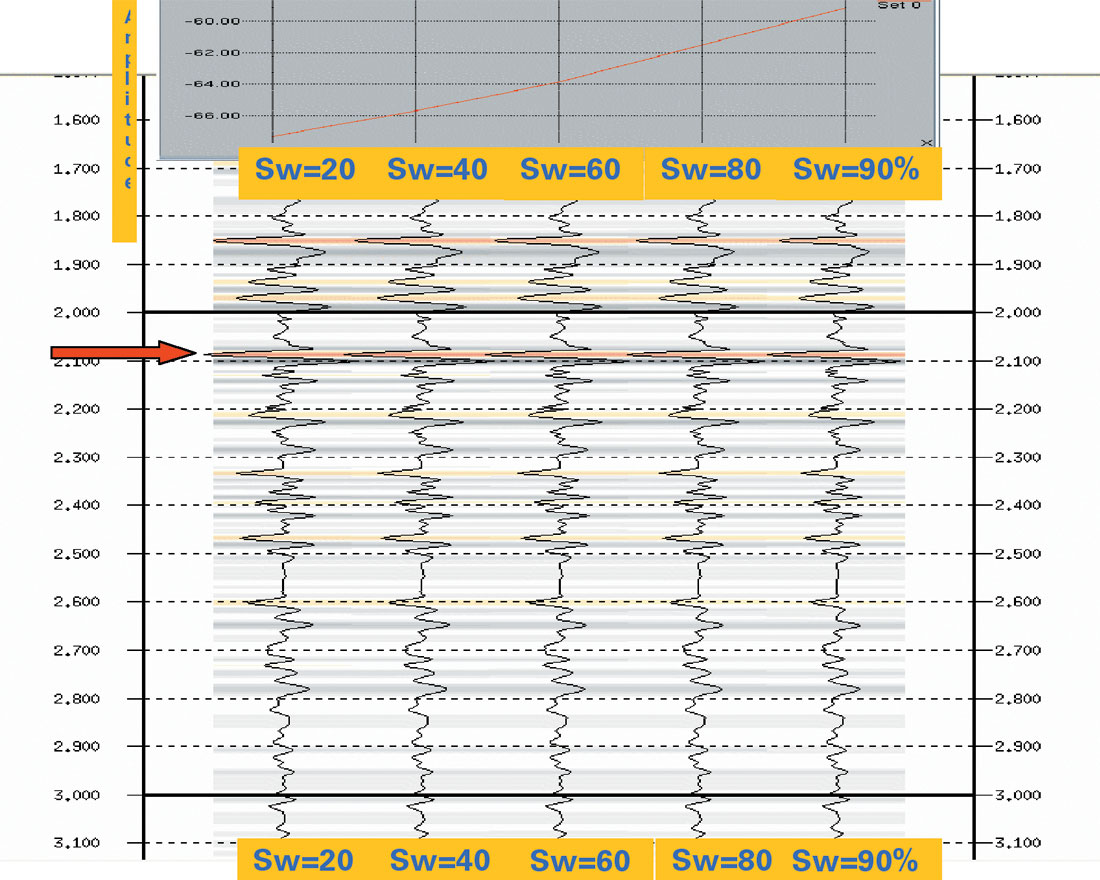
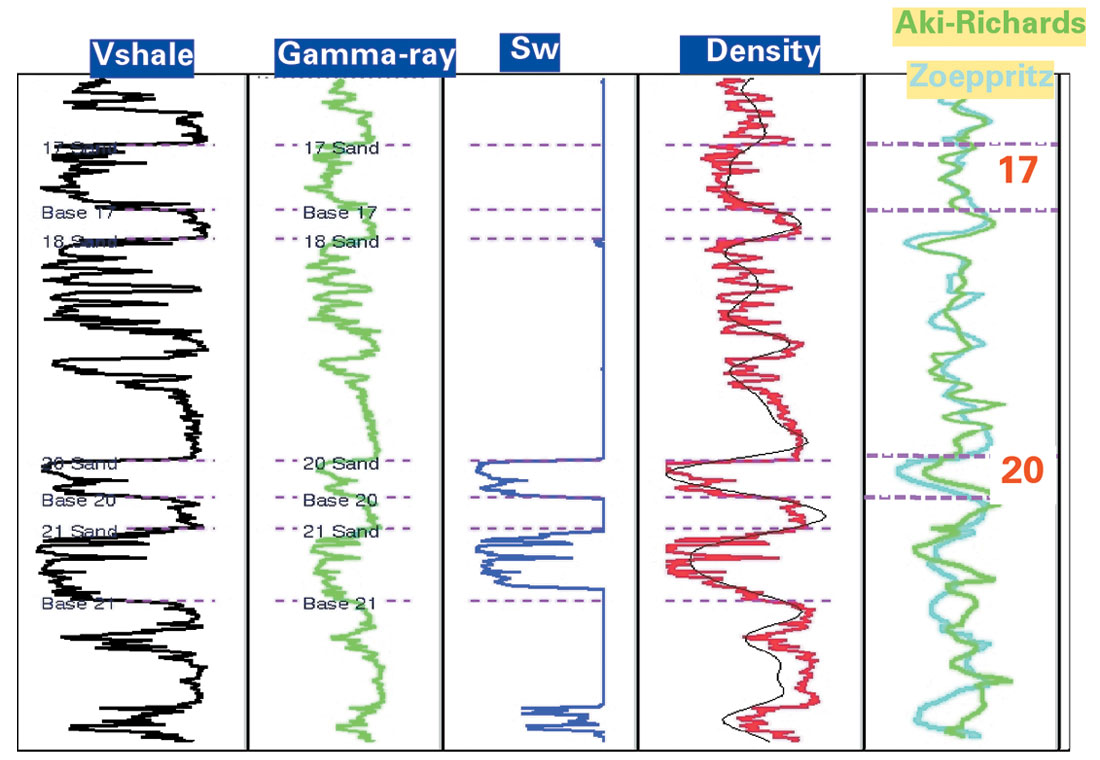
Figure 21 illustrates the density inversion results at Well-2 (along the green track in Figure 8). The red curve shows the true density log and the black curve represents the low frequency version of the density log. Relative density curves generated by using both Aki and Richard’s three term solution and nonlinear Zoeppritz solution are displayed on the right panel. Although no well information is used for the density inversion we see a very good match between the inverted density curves and the low frequency version of the density log. Nonlinear Zoeppritz solution appears to match better than Aki and Richards’ three term solution, especially around sand 17 and sand 20.


Join the Conversation
Interested in starting, or contributing to a conversation about an article or issue of the RECORDER? Join our CSEG LinkedIn Group.
Share This Article