The prediction of pore pressure (PP) is primarily established based on the divergence of the petrophysical measurements from the normal compaction trend. In the transition zone between the hydrostatically pressured and geopressured systems, formation water is expelled gradually from sediments due to pressure gradient drop from deeper to shallower depth. In this transition zone velocity, density and resistivity increase downward concurrent with the rate of dewatering process. The Normal Compaction Trend (NCT) represents the optimum fitted linear trend of these measured data in the low permeable beds in this transition zone. Inversely, in the geopressured system (where water is no longer capable of escaping) velocity, density, and resistivity measurements decrease in the low permeable beds.
In this study PP prediction and analyses, based on the effective stress models of numerous wildcats in the shelf and deep water in the Gulf of Mexico, reveal the significance of correctly defining the slope and extent of NCT.
Defining the NCT is an intricate process, which relies on several aspects. Stratigraphy and frequency of seals to reservoirs determine the slope and extent of NCT. In the outer-shelf paleo-environment a short extent and higher slope of NTC is usually associated with higher pore pressure gradient (PG). On the other hand, in the inner-shelf and deep water paleo-environments where NCT has a long extent and lower slopes a low PG is found. Moreover, structural setting has an immense impact on the slope and extent of the NTC slope. Structural high is usually associated with higher NCT slope (higher PG) and, conversely, structural low shows low NTC slope (lower PG).
The manual change of the slope on NCT leads to artificial alteration of the ratio of extrapolated normal petrophysical value to the actual observed petrophysical measurements, i.e. the value of ΔTn /ΔTo at a specific depth. Therefore, swaying the NCT slope for the purpose of calibrating and fine tuning the predicted pressure compromises the effective stress – pore pressure transformation process. Breaking the NCT to several segments for the same purpose is a compromising adjustment process.
Moreover, because the structural setting of a lead or a prospect has a direct impact on the NCT’s slope, and therefore assuming a common NCTC for the whole explored area is another pore pressure interpretation mishandling. Noteworthy, petrophysical data acquisition; processing and quality affect the outcome results and calculations.
Recommendations concluded from this study treat the NCT slope and extent as a constant predetermined geological component in the process of PP prediction – effective stress transformation models.
Background
Generic subsurface pore pressure profile is usually divided into three segments:
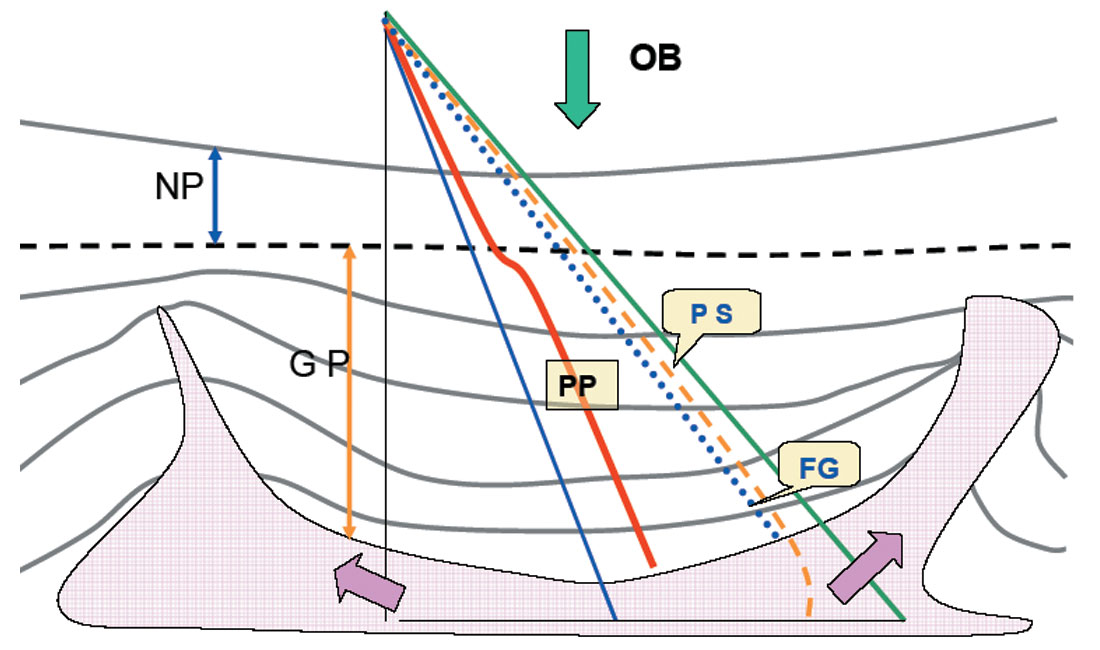
- The shallow, upper, unconfined section is usually subject to free flow surface water. In an offshore setting, sea level fluctuation, brackish water encroachment, and sediment influx have a direct impact on the hydrostatic behavior of the normally pressured system (Fig. 1). This shallow unconsolidated sediment extends between the mud-line (sea floor) down to the depth where the compaction disequilibrium dewatering (CDD) process commences. Surface casing (drive pipes) is usually hammer-driven through this unconsolidated section.
- The middle hydrodynamic section, where upward dewatering process takes place between CDD down to a depth where stress and stratigraphy prevent fluid from breaching the top seal. The upward fluid flow in this section is a result of the gradual pressure gradient drop from the deep to the shallow layers. The depth where dewatering is seized is referred to as fluid retention depth (FRD) or top of geopressure (TOG). This Transition Zone (TZ) represents the phase where compaction disequilibrium is active between the lower confined geopressure and the unconfined upper sections. Drilling water flow hazards are common in this zone among young deep-water sediments. These hazards are usually initiated by the vertical flow generated by the pressure differential and permeability contrast in this zone.
- The lower confined section is geopressured and the pore pressure gradient exceeds the hydrostatic. Although sand beds (reservoirs) show a hydrostatic pressure gradient, pressure gradient in shale (seals) is higher and tends to be analogous to the principal stress (PS) pressure gradient. Drilling in the geopressured section requires several casing points contingent on the subsurface drilling tolerance window (Shaker, 2002).
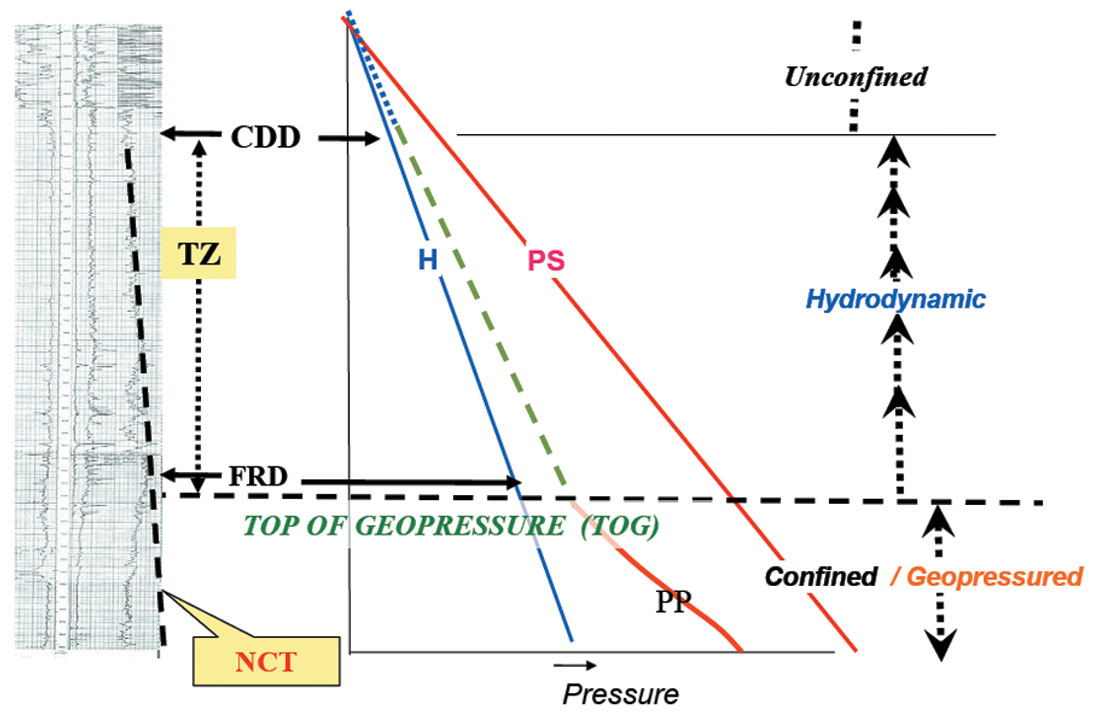
In the TZ, formation water is expelled gradually from sediments due to pressure gradient drop from deeper to shallower depth and consequently velocity, density and resistivity increase downward concurrent with the rate of dewatering process. The Normal Compaction Trend (NCT) represents the optimum fitted linear trend of these measured data in the low permeable beds. On the other hand, in the geopressured system (below TOG) where water is no longer capable of escaping, velocity, density, and resistivity measurements retreat in the seals.
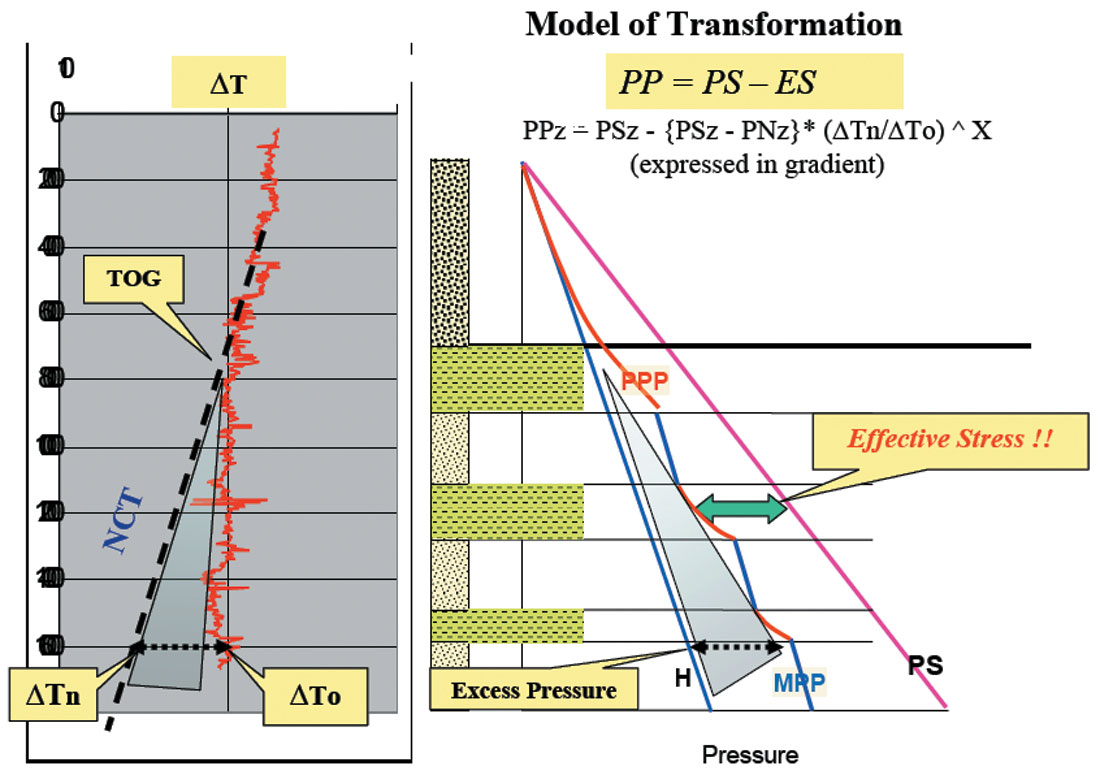
The effective stress model of transforming the petrophysical measurement (e.g. sonic slowness) to pore pressure in the fine clastic (shale, mud, fine silt) beds is based on:
| PP = PS – ES | Terzaghi 1943 |
| PPz = OBz – (OBz – Pnz) * (ΔTn/ΔTo)^X | Eaton 1975 |
Where:
PP = predicted pore pressure
PS = principal stress = Overburden (OB) in case of passive structure areas
ES = Effective stress
Z = depth to point of measurement
Pn = the normal pressure at depth Z
ΔTn = the assumed normal sonic slowness at depth Z (calculated from the NCT)
ΔTo = the observed (measured) sonic slowness at depth Z
X = PP transformation exponent (variable with age/basin location)
Therefore, the keystone for this prediction practice is the value of ΔTn /ΔTo, which is mainly conveyed as a result of establishing the slope on the NCT (fig. 2).
Geological aspects affect the slope and extent of NCT
Stratigraphy
Age: the PP profile in younger clastic sediments shows more active pressure build up and compartmentalization than older sediments that have been subjected to pressure decay over time. Therefore, NCT exhibits faster development and higher slope in younger basins, compared to older ones.
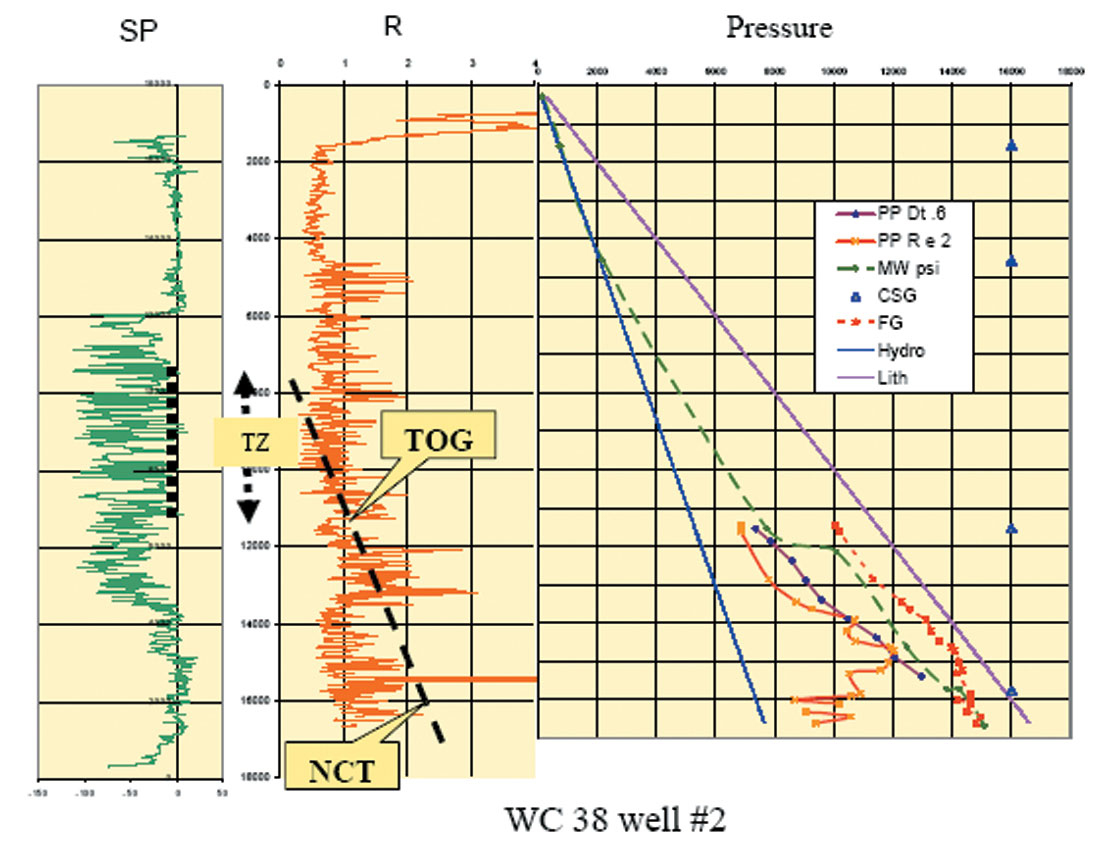
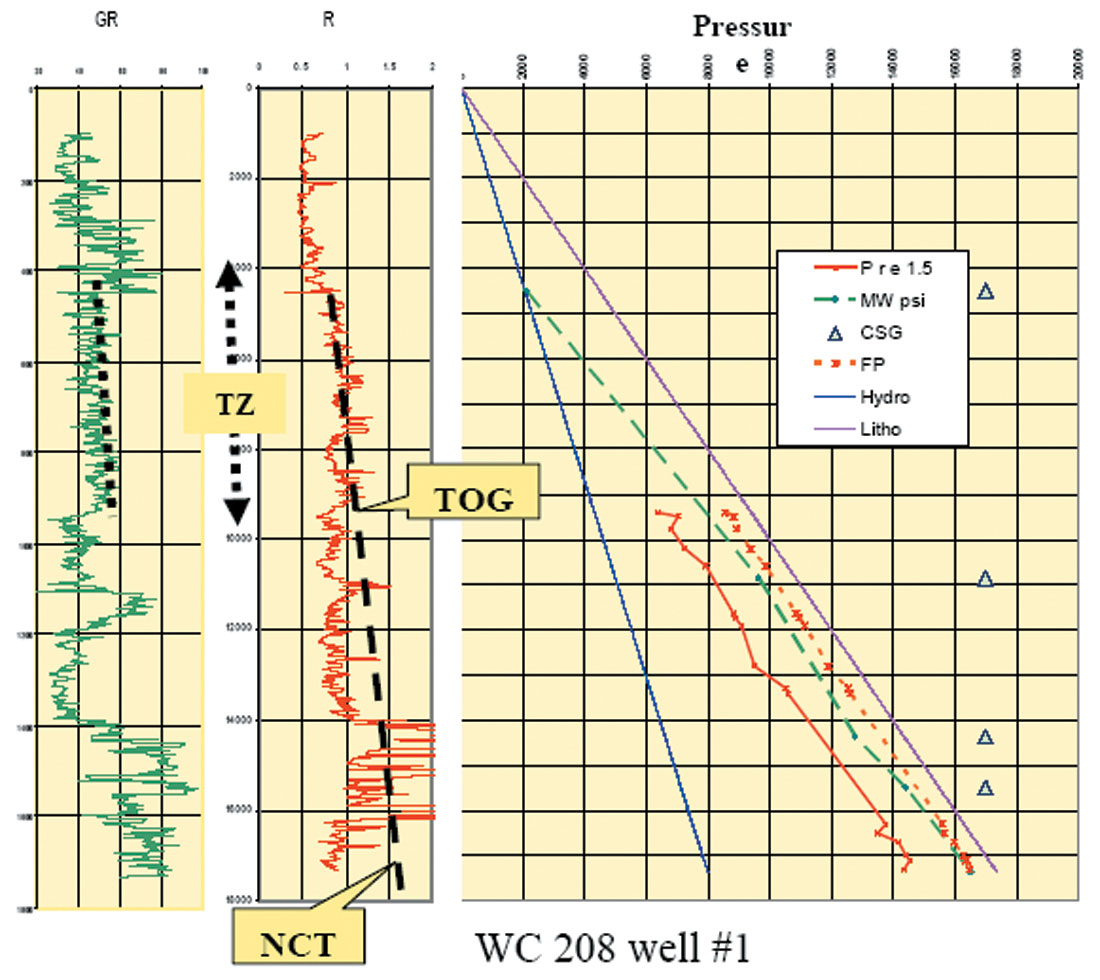
Stratification and the sand/shale: The ratio of reservoir beds (sand) to seal beds (shale) impacts the slope of NCT and the depth of the TOG. Delineation of NCT in a predominantly sandy lithology is incongruous. Shale picks on the SP/gamma and the corresponding R/DT have to be carefully chosen. For example, the sand rich middle-lower Miocene (Amph. B-Siph.D) section in West Cameron 38 Well #2 (Fig. 3), the NCT is only identified between 8500 and 11000 feet (TZ is about 2500’). On the other hand, in shale prone sections the CDD starts at a shallower depth and NCT exhibits a gradual slope. This case can be exhibited in West Cameron Block 208 Well #1 (Fig. 4) where the middle Miocene (TxW – Cris.I) is a predominantly shaley section. In this well CDD is at 4500 feet and TOG at 11500 feet (7000’ of TZ).
Structural Setting
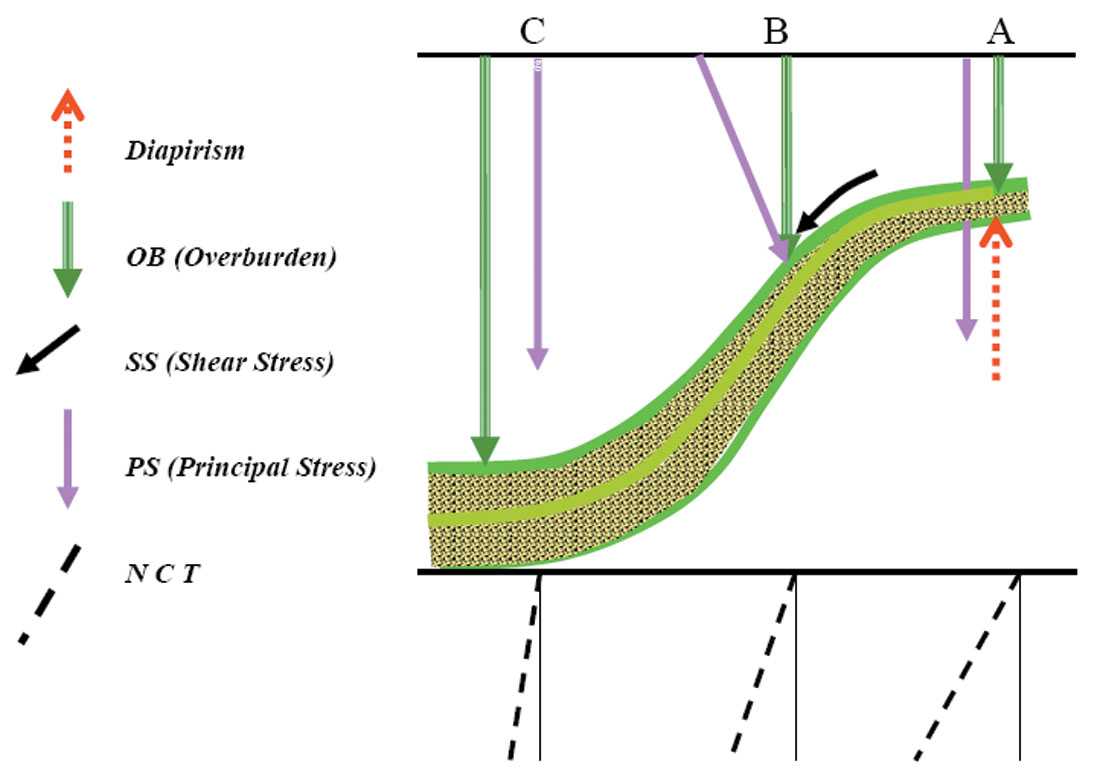
In the clastic extensional sedimentary basins, tectonic interaction between shale/salt diapirisms and the input sediments load has a direct impact on the orientation and the strength of the principal stress. The principal stress, which is the main driving mechanism for generating the excess pressure, can exceed the overburden (sediment weight) on top of structural highs (locations A and B in Fig. 5). On the other hand, in a basinal position, where shale and salt base withdrew to accommodate for influx of expanded coarser sediments, principal stress may be retarded and slows down the pore pressure development (location C in Fig. 5). Consequently, NCT slope shows a higher gradient on structural highs and, conversely, low gradient in structural lows (Fig. 5). Several cases from the Gulf of Mexico follow:
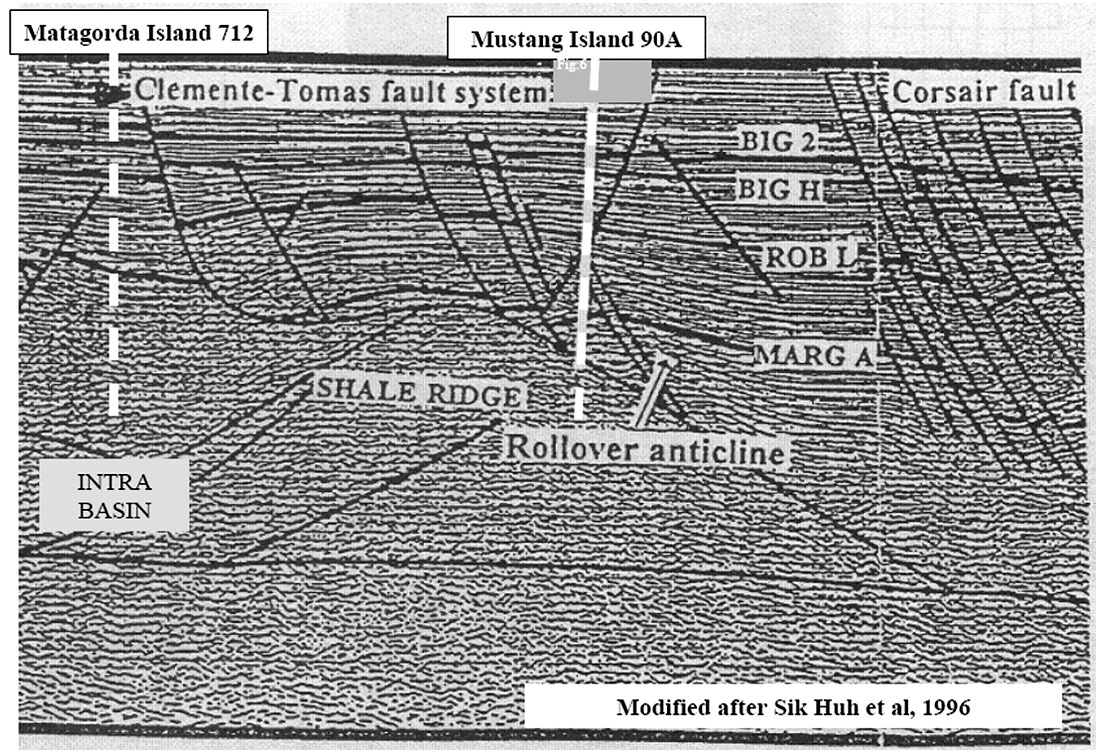
Offshore shelf – shale based basins: A thick shale section of deep paleo-environment forms the base of the sedimentary column in the offshore Texas Shelf. Ridges and intra-basins were created as a result of differential stress due to the progradational load of sediment input throughout the Oligo-Miocene time (Fig. 6).
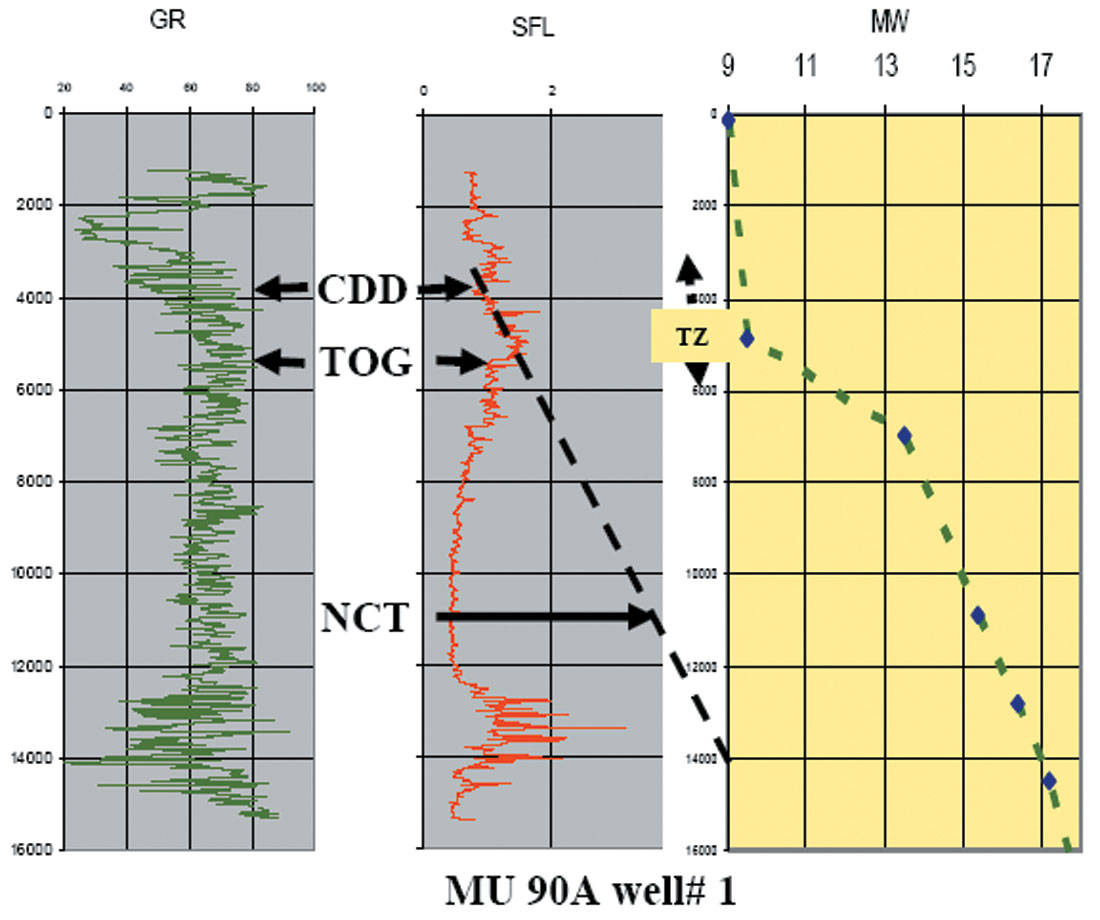
Wells drilled on the crest and in proximity of a ridge (e.g. Brazos Ridge) show higher NCT slope gradient and consequently a higher PP gradient. This is the case in Mustang Island block 90- A Well #1 where TZ covers a short interval (about 2000’) and NCT shows high slope gradient (Fig. 7). Note the mud-weight profile shows a sharp increase crossing the TOG zone to the geopressured compartmentalization below.
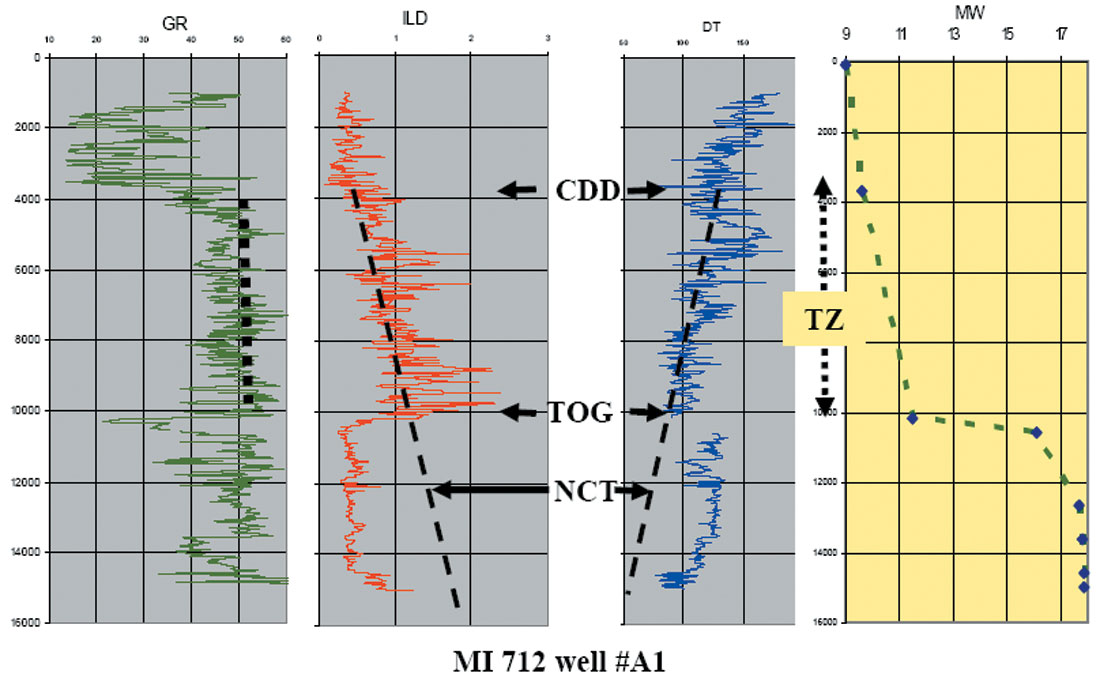
Wells drilled in the intra-basins show a slower pressure build up as a result of low slope gradient of the NCT. In case of Matagorda Island Block 712 Well #1, the CDD-TOG interval is about 6000 feet and shows a low NCT gradient (Fig.8). Note the mud weight profile slowly increases crossing through the TZ interval to compensate for the gradual PP increase.
Deep water salt basins: The salt has unique physical properties such as low density, impermeability and a ductile nature. Interacting with sediment loads creates a different form of salt tectonic related features such as diapirs, ridges, withdrawal synclinal basins, overhangs, canopies, etc. During formation of these features, the force and orientation of the stress fields change (Fig. 5). In general, pore pressure shows a high gradient above salt and low gradient below salt (Shaker, 2005). The NCT on the top of diapiric structural high features in the transition zone shows high gradient and, consequently, higher PP gradient. On the other hand, salt synclinal basins exhibit low NCT gradient and, accordingly, slow pressure gradient build up. For the purpose of this paper two examples will be given:
1. Salt diapirs
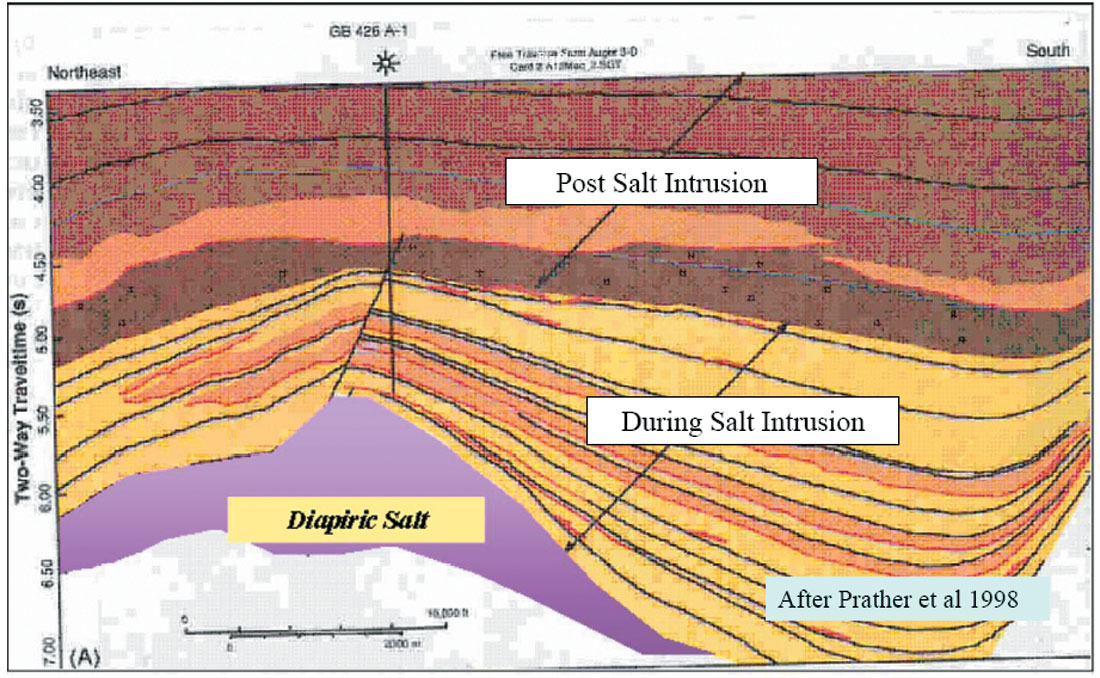
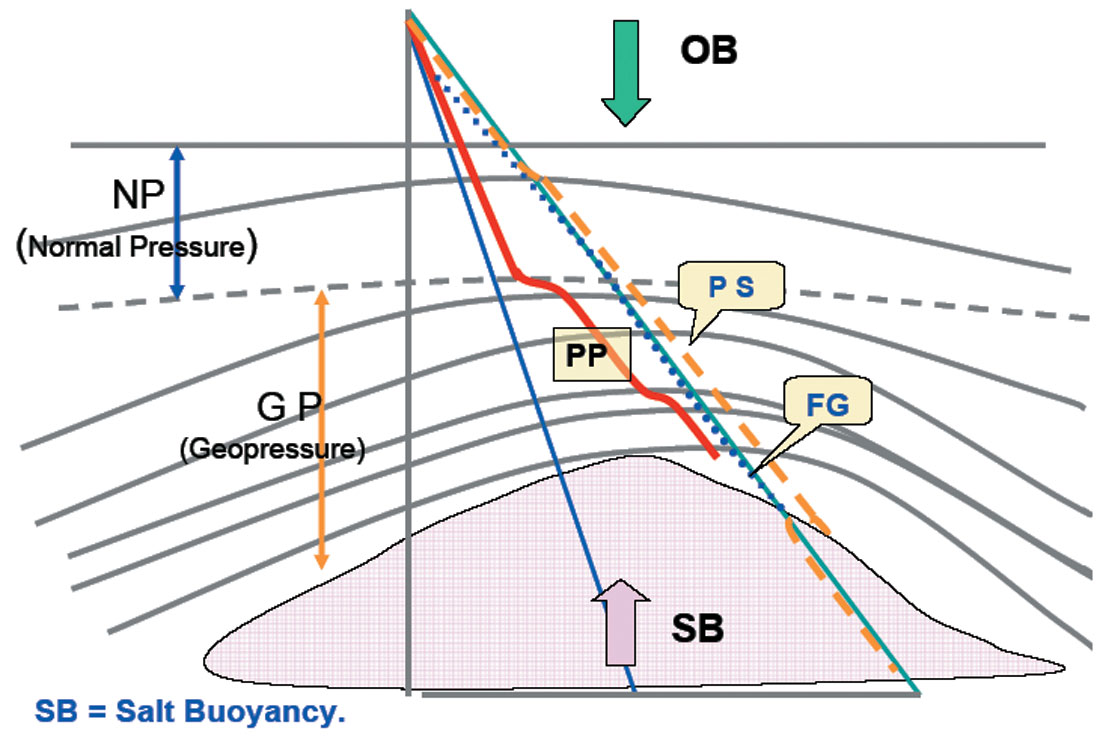
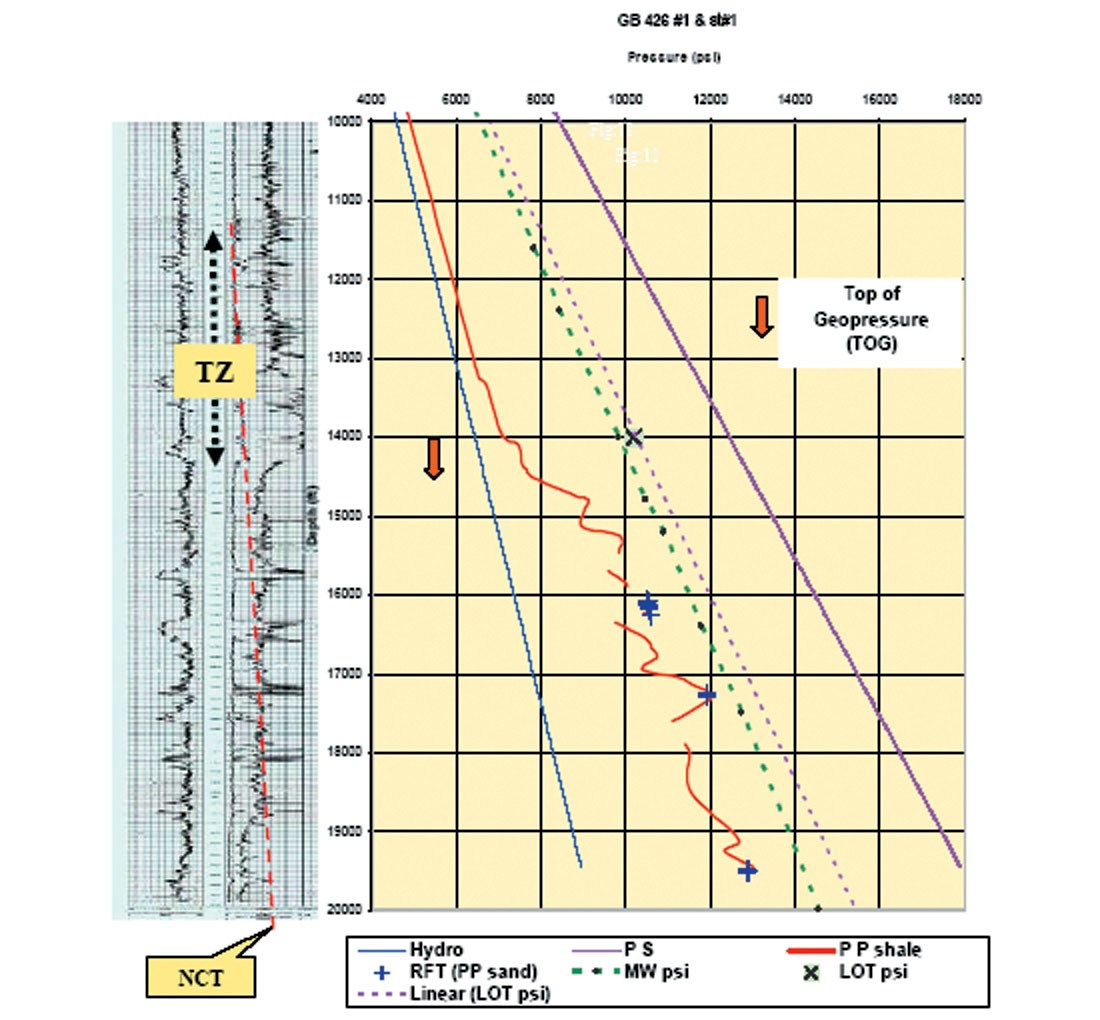
Auger field (Garden Banks 426, 427, 470 and 471) has been chosen as a case history. The Auger dome (Fig. 9) created a structural trap within the ponded facies assemblage (Prather et al., 1998). Differential compaction of sediments and the adjacent salt created a salt-cored structural high. The PP geopressure model (Fig. 10) shows the downward gravity overburden stress due to the weight of the sediments (OB) in addition to the upward stress field created by the salt buoyancy and/or the diapiric force. This creates a total vertical principal stress expected to be higher than the assumed OB. As a result, NCT shows high gradient associated with short transition zone between 11,500 and 14,000 feet (Fig.11). Pore pressure shows a strong pressure ramp (about 2000 psi) below the TOG. As a result, high sealing capacity in the geopressured section of this structural feature led to the prolific producing zones in the Auger Field.
The predicted pore pressure profile in GB 426 Well #1 was calculated using the resistivity to determine the effective stress – pore pressure transformation model in the shale beds. Measured pore pressure in the sand beds was plotted from RFTs tests (Fig. 11). Note compartmentalization settings and entrapment sealing capabilities concurred with the predicted and measured PP.
2. Salt withdrawal basins
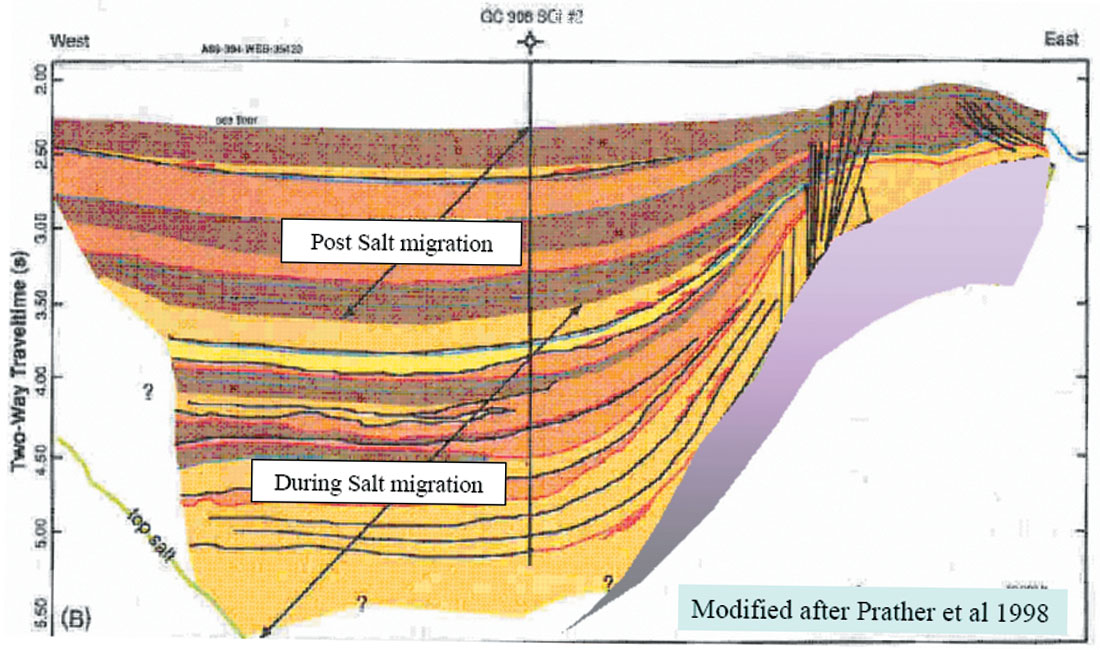
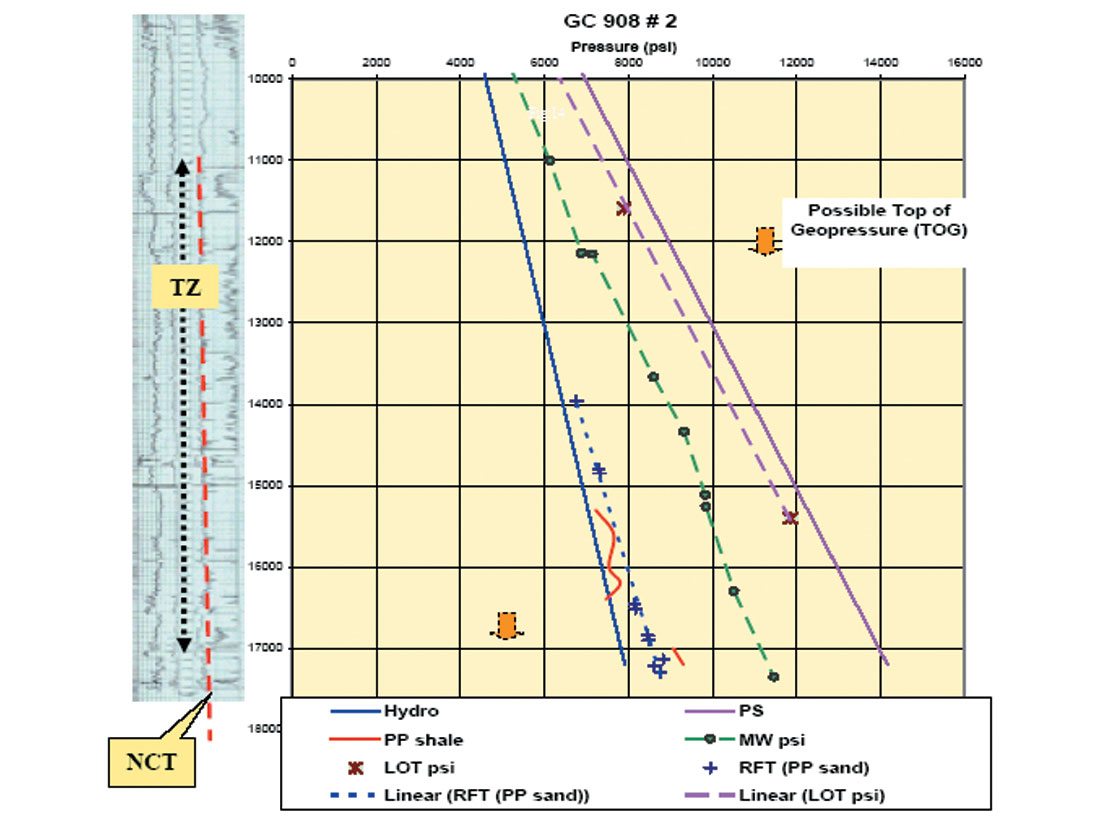
Hydrocarbon entrapment in a basinal structure setting is usually associated with pinch out on its flank and fault traps. In the case of Green Canyon Block 908 Well #2, the well was targeting an amplitude anomaly at the flank of this mini-basin (Fig. 12). Withdrawal of the salt base from west to east created the GC 908mini-basin in the west and a salt ridge to the east. An expanded section was deposited in the basin as a result of salt giving way to deposit influx and consequently retarded the principal vertical stress. The geopressure model (Fig. 13) sheds light on the possible low pressure profile gradient and the slow development of the transition zone and long NCT due to salt withdrawal.
Geopressure analysis was conducted on this well using resistivity to predict PP in the shale and the measured RFT’s in sand beds. This analysis showed a possible weak TOG at 17,300 feet, as indicated by minor pressure transgression. Meanwhile, the measured pressure in the sands between 14,850 and 17,294 feet shows a linear trend. The gradient of this trend is slightly higher than the regional Gulf of Mexico (GoM) hydrostatic gradient (0.465 psi/ft) and it might represent a typical transition Zone (TZ) gradient. Noteworthy, salinity of the formation water in salt basins is slightly higher than the salinity of the open water and it might have contributed to the increase of the linear slope on the RFT data (Fig. 14). NCT has a very gentle slope and thick TZ interval which exceeds 10,000 feet. Pore pressure build up is very slow and compartmentalization – sealing capacity is very weak. Therefore, this well was deemed as P&A.
Noteworthy, the calibrated models and exponents used in the above mentioned two cases are specifically designed to predict pore pressure in the GoM upper Tertiary-Quaternary mini-salt basins cases.
Data source acquisition and quality
Before drilling, predicting pore pressure is a challenging endeavor. Seismic interval velocity extracted from RMS velocity is widely used for this purpose. Velocity picks from NMO (normal move out) gathers should be checked against semblance for quality control. Sequence stratigraphy can help in picking the shale velocity intervals. During drilling, a bundle of data becomes available for PP prediction, measurements and calibration. LWD, MWD, conventional logs, mud log, direct PP measurements in the sand (RFT, MDT, DFT, FPWD) and engineering drilling records are used to establish the subsurface geopressure profile to reach the target objective in a safe and economically feasible manner.
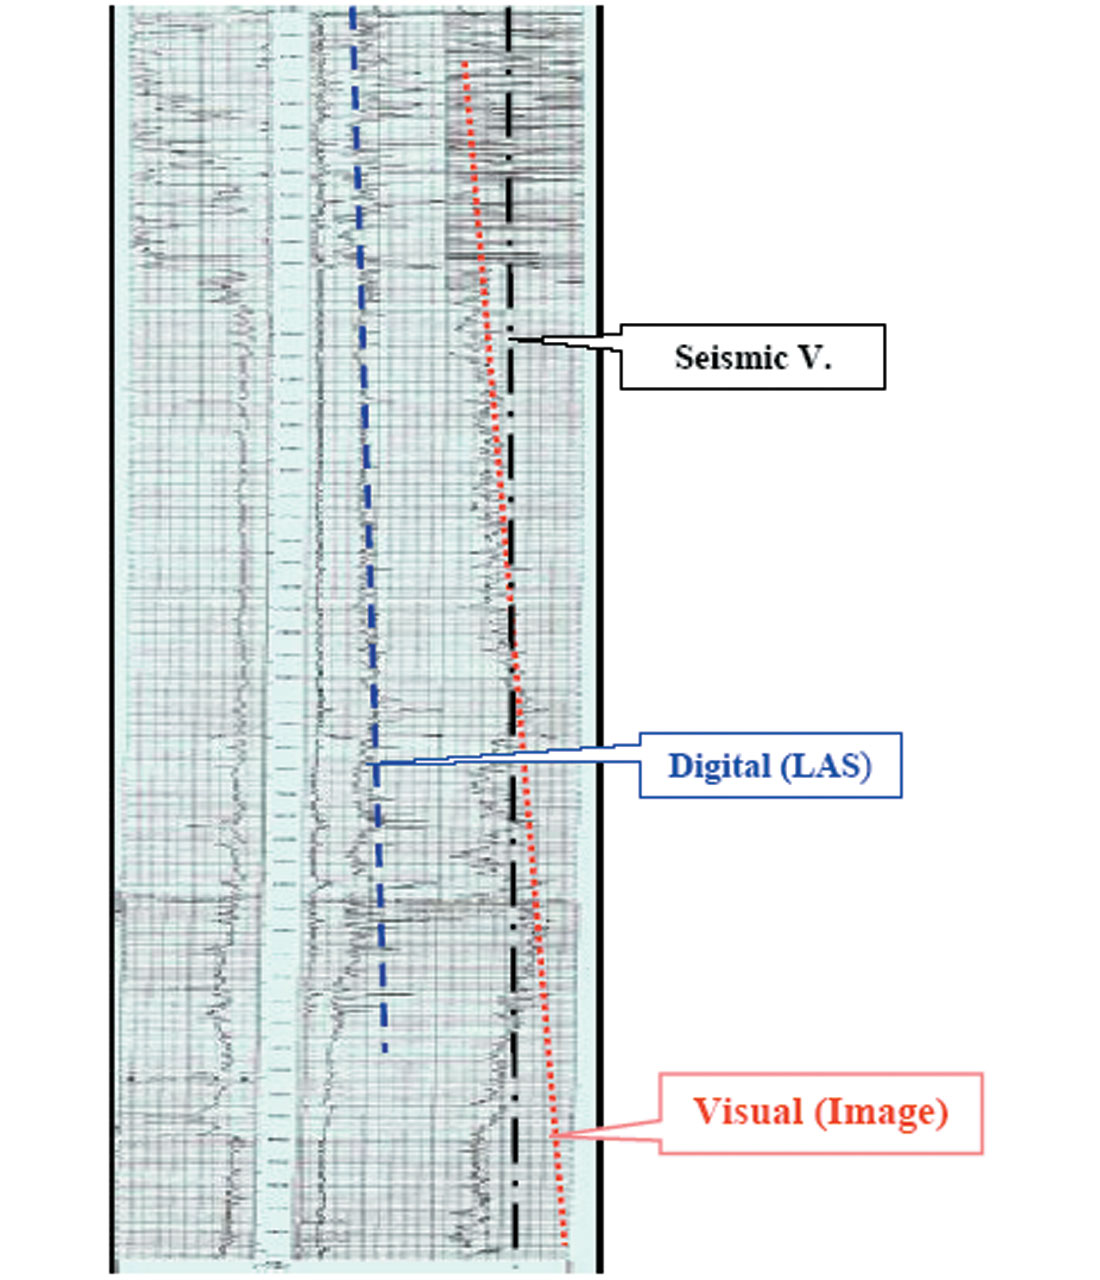
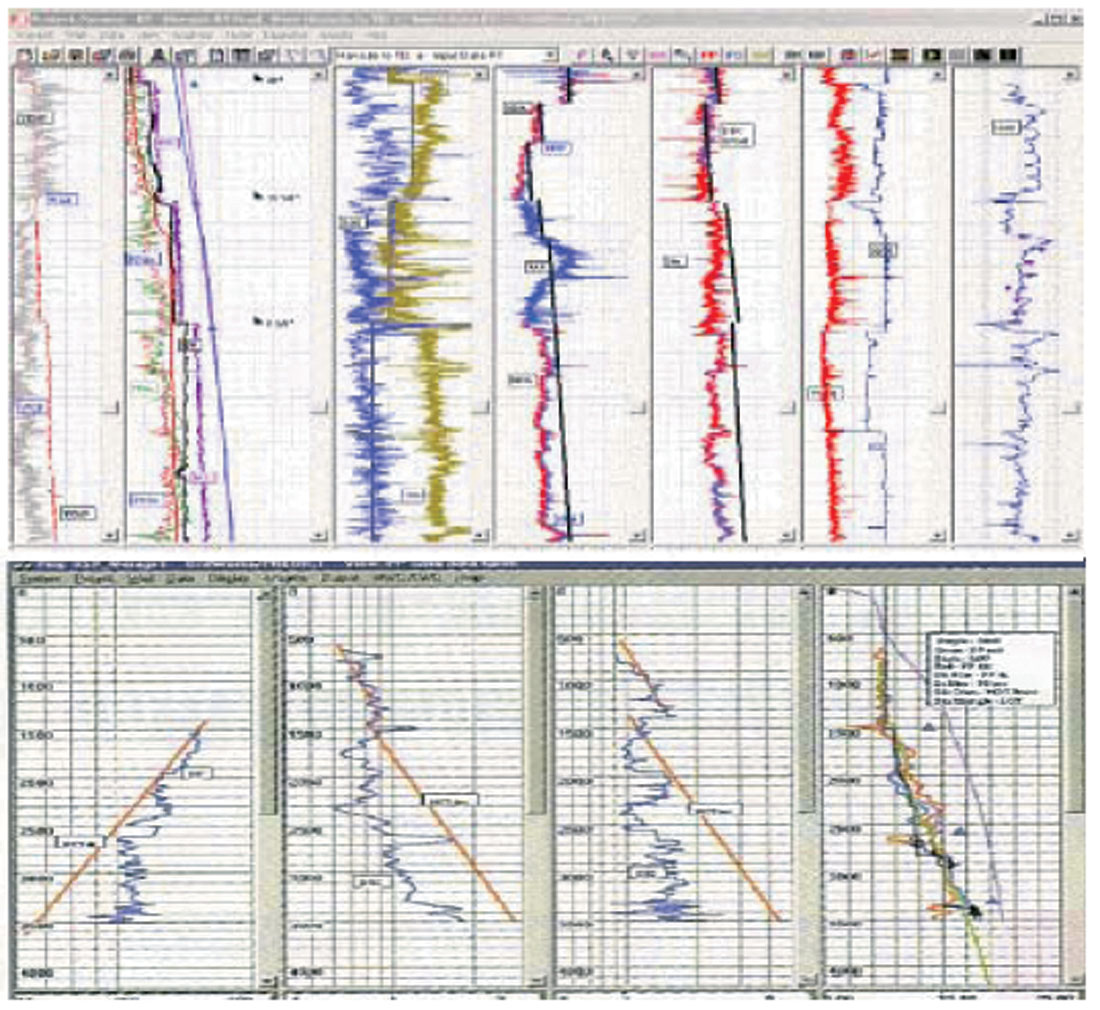
Establishing the slope on the NCT and defining the TOG at a specific location can be varied from one data set to another (Fig. 15). Using seismic velocity is usually limited to acoustic impedance difference picks. In case of well logs, the digital data alone does not distinguish between the changes in values due to the CDD or TOG. Visual plotting incorporated with digital data is favorable for assigning the NCT slope and the TOG depth.
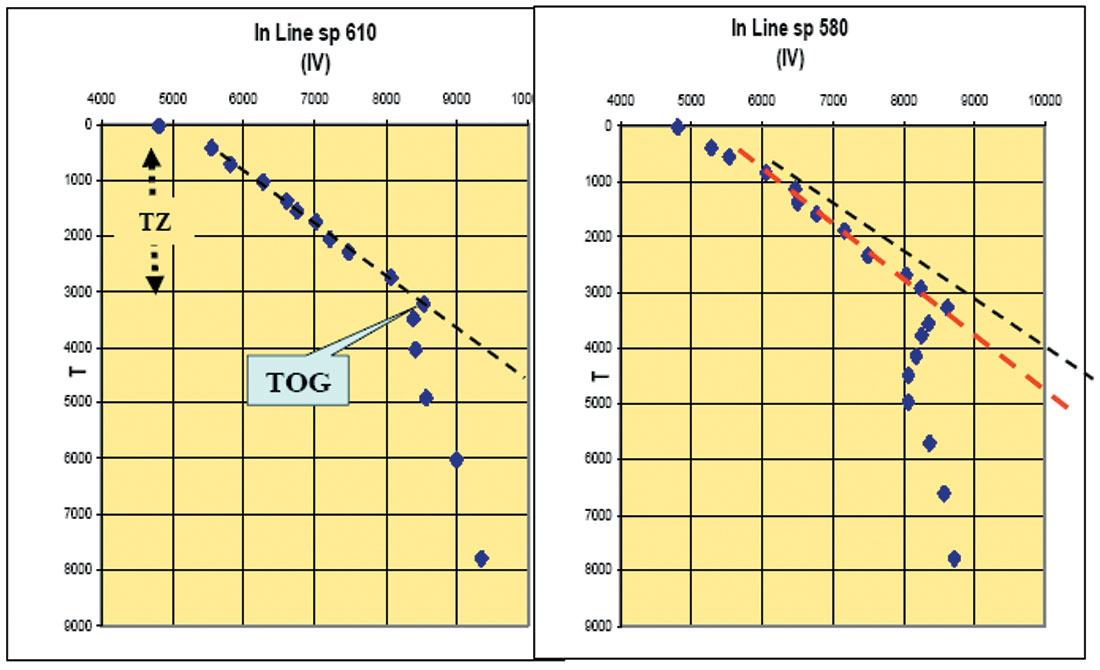
In case of large volume seismic velocity (3D), NCT can not be generalized in an area (i.e. common NCT). Figure 16 shows the discrepancy of NCT slope between two nearby interval velocities. These RMS velocities were extracted from two gathers half a mile apart. SP 610 is on a structurally higher position than SP 580 and consequently SP 610 has a higher NCT gradient than SP 580.
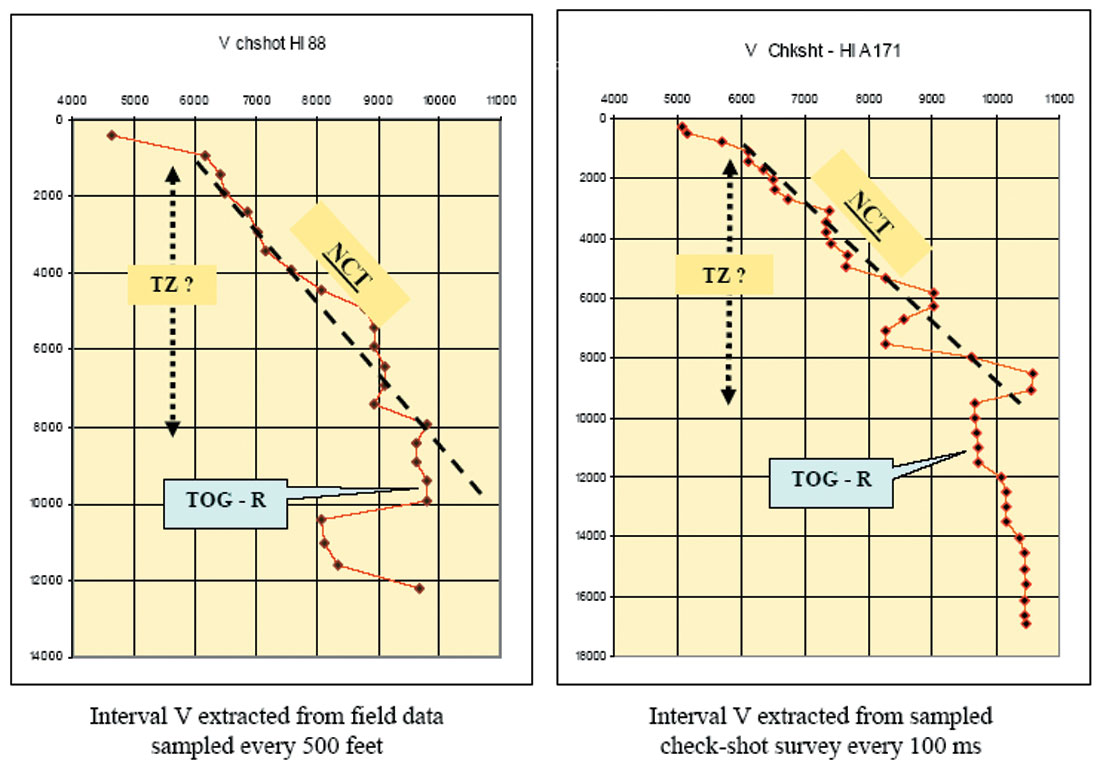
Check shot surveys are not favorable for pore pressure prediction if they are used as they were acquired. They are mostly shot for the purpose of time-depth conversion, horizons mapping, and synthetic calibration. A check-shot survey is usually sampled at equal depth without regard to lithology and consequently, acoustic impedance. This is contrary to velocity picks extracted from seismic. Figure 17 shows two interval velocities extracted from check shot surveys of High Island Block 88 Well #1 and High Island Block 171-A Well #1. The first one was sampled every 500 feet and the second one every 100 µs. Notice on both of them NCT and the TZ are not well defined. TOG was established from resistivity (TOG-R), mud log and drilling records at depths 9800 and 11,200 feet, consecutively. The defined NTC/TOG from the two check-shot velocity surveys is not in agreement with the TOG-R on both surveys. Special processing of velocity from check-shot surveys can improve PP prediction (Sayers et al. 2005).
Dividing NCT into multiple segments
Breaking the NCT into selective segments to fit the predicted pore pressure with the drilling records and the measured pressure data during and post drilling is another interpretation pitfall. This leads to an artificial monitor of the ΔTn/ΔTo values for the purpose of calibration and compromises the effective stress transformation model (Fig.18).
Conclusion
Defining the NCT slope and extent from the petrophysical measurement (velocity, density, and resistivity) is the backbone of the effective stress-pore pressure transformation procedure. They represent the subsurface interval where the dewatering process takes place between the free flow percolating shallow section and the fluid retention depth (TOG). Transition Zone (TZ) is the arbitrary physical description for this interval in this article.
Velocity, density and resistivity increase in correspondence with the water expulsion rate in this zone. The Normal Compaction Trend (NCT) represents the optimum fitted linear trend of these measured data in the low permeable beds in TZ.
Subsurface stratigraphy and structural settings directly impact NCT slope and confinement. In inner shelf paleo-environment and basinal structural settings where course sediments dominate, NCT shows a gentle slope and a long TZ interval. On the other hand, high gradient NCT slope and short TZ interval characterize the subsurface profile in middle-outer shelf environments associated with high structures such as shale ridges, salt diapers and domes.
Data acquisition, processing and quality affect NCT slope and PP prediction results. Therefore, choosing the adequate petrophysical measurements from seismic, well logs and check-shot surveys is essential for PP analysis. Well logs images in collaboration with digital images are very helpful in establishing NCT slope and extent.
Sway, tampering and breaking the NCT into multiple segments for the purpose of calibrating the predicted PP can lead to serious pitfalls in pressure modeling results. Pore pressure prediction is a function of geological setting rather than data manipulation.


Join the Conversation
Interested in starting, or contributing to a conversation about an article or issue of the RECORDER? Join our CSEG LinkedIn Group.
Share This Article