INTRODUCTION
The use of Remote Sensing tools in the oil industry, especially in the current economic downturn, is hampered by a lack of detailed knowledge of the technology. There are few Remote Sensing specialists employed in the oil patch because the industry focuses on all-round explorationists instead of specialists. Also, there have been few exploration successes clearly attributed to the use of Remote Sensing. This has caused many companies to downplay the use of Remote Sensing and to ignore the potential of this technology for many aspects of the exploration effort.
Selecting the proper remote sensing tool for any hydrocarbon exploration project has also become extremely confusing. Not only does the explorationist have to deal with the variety of remote sensing tools, their characteristics, potential applications, output formats and cost differences, (s)he also has to take into account the variety of exploration tasks/requirements, altitude variations, latitude, and terrain characteristics (from deserts to tropical rain forests). Many explorationists therefore rely on consultants for all aspects of remote sensing in the exploration effort.
In order to bring the technology back as a standard tool for exploration, it has to be presented in a simplified format. Therefore, a decision tree was created which addresses most of the concerns an explorationist may have and which deals with only the most basic tools of Remote Sening (Dekker and Dams, 1991, 1992). The DEAR DAD model provide an easy method to determine the most useful and cost effective remote sensing tool for any hydrocarbon exploration project. It allows the explorationist to be actively involved in the decision making process without spending a large amount of time investigating the technology. The model also provides the possibility to stage the remote sensing investigation in several phases-from low cost, coarse, regional studies to high cost, detailed, local studies.
THE DECISION TREE
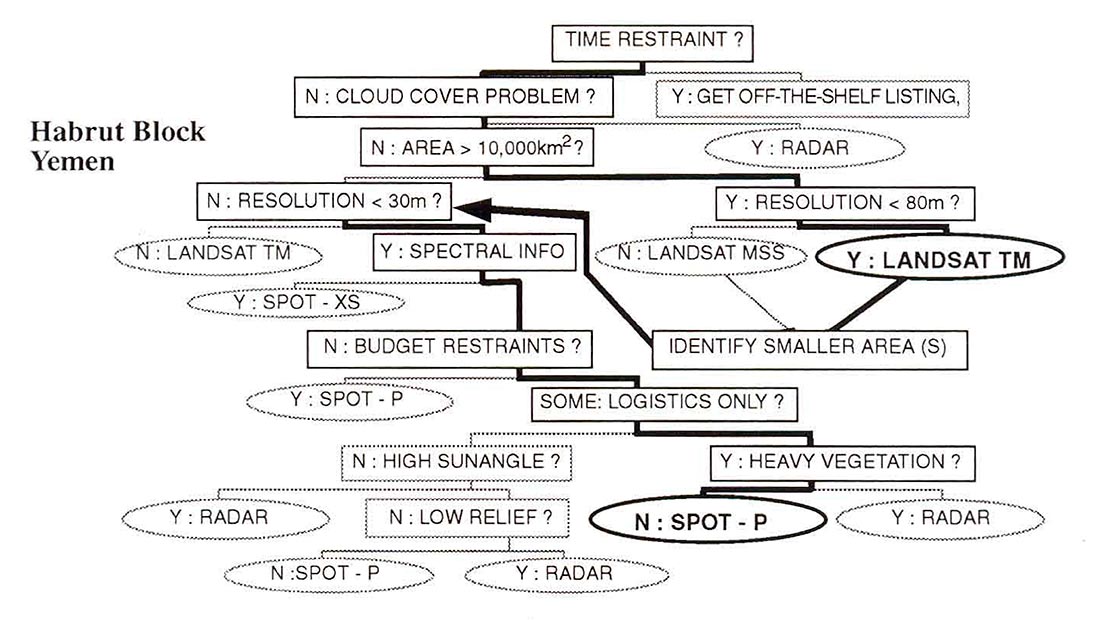
The “Decision Tree for Exploration Applications of Remote Sensing by Dekker And Dams”, or DEAR DAD (Figure 1), focuses on the basic usage of remote sensing in the exploration industry. It ignores sophisticated applications and concentrates on practical, multipurpose products. Not only does the explorationist examine the imagery for oil and gas potential, (s)he also uses it to find the best route in and out of a remote or dangerous area; to distinguish between lithologies; to plan for seismic and drilling operations; to investigate the environmental impact and to position production facilities. The imagery can therefore be used from the inital stages of exploration evaluation through to the final stage of production.
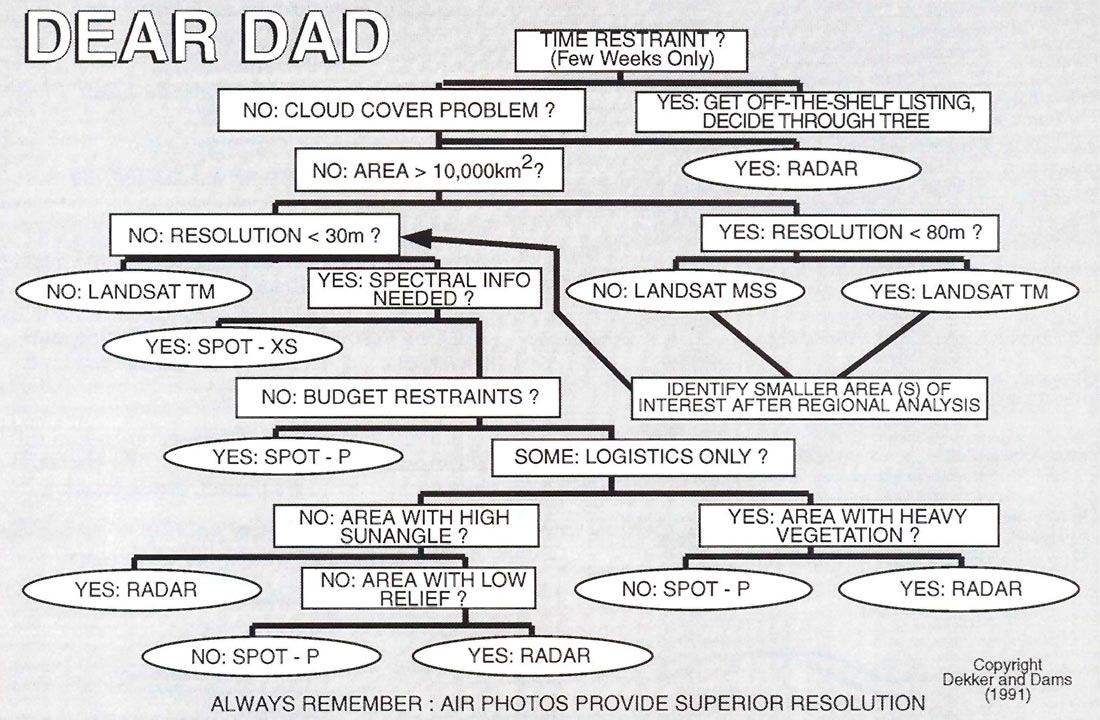
The tools used in the Decision Tree are: - Landsat MultiSpectral Scanner (Landsat MSS) and Thematic Mapper (Landsat TM); - SPOT MultiSpectral Scanner (SPOT-XS) and Panchromatic (SPOT-P); and, - Airborne Radar (Radar) no distinction is made here between high resolution (6 meter pixel, narrow swath) or standard resolution (12 meter pixel, wide swath).
Both SPOT and Radar are available in stereo mode.
In Figure 1, the questions are shown in rectangular boxes, the remote sensing tools in ellipses. The “yes” and “no” statements always refer to the previous question. The questions to be asked and decisions to be made are subdivided as follows (Figure 1):
DO WE HAVE A TIME RESTRAINT?
Satellite imagery cannot usually be obtained from the satellite company within a few weeks. One is therefore forced to take whatever is available off-the-shelf when the lead time is less than 6-8 weeks. If a variety of imagery products is available, the user can select the best product by using this decision tree.
IS THERE A CLOUD COVER PROBLEM IN THE PROJECT AREA?
Passive sensors like Landsat and SPOT cannot “see” through cloud cover since they depend on naturally reflected or radiated energy. Only an active sensor like radar, which emits a signal and records its reflection, can penetrate cloud cover. A break-down of the various radar options can be built into this decision tree when more information becomes available on ERS-l, the European radar satellite launched last year, and RadarSat, the Canadian radar satellite due for launch early in 1995.
IS THE PROJECT AREA LARGER THAN 10,000 KM2?
Satellite imagery can be very expensive. Digital data can vary in km2 price from a few cents for Landsat MSS to more than 10 times that amount for SPOT-Panchromatic. Some SPOT film and print products are almost 100 times more expensive than Landsat MSS. Airborne radar is even more expensive. This means that for larger areas, where a regional analysis is required, the user should focus on the cheaper Landsat products.
DO WE NEED RESOLUTION BETTER THAN 80 M?
The major distinction between the two Landsat tools at this stage of the decision making process is the resolution, with the smaller 30 meter pixel for the more expensive and versatile Landsat TM and the coarser 80 meter pixel for the cheaper, less flexible MSS. For large areas, MSS is often an excellent solution when the focus is on regional understanding.
Once the regional analysis is completed, the user may want to identify smaller areas of interest, where more detailed studies can be performed with more expensive tools. This is often the stage where the geophysicist comes in to plan the seismic acquisition program. The staged approach, with cheaper tools for the large regional analysis and more expensive tools for the smaller areas of interest, reduces the total project cost significantly.
DO WE NOW NEED RESOLUTION BETTER THAN 30 M?
With the area of interest reduced to less than 10,000 km2, a higher resolution can be considered in a cost effective way. If a pixel size of less than 30 meters is required, current Landsat data will no longer suffice. Early in 1993, however, the Landsat 6 satellite, with a 15 meter resolution panchromatic band, will be launched. For most geophysical planning purposes, resolution better than 30 meters will be required.
IS SPECTRAL INFORMATION NEEDED?
SPOT-XS is the only tool that provides this option in high resolution mode (20 meter pixel). It is crucial for high resolution lithology identification and environmental damage assessment. If you want to use the imagery for more than geophysical acquisition purposes, you should consider this option.
DO WE HAVE BUDGET CONSTRAINTS?
In the current fiscal climate, every user has at least some budget constraints. Where more money is available, expensive airborne radar can be considered; otherwise the user has to select SPOT Panchromatic with a 10 meter pixel size. In the future, this part of the tree may be changed when cheaper ERS-I and RadarSat radar data are generally available.
ARE WE INTERESTED IN LOGISTICS ONLY?
If structural geological information is not an issue, and logistics is the only concern, the amount of vegetation determines what tool to use.
IS THE PROJECT AREA HEAVILY VEGETATED?
In heavily vegetated areas, like tropical rain forests, the low artificial sun angle of the radar tool, especially when viewed in stereo mode, can provide an excellent picture. SPOT-P is better suited for barren areas, although SPOT stereo pairs could be considered.
If structural geological information has to be obtained from the data set, as well as logistics, the user has to deal with the following questions.
ARE WE OPERATING IN AN AREA WITH HIGH SUN ANGLE?
In areas with a high sun angle, near the equator, structural relief will be obscured by the lack of shadowing. An artificial low sun angle, as provided by radar, will significantly increase the visibility of structure. In areas like Canada, sun angle is not a problem and the user still has choices.
ARE WE OPERATING IN AN AREA WITH LOW RELIEF?
Away from the equator, high relief, as in the Rocky Mountains, will be easily recognizable on SPOT-P, especially when stereo pairs are studied. Where the relief is subtle, however, like parts of the foothills east of the Rockies, the artificial low sun angle of the radar tool will amplify the structural information.
As mentioned at the bottom of the decision tree: always remember-air photos provide superior resolution. The old life-saver of the seismic crews and the field geologists will always provide a superior resolution relative to any of the tools mentioned above. The regional overview, however, is lost and digital processing and enhancements are not easily accomplished. Also, air photos may not be available and airplane access over many areas in the world is restricted; satellites cannot be stopped by local governments!
CASE HISTORIES
Eastern Papuan Foldbelt - Papua New Guinea (Dekker et aI., 1989)
In Papua, explorationists had to resolve subtle structural complexities in 5,600 km2 of tropical rain forest area where outcrops are very limited. The exploration block stretched from the Coral Sea in the south, to the highlands in the north and east. A drilling decision had to be made within a year. Field parties were expensive in this type of terrain because time efficient access is by helicopter only, by boat it would take years to map the area. Seismic information was absent and extremely expensive to shoot.
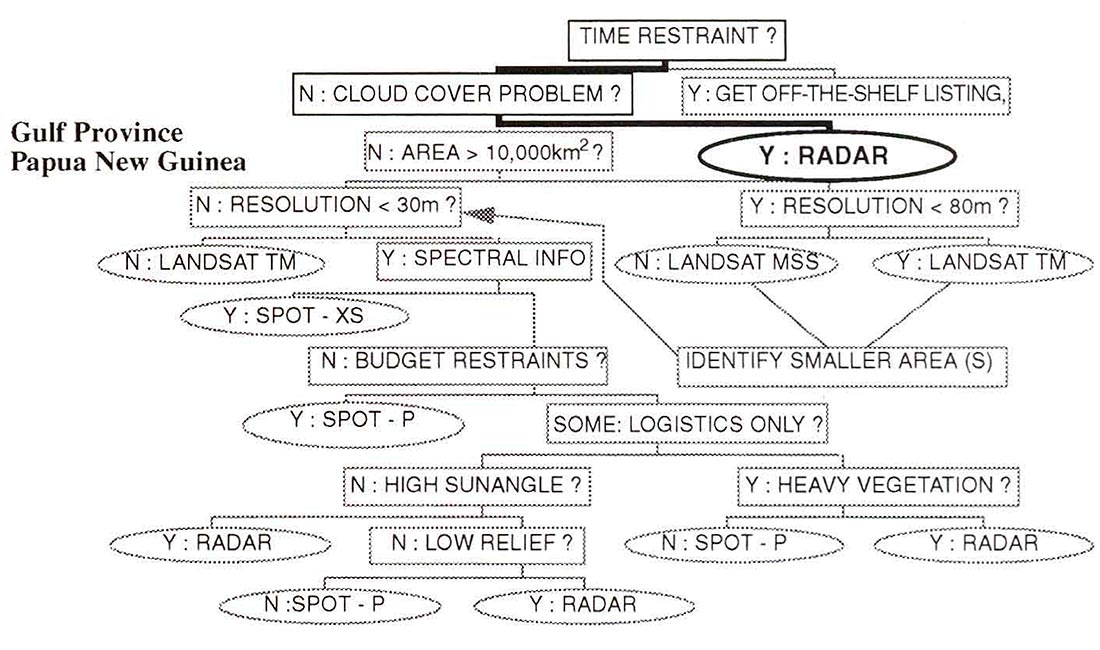
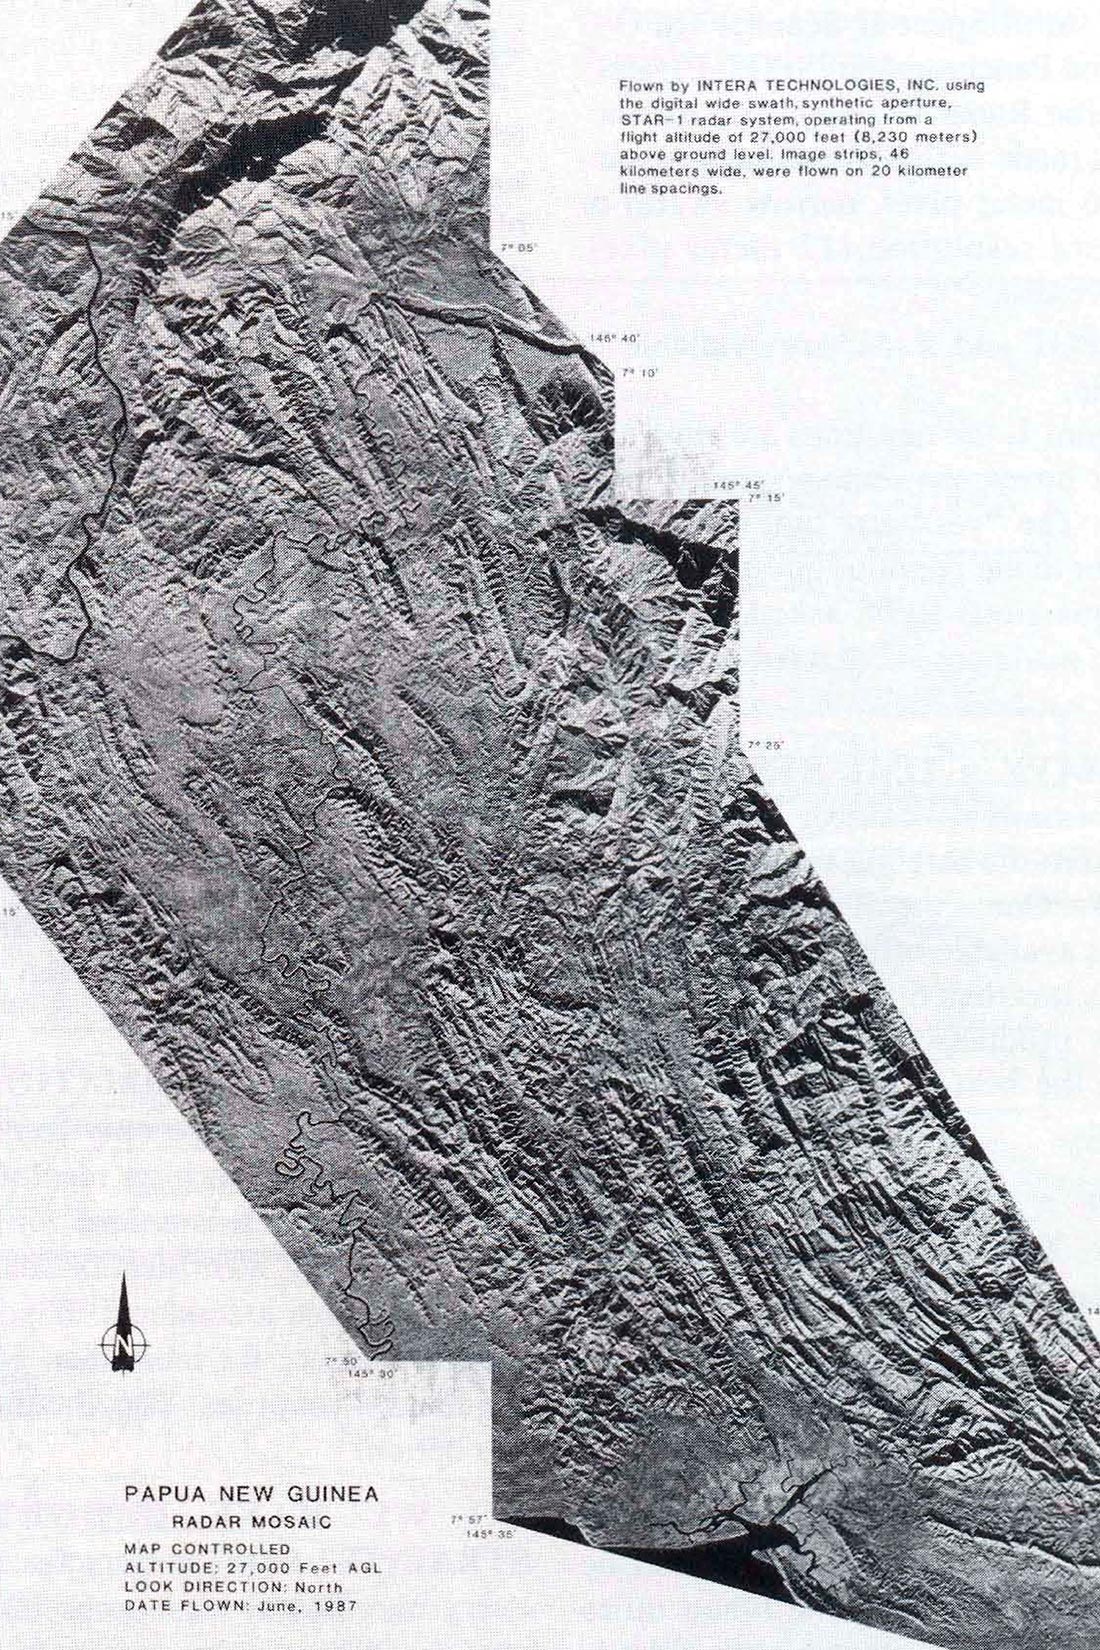

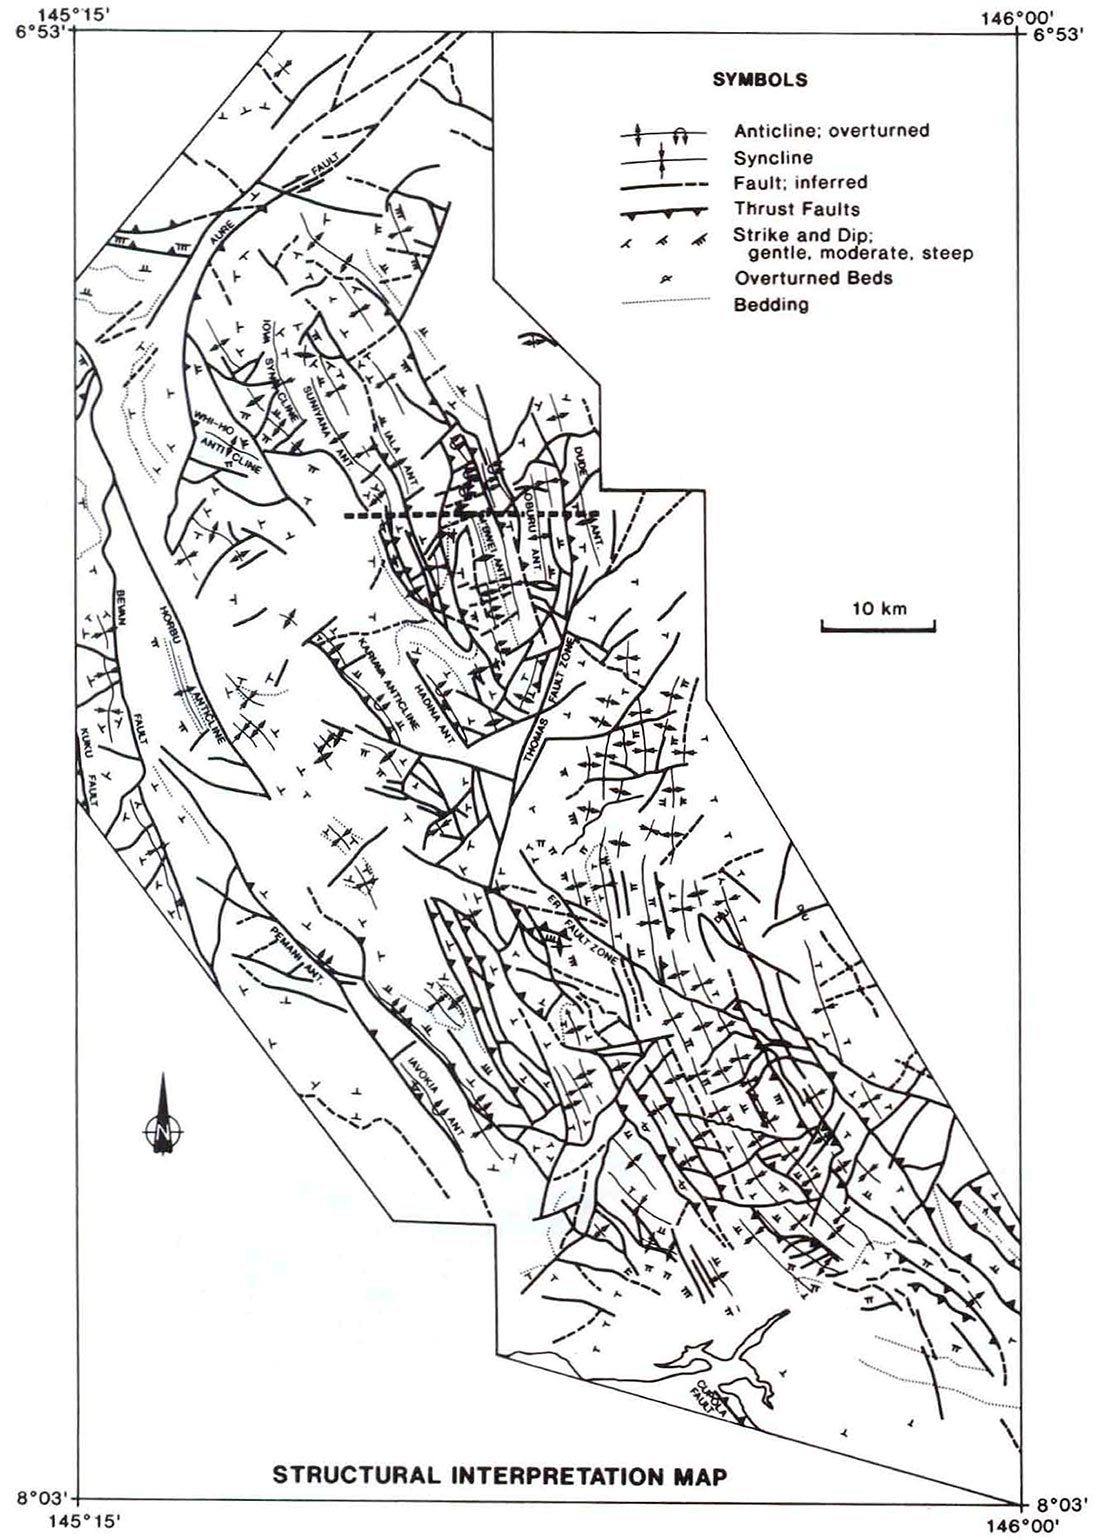
The solution consisted of a regional, structural and stratigraphic interpretation from remote sensing imagery followed by spot checking in the field to test the model. The Decision Tree (Figure 2) leads immediately to radar (Figure 3) since cloud cover is the major problem in tropical rain forest areas (Figure 4). Stereoscopic airborne radar at 1:250,000 to 1:100,000 scale proved to be an excellent tool for the structural mapping (Figure 5). A new model was developed for the region and this was confirmed in the field using 1:40,000 scale photographic prints from the radar imagery, since standard air photos were hampered by cloud cover, haze and high sun angle. Field time was limited to two weeks.
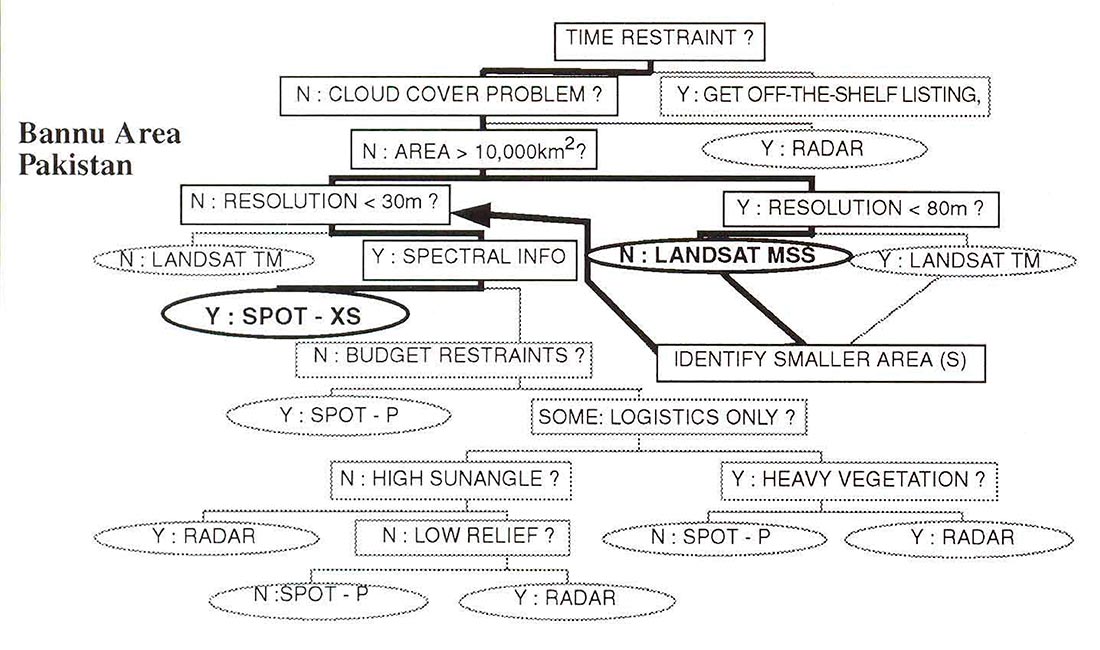
Bannu Area - Northwest Pakistan
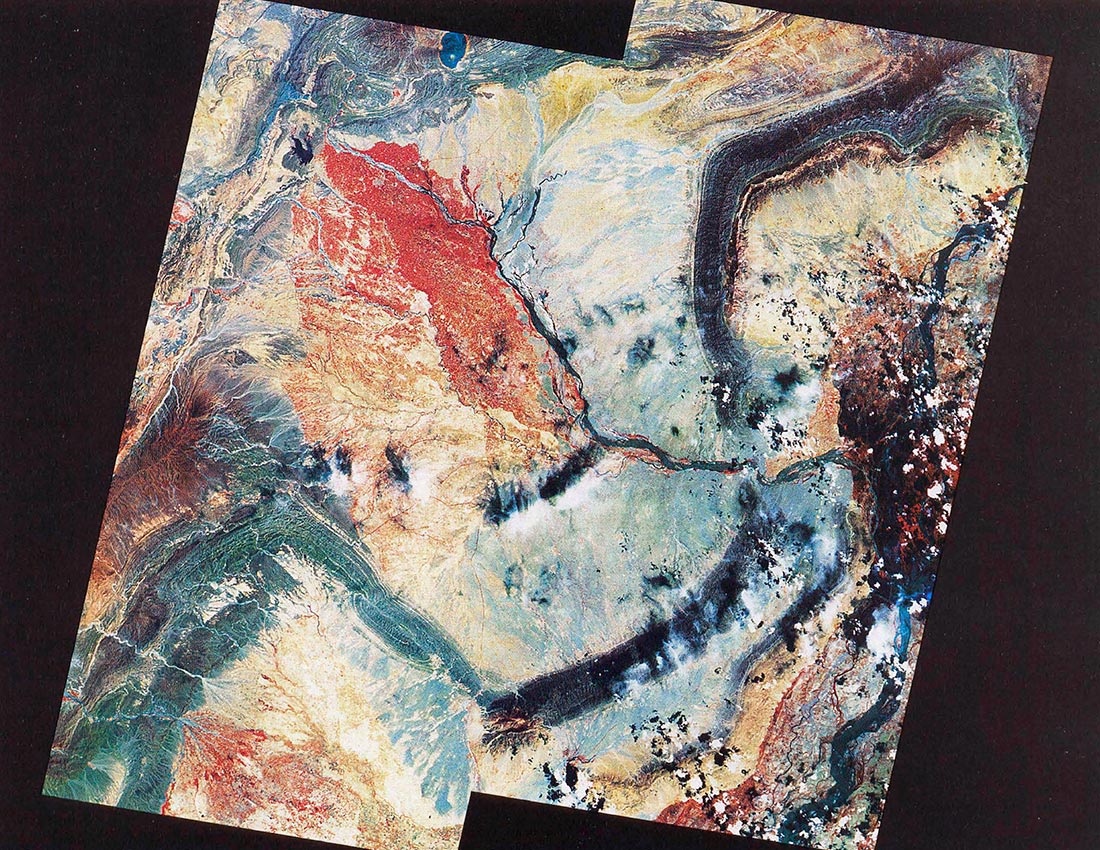
The Bannu area is located between the Salt Range in the east and the Afghan border in the west. A concession was located in the Bannu depression. The explorationist’s job was to resolve the regional structural framework over tens of thousands of km2 of Himalayan foothills and construct a detailed geological model for a 5,000 km2 exploration block in a semi-desert to mountainous area. Field parties were expensive and risky in this border area with Afghanistan since the war was still ongoing and every man was armed. Field time, therefore, had to be kept to a minimum. All topographic and geological maps were old. For the Bannu area, the exploration team decided on a regional interpretation from remote sensing data and a series of cross-sections in the field to sample, measure and define the geological units. The Decision Tree (Figure 6) leads through the “no cloud cover”, and “large area” fields to the “coarse resolution” of Landsat MSS for low cost, multi-image regional analysis. This is followed by a “detailed study of the smaller exploration block” with the “highest possible resolution” and “spectral data” because both structure and lithology had to be mapped in detail. SPOT MultiSpectral Scanner data was mosaiced to cover the area (Figure 7) and detailed 1:50,000 scale maps with a UTM grid were produced as field maps. The whole area was checked in detail in the field in three weeks, and a complete structural-stratigraphic model was obtained.
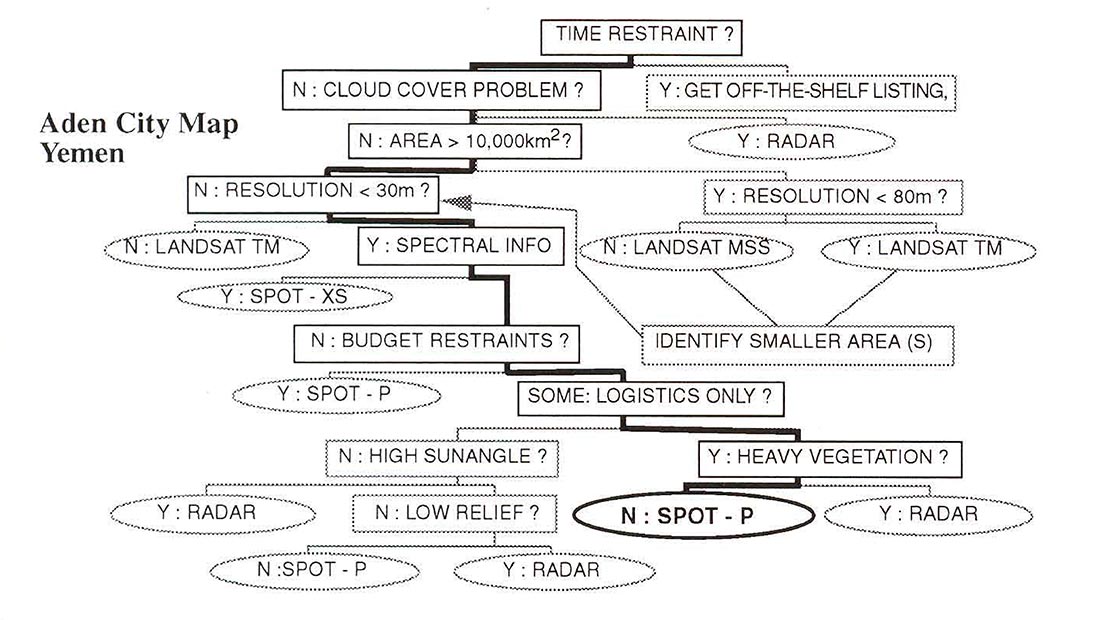
Aden City - Yemen
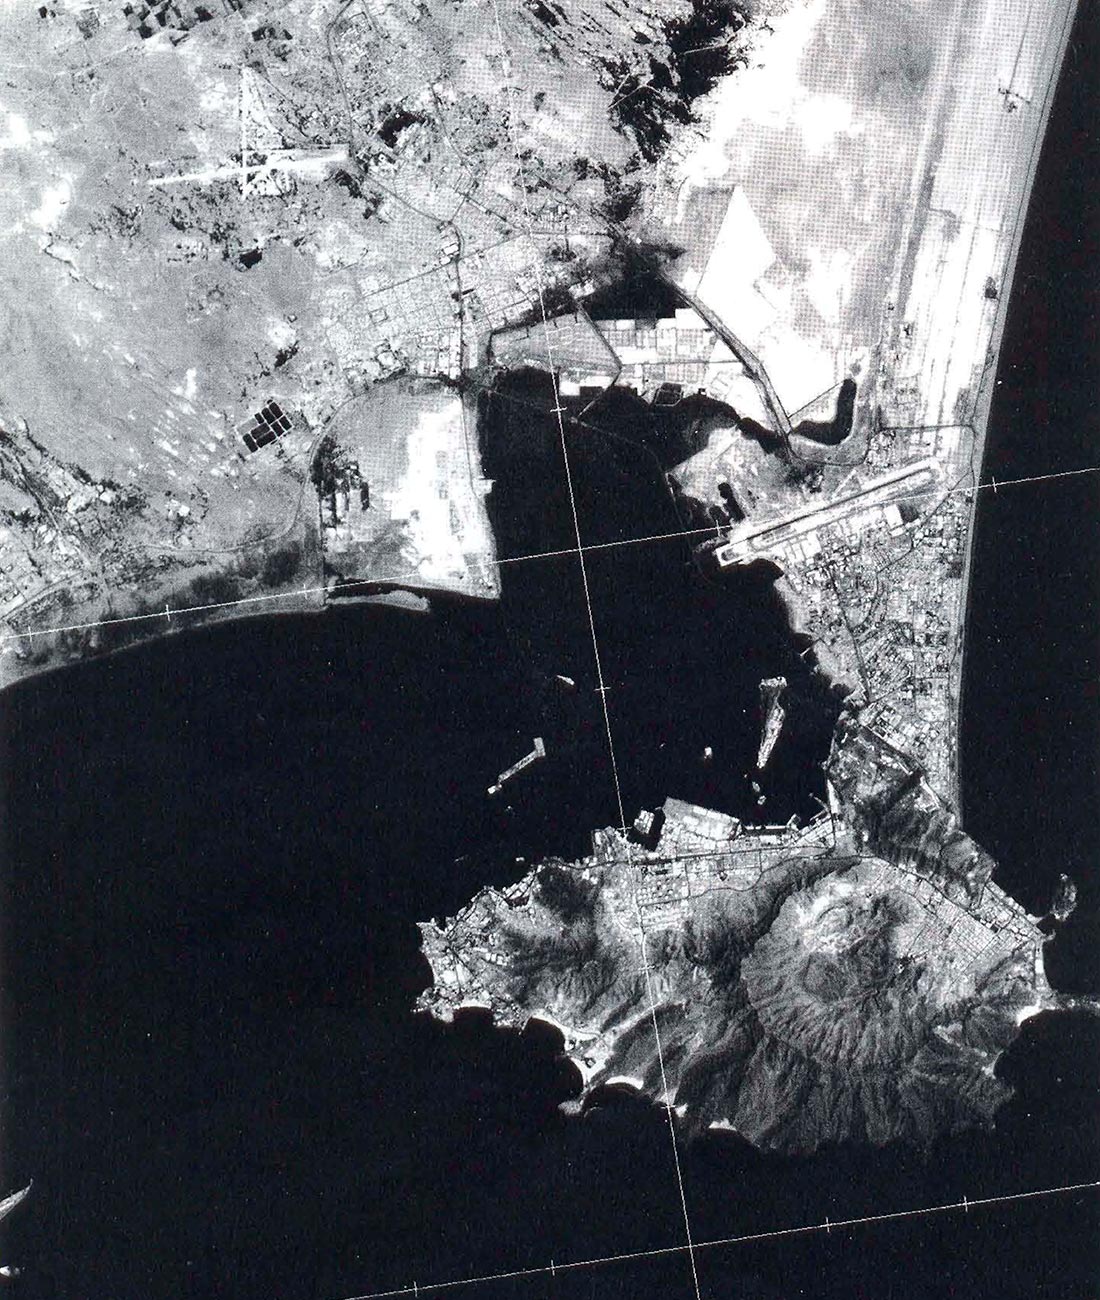
During the 1991 Middle East conflict, evacuation plans had to be prepared for company personnel stationed in Aden. A map was needed on which the airport, harbour, streets and main buildings could be identified. City maps or air photos were not available due to government regulations. There was an obvious need to find high resolution satellite imagery and produce a large scale map. Because planning started on time, there was “no time restraint” the company needed the “highest resolution” possible; “spectral information” was not necessary; safety was more important than “budget constraints”; “logistics” was the only purpose and there is no "heavy vegetation’ . So SPOT Panchromatic which, with 10 meter pixels, is the highest resolution satellite tool, was selected and 1:25,000 scale maps were produced (Figure 9). All the main landmarks were computer annotated on the maps. This provided an excellent emergency planning tool. It also illustrates that there is more to the exploration use of remote sensing than just geology or geophysical planning.
Habrut Block - Yemen
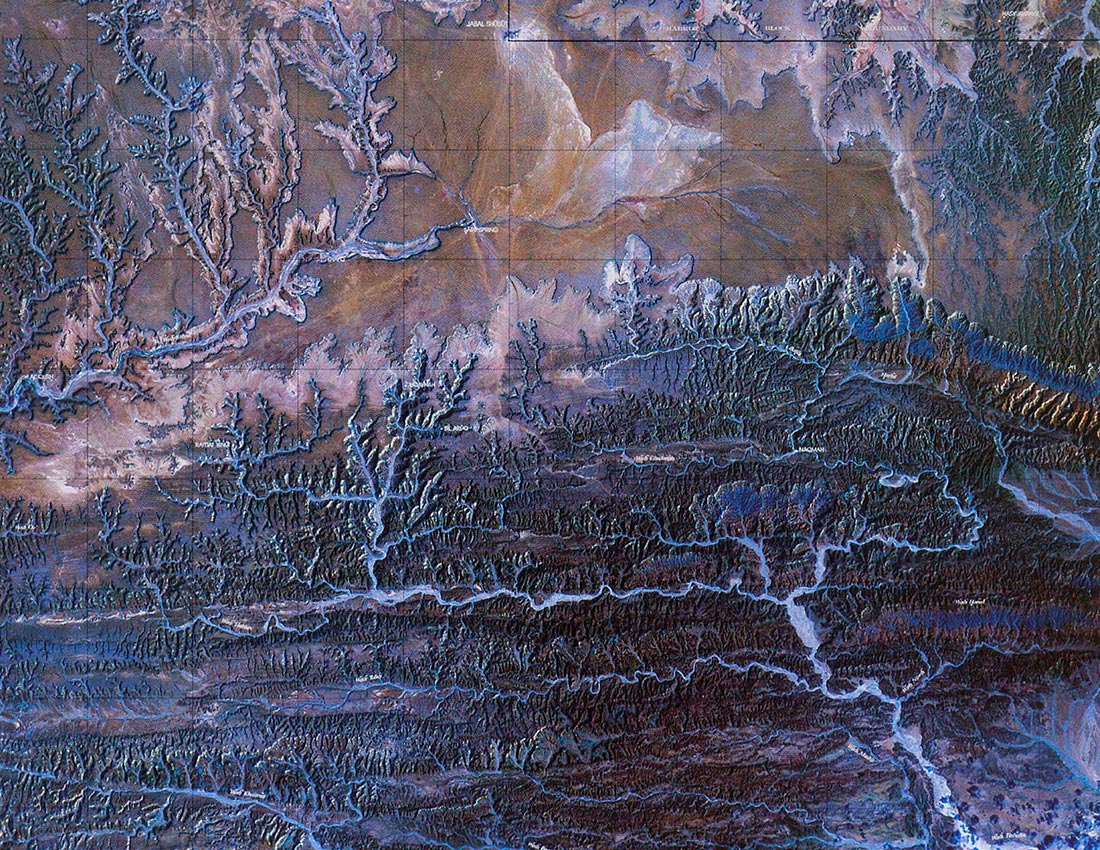
The Habrut exploration block is nestled in the northeast part of the country in the border area with Oman on the eastside and Saudi Arabia in the north. The challenge for the explorationists was to find the best access to the 10,000 km2 exploration block in the remote rock desert, check the 40 to 50 year geological maps, and survey the block for suitable routes for the seismic crew. The block is heavily dissected by deeply cut wadis which limits the visibility and orienteering ability for ground crews: every wadi looks the same as the next one and there are numerous bifurcations; this is also close to the hottest place on earth. There were no topographic maps available other than 1:500,000 scale pilot maps.
It was important to produce regional maps first and to find the best access routes from the coast some 150 km to the south. These maps would also be used to check the old geological maps. Later on, detailed maps were to be created for the exploration block itself to plan for the seismic acquisition and to allow the scouting and seismic crews to find their way around without getting lost in the myriad of wadis. This called for a staged approach: the Decision Tree (Figure 10) suggested Landsat TM for the regional maps, which were produced at I: 100,000 scale (Figure II). The high resolution allowed for the recognition of caravan trails in the rocky desert and for excellent structural mapping; the multispectral capability made it possible to map the lithologies: the distinction between evaporites (blue) and carbonates (brown) is very clear.
For the block itself (Figure 10), a “resolution of better than 30 m” was necessary; “spectral information” was already available from the Landsat TM; there were “some budget constraints”; it was for “logistics only” and there is “no heavy vegetation”. SPOT Panchromatic imagery was processed into 1:100,000 and 1:50,000 scale maps and the detail is incredible: individual bushes, no more than 2-3 meters high and wide, can be seen as separate items with this tool which circumvents the Earth at an elevation of about 830 kilometers! Cheap blue line copies of this black and white imagery were used by all crews during field operations.
DISCUSSION AND CONCLUSIONS
The “Decision Tree for Exploration Applications of Remote Sensing” proves to be a simple and effective guide for the selection of the most suitable and cost effective imagery for a wide variety of exploration situations. Remote Sensing has a lot to offer for many stages of the exploration effort and the same data set can be used by various groups at different stages of the program. Remote Sensing does not replace any of the more traditional exploration tools, rather it allows the explorationists to focus their efforts on the most promising parts of the exploration block, saving the company valuable exploration dollars by limiting field work, seismic acquisition and processing. More advanced products like merged data sets and Digital Terrain Models (DTMs) should be discussed with professionals.

Acknowledgements
The author would like to thank the management of Petro-Canada for permission to publish the contents of this paper. Earth Satellite Corporation provided quality prints for Figures 7 and 11. scale maps and the detail is incredible: individual bushes, no more than 2-3 meters high and wide, can be seen as separate items with this tool which circumvents the Earth at an elevation of about 830 kilometers! Cheap blue line copies of this black and white imagery were used by all crews during field operations.


Join the Conversation
Interested in starting, or contributing to a conversation about an article or issue of the RECORDER? Join our CSEG LinkedIn Group.
Share This Article