Introduction
3-D surface seismic data has many useful features that include fine sampling, better resolution, better and accurate visualization and volume interpretation of structural and stratigraphic features. All these help in providing a vivid picture of the geologic features in the subsurface. These characteristic qualities of 3D seismic data, coupled with the fact that 3-D prestack time or depth migration yield accurate imaging of subsurface features, represent sufficient ground and reason to expect AVO analysis to be carried out on 3-D data.
Figure 1 shows a generic AVO flow that is used on prestack data, especially for stratigraphic objectives. After the data has been put through an AVO friendly processing (that restores true amplitudes) supergathers (gathers generated by collecting traces from adjacent CMPs) and Ostrander gathers (gathers generated from supergathers by stacking traces with similar offset intervals) are generated. Next, AVO attribute pairs are extracted, such as Rp and Rs or intercept and gradient, etc.
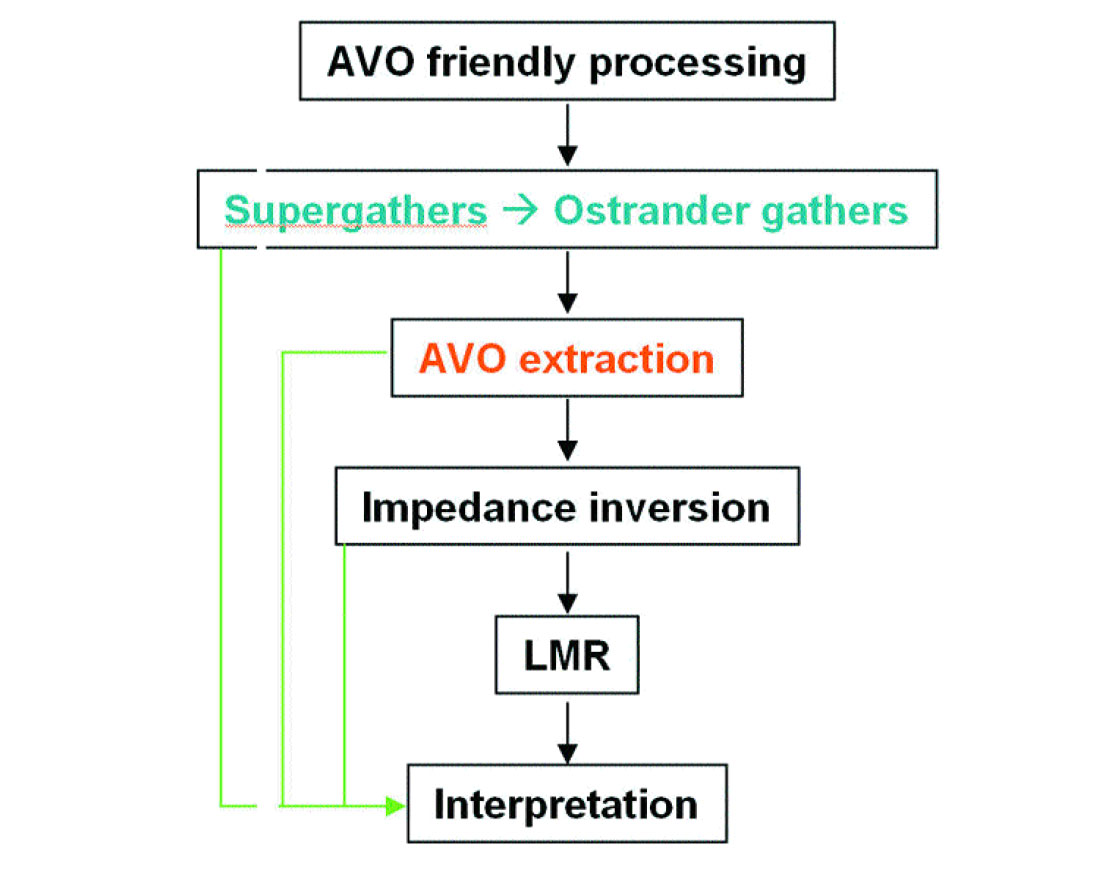
While interpretation can be directly carried out on the intercept and gradient attributes, Rp and Rs attributes are put through impedance inversion and extraction of LMR (Lambda-Mu-Rho) attributes which are then interpreted. Such a processing flow is followed for 2-D as well as 3-D datasets without differentiation though there are more traces in a 3-D dataset than a 2-D dataset.
However, there are many differences between the two. A comprehensive study was conducted at Arcis to investigate such differences and explore for ways to improve 3-D AVO analysis. The impact of the geometry of a 3D dataset is being reported in this paper.
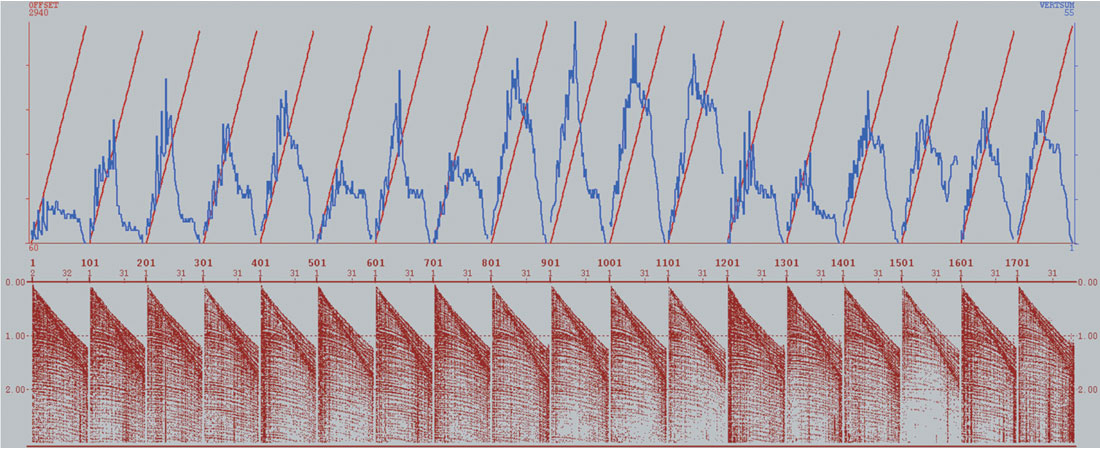
For 2-D surface seismic data, the fold and offset are usually found to have a one-to-one correlation. Unfortunately, this is not true for most 3-D seismic datasets. Figure 2 shows some gathers from a 3-D dataset, where the offset variation is shown in red and the fold variation in blue. One notices at a glance that for near and far offsets, the coverage is low and traces with intermediate offsets dominate the overall coverage in this set of gathers. It is advisable to try and understand the impact of such a variation of coverage with offset on the extraction of AVO attributes.
Investigation on synthetic data
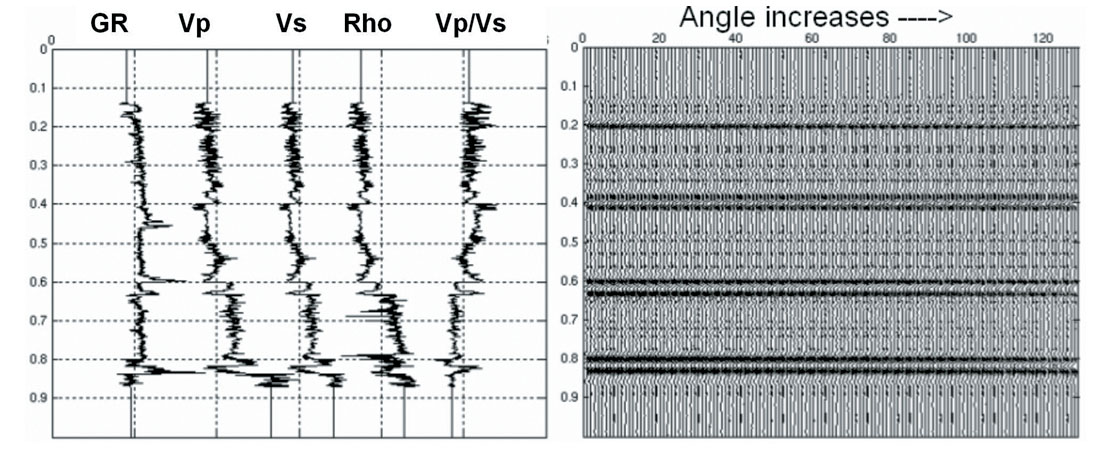
To investigate this, synthetic gathers were generated using log data as input. Figure 3 shows the log curves and an angle domain gather generated from them. Two gathers were generated with the same number of traces in each and 0-30 degree angle coverage , but their fold distributions were different, more like 3-D and 2-D and indicated as A and B and shown in Figure 4. Random noise was added to these two gathers. These gathers represent the supergathers in real seismic data, and so for convenience we refer to them as 3-D and 2-D supergathers. Next, Ostrander gathers were generated from the two supergathers by stacking traces with the same angle into a single trace.
As the objective is to understand the effect of this variation of coverage with offset on AVO attributes, P-reflectivity (Rp) and S-reflectivity (Rs) were extracted from the gathers using Fatti’s approximation and least-squares fitting, and the results were compared.
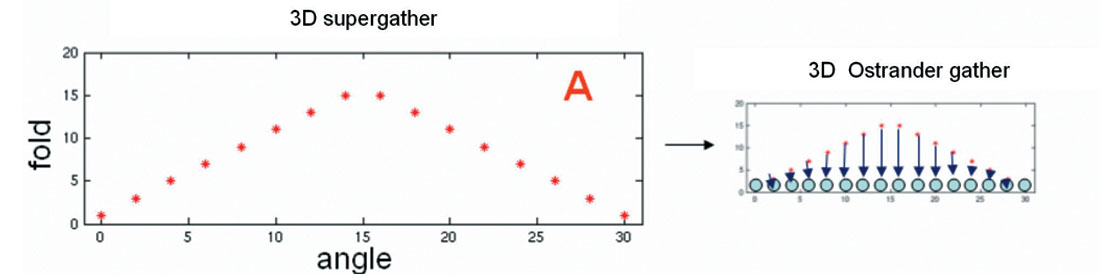
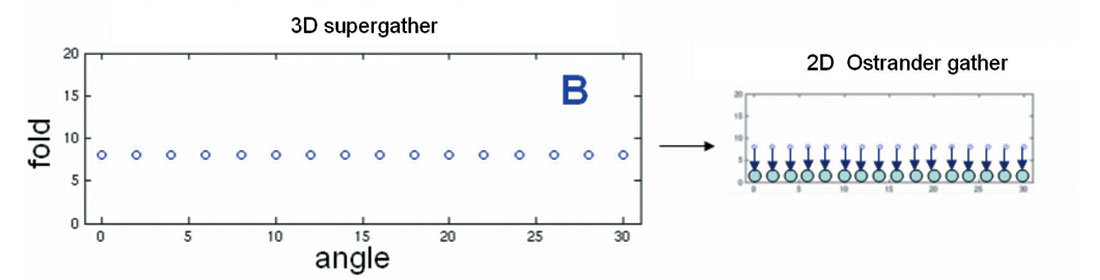
Figure 5 shows two panels; the left panel compares the S-reflectivity extracted from the different gathers, while the right panel compares the P-reflectivity. Trace 1 represents the true answer, trace 2 is from 3-D supergather, trace 3 is from the Ostrander gather, trace 4 is from the Ostrander gather with weights based on the local fold applied in a least squares sense, trace 5 is from the 2-D supergather and trace 6 from 2- D Ostrander gather.
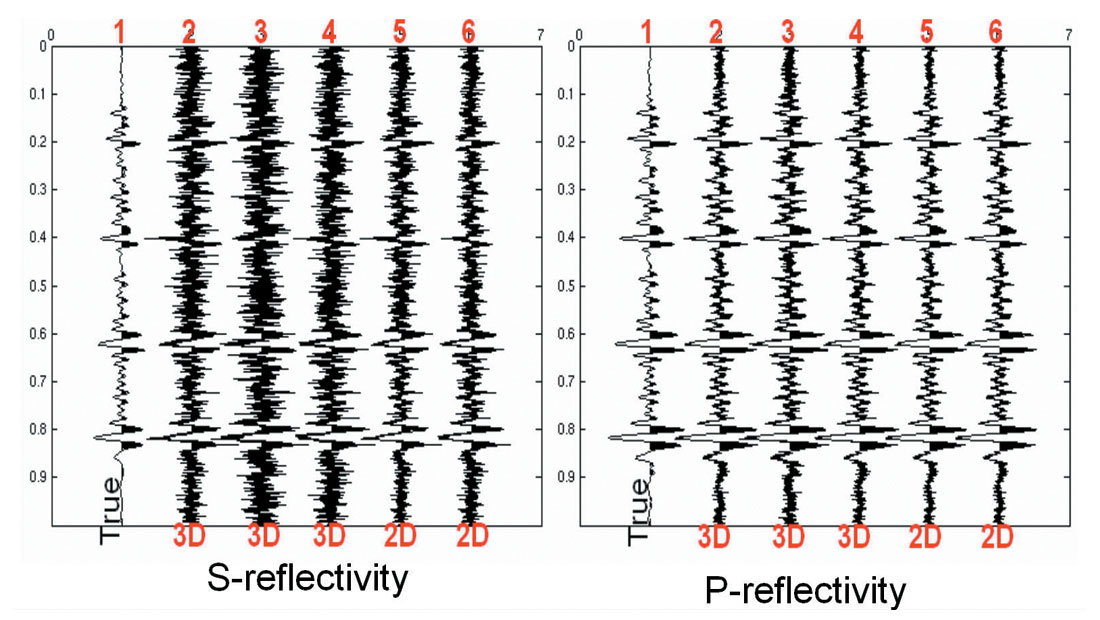
Left panel comparison: Comparing traces 2 and 5, one notices that 2-D supergather appears to be more reliable. Comparing traces 2, 3 and 4, Ostrander gathers on 3-D appears worse than the supergather. However, the weighted Ostrander gather tends to improve the result. For the 2-D case, only subtle differences can be noticed.
Right panel comparison: Comparison of the different P-reflectivity traces shows that they all look quite similar, with the exception of trace 3, corresponding to Rp extracted directly from 3-D Ostrander gather.
The above observations may be summarized as follows:
- Although useful for quality control and the understanding of AVO responses, Ostrander gathers may not improve AVO extraction for 3-D data.
- An even distribution of fold with offset/angle results in a better extraction of AVO attributes.
The above exercise on synthetic data has demonstrated that while generating supergathers in 3-D seismic data is necessary to improve the signal-to-noise ratio, its drawback is that events get smeared, which could be a problem for subtle AVO anomalies. To address the issue of uneven fold-distribution in supergathers, an adaptive approach to supergathers is suggested. It entails borrowing of traces from adjacent CMP locations depending on the fold distribution and so includes an effect of an even fold distribution with offset.
Application on real data
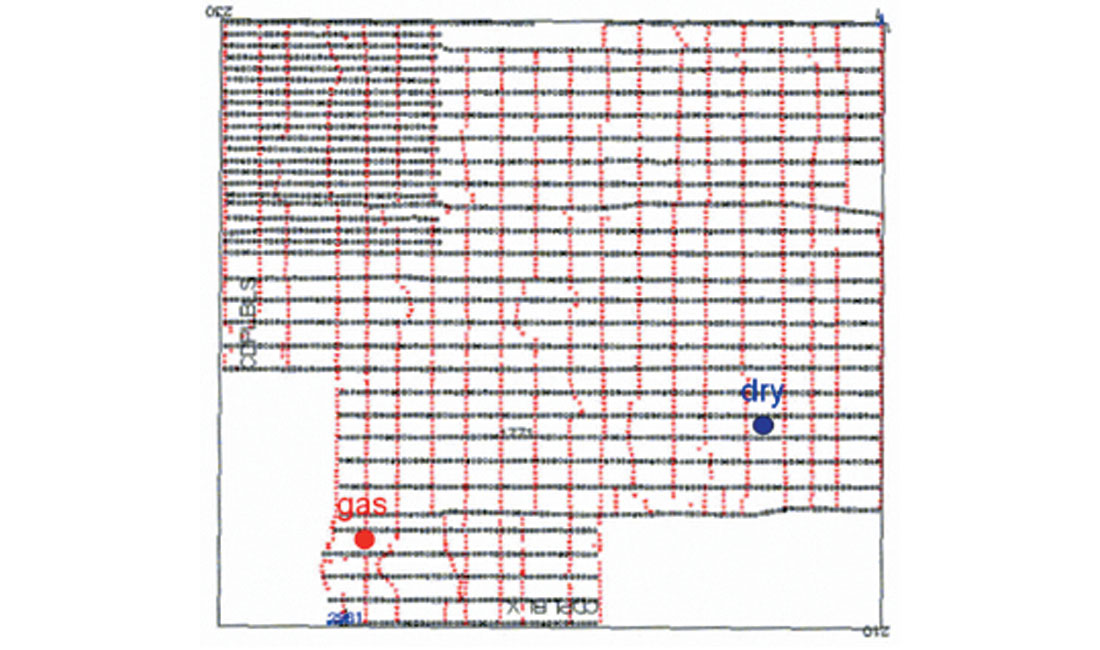
The adaptive supergather approach mentioned above was applied on a 3-D seismic data volume from Alberta, Canada, to see the impact it has on extraction of AVO attributes. Figure 6 shows the survey map for the 3-D seismic volume, and also indicates the location of a gas well and a dry well on it. It may be noticed that the top left corner has a fold higher than the rest of the survey.
To make a fair comparison, AVO extraction was done on three different types of gathers:
- 3 x 3 supergathers
- Ostrander gathers generated from 3x3 supergathers,
- Adaptive supergathers.
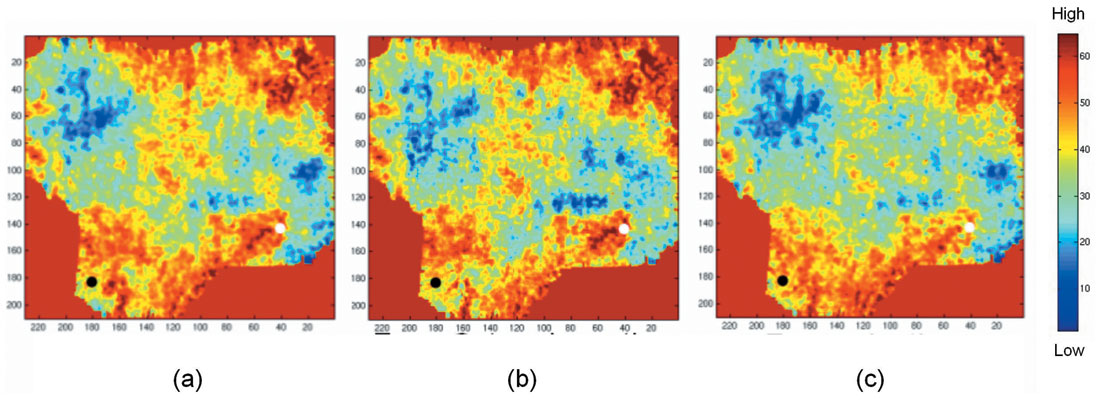
Figure 7 shows the P-reflectivity horizon slices at the target level extracted from these three types of gathers. Though the noise level and acquisition footprint patterns are somewhat more pronounced, the P-reflectivity from Ostrander gathers (Figure 7b is as good as that extracted from the supergathers (Figure 7a). P-Reflectivity extracted from adaptive supergathers retains most of the character seen on the other two and more, but its noise level and footprint is subdued.
In Figure 8, we compare the fluid factor horizon slices at the target level, for (a) 3x3 supergather and (b) adaptive supergather. The red color is indicative of potential pay. Notice, the fluid factor display in Figure 8a from 3x3 supergather shows anomalies in the form of round red patches which do not match the production from the two wells. The equivalent display from the adaptive supergathers shown in Figure 8b provides a much better match with well production.
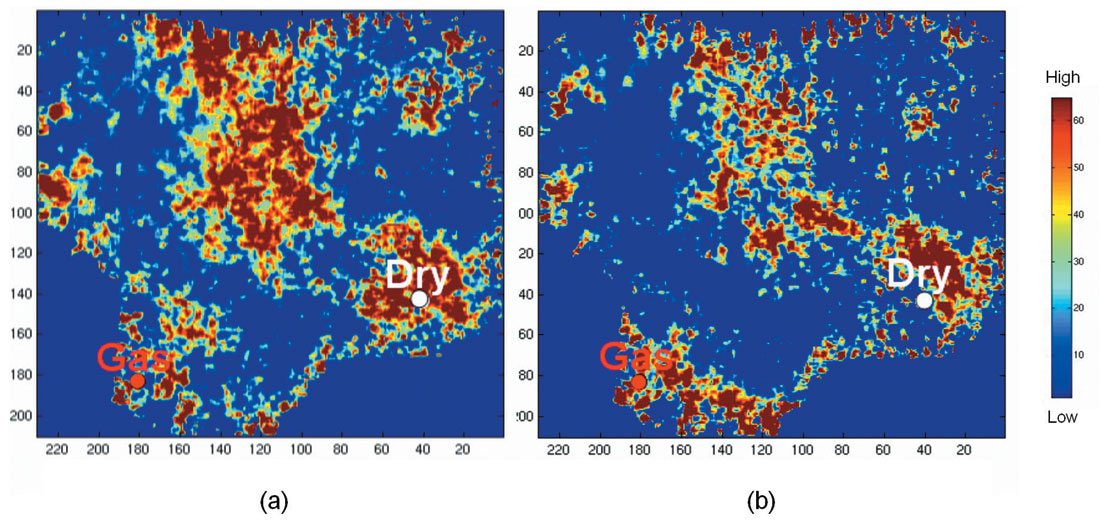
Besides this match with production data, the size of the anomalies seen on both displays are quite different, Figure 8a showing stronger anomalies except the one around the gas well.
In an attempt to understand the difference in the anomalies caused by different supergather schemes, a reliability analysis of the AVO inversion was carried out. A reliability function (R) was defined depending on the geometry parameters, data error and uncertainty in the extraction:
R = F (Fold, Fold distribution, Data error, singularity)
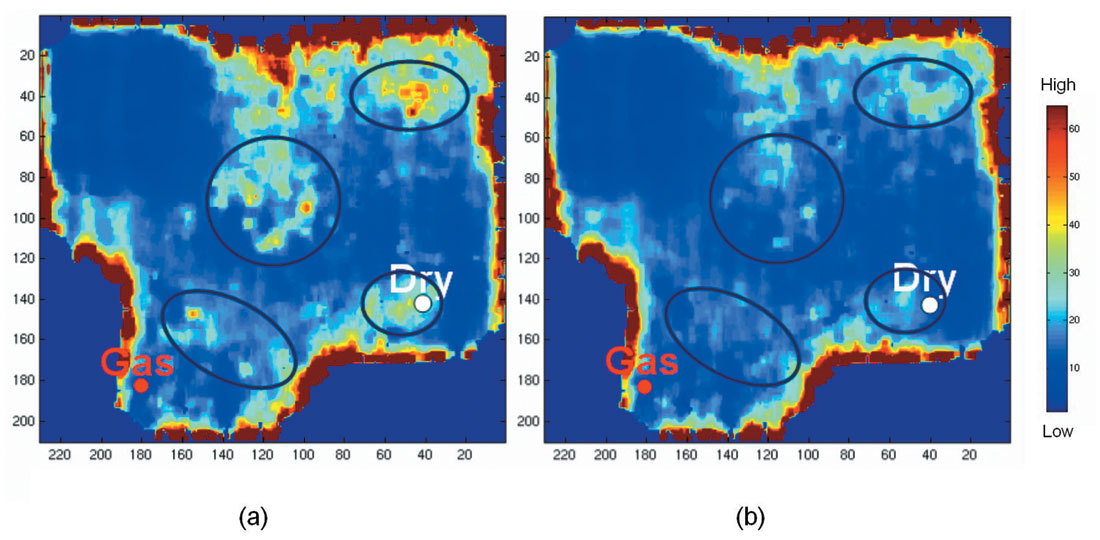
Figure 9 shows the equivalent horizon slices to those shown in Figure 8, with again red color indicating higher unreliability. Apparently, adaptive supergathers improve the reliability for different portions as shown in black rings on the slices. Comparing the reliability maps with the fluid factor maps, it is seen that reliability difference has good correlation with fluid factor difference.
Conclusions
Based on our analysis of 3-D adaptive supergathers approach and its comparison with 3-D conventional supergather or Ostrander gather approach, we arrive at the following conclusions:
- The usual 3-D fold distribution may lower the reliability of AVO extraction compared with 2-D. Adaptive supergather approach provides superior results over 3- D supergather approach.
- Trace fold distribution in AVO gathers has a direct influence on the reliability of AVO extraction.
- Reliability mapping helps evaluate meaningful AVO anomalies and confirms conclusion 1 above.

Acknowledgements
The authors thank Arcis Corporation for permission to show the data and permission to publish the paper.


Join the Conversation
Interested in starting, or contributing to a conversation about an article or issue of the RECORDER? Join our CSEG LinkedIn Group.
Share This Article