Introduction
The great promise of pre-stack amplitude-versus-offset analysis (AVO) of reflected compressional waves lies in the dependence of the reflectivity with increasing offset on the elastic property contrasts at the reflecting interface. As different lithologies may exhibit distinct Poisson’s ratios, and gas-bearing strata usually exhibit anomalously low Poisson’s ratios, AVO has proven to be a useful seismic lithology tool and direct hydrocarbon indicator.
In the presence of abundant well control, quantitative analysis of amplitude variation with offset is an effective method for fluid identification. However, without well control, accurate quantitative estimation of rock parameters is elusive. Routine application of seismic lithologic analysis without wells rarely exceeds the identification of anomalous behavior.
This paper attempts to describe the current state-of-the-art and anticipate future developments in AVO analysis that may allow AVO to progress beyond an anomaly-hunting device.
Poor Utilization of AVO
It is unfortunate that this topic requires special discussion, but AVO, as a complex and non-robust technology, is plagued by frequent misuse and charlatanism, and consequently has a very mixed track record. Experience has shown that the theoretical potential of AVO is, all too often, not realized in practice. Despite some notable successes, it cannot be claimed that the economic benefit of AVO analysis is on a par with the overall success of, for example, conventional bright spot technology. This lack of penetration of AVO into the mainstream of exploration practice is not due to any inherent lack of validity of the concept. Rather, it is due to the general feeling among potential practitioners that the AVO method lacks credibility.
Factors resulting in poor or incorrect utilization of AVO analysis can be divided into four categories: (1) lack of robustness, (2) interpretational complexity, (3) poor analysis of uncertainty, and (4) inappropriate utilization.
Lack of Robustness: One cannot overemphasize the need for interpreters to understand the quality of the pre-stack seismic data. This appreciation requires that the CDP’s be visually inspected, the acquisition geometry and parameters be known and understood, and the details of the processing sequence be evaluated. Without stacking of the full CDP gather, multiples and other coherent noise wreak havoc on the AVO signal. An incomplete list of factors contributing to lack of robustness of the method include: tuning and interference, poor S/N, inadequate offset, inadequate bandwidth, inadequate fold, unbalanced channels, coherent noise, complex structure and stratigraphy, geometric spreading, focusing, scattering, dip, Fresnel zone effects, fault shadows, near surface effects including source and receiver coupling and directivity, array effects, overburden attenuation, attenuation and dispersion, anisotropy, lateral velocity variations, improper processing, weak petrophysical signal, inappropriate indicators, inversion nonuniqueness, incorrect NMO correction etc. In addition, there is always the possibility of partial saturation leading to technical success and commercial failure. In most cases then, AVO results must be considered inaccurate and imprecise. Under these circumstances, one must attach more significance to the presence of anomalies than their absence, and rely on the skill of the interpreter to discriminate against false anomalies.
Interpretation Complexity: Reliance on rules of thumb or a know-nothing approach to attributes (i.e.; red is good) cannot replace a proper physical understanding of the offset dependent reflectivity. The most damaging myth associated with AVO analysis is the idea that “gas sand amplitude increases with offset”. The need to reduce CDP gathers to a manageable amount of data has led to frequent use of indicators or partial stacks. Unfortunately, this is followed by a tendency to ignore the CDP data, which is never desirable and may be fatal if an incorrect indicator is applied. The need to rapidly model CDP gathers has led to frequent inappropriate use of primaries only, isotropic, ray-trace models.
Analysis of Uncertainty: Ultimately, if AVO results are to be factored into risk assessment, it is necessary to provide answers with error bars and with probabilities of petrophysical outcomes (i.e., brine or gas).
Inappropriate Utilization: Obviously, AVO should only be applied where the petrophysical signal and data quality are sufficient for the anomaly to be readily discerned on a CDP gather. AVO can be applied in a reconnaissance mode to generate prospects, or at a prospect level to refine risk assessments and to improve reservoir characterization. Illuminating new prospects is probably the most profitable application of AVO analysis.
Recent Developments and Future Directions
AVO Crossplotting: Implied in the “fluid factor” technique is the utility of crossplotting AVO parameters (e.g., Castagna and Swan, 1997; Castagna et al., 1998). Crossplotting is now a routine AVO analysis method. Remaining questions include (1) What parameters are most robust? (2) How are cross plots affected by noise and overburden effects? (3) How is anisotropy manifested (Chen et al., 1999)? (4) Do elastic impedance or Lame’s constants have any additional information, sensitivity, or robustness? and (5) How can the magnitude of anomalies be quantified and given probabilities? The existence of Class IV gas sands (bright spots with decreasing amplitude versus offset) is obvious within a crossplotting framework (Castagna and Swan, 1997).
Using the Entire Pre-Stack Gather: In the past decade, prestack analysis has been extended to increasingly far offsets, with offset-to-depth (O/D) ranges sometimes exceeding 2. In addition to providing larger aperture for imaging and AVO analysis, the introduction of very far offsets has created new challenges. These include: handling non-hyperbolic moveout; inadequacies of Zoeppritz approximations, increased contribution of anisotropy, and post-critical angle effects. The exploration community has little experience dealing with very far offset data. Far offsets have historically been muted out in processing and we are only now starting to understand how to interpret such data. Poth and Castagna (2000) suggest that, if AVO sensitivity permits, it is better to use smaller offset distances where AVO is more directly related to Poisson’s ratio contrasts and where forward models are more valid. A question that has not received a general explanation is the dramatic degradation of AVO response at far offsets in marine data.
Non-hyperbolic moveout: Ross (1995) demonstrates how higher order moveout corrections can be used to properly flatten events with large O/D ratios and, consequently, extract more accurate attributes. Anisotropy causes characteristic “hockey sticks” on gathers that are NMO corrected with hyperbolic moveout (Hilterman, 1999).
Inadequacies of the Zoeppritz approximations: Approximations to the Zoeppritz equations generally assume small contrasts in elastic parameters and small angles of incidence and fail as the critical angle is approached. Lavaud et al. (1999) attack this limitation by inverting the full Zoeppritz equations at large offsets using an optimal combination of layer parameters, although even this may not be sufficient due to complications discussed below. Chen and Castagna (1999) showed that even at small angles of incidence (less than 30o) the curvature term (third coefficient) of Shuey’s (1985) approximation should be corrected by addition of the square of the normal incidence reflection coefficient.
Contribution of anisotropy: Anisotropy affects AVO analysis by (1) causing non-hyperbolic moveout and corresponding errors in attribute extraction (e.g., Hilterman, 1999), (2) introducing angle dependent transmission losses (e.g. Tsvankin, 1995), and (3) modifying angles of incidence, the reflection coefficients at the target (eg., Carcione et al.; 1998), and the location of the critical angle (e.g., Bork et al., 1996). Ruger (1997) provides the most accurate and useful approximation to the anisotropic Zoeppritz equations including the effects of contrasts in anisotropic (Thomsen) parameters across an interface, although average anisotropies may also significantly alter the reflection coefficients (Chen and Castagna, 1999). Azimuthal anisotropy may confound AVO analysis or be used as a fracture characterization tool (e.g., Ramos and Davis, 1997; MacBeth and Li, 1999; Lynn et al., 1999).
Critical and post-critical angle effects: A common pitfall in interpretation of amplitudes at far offsets is mistaking large amplitude increases near the critical angle for Poisson’s ratio effects. In fact, for isotropic rocks, the critical angle depends only on the P-wave velocity ratio across an interface and has no direct relationship to Poisson’s ratio contrasts. Post-critical complications include large reductions in P-wave reflection amplitude and interference (due to shear-wave mode conversion), phase shifts introduced by complex reflection coefficients, and appearance of refracted headwaves that may be confused with primary reflections. Phase shifts and head-waves may both be readily misidentified as “hockey” sticks caused by anisotropy.
Statistical AVO Analysis: Increasingly, it is being recognized that it is not sufficient to simply provide an AVO attribute and that a measure of the probability of a particular outcome (ie; hydrocarbons) is needed. Handling this problem from a rock physics perspective is fairly straightforward (Castagna and Samake, 1998; Mavko et al., 1998; Sengupta and Mavko, 1999; Dey et al., 1999). What is more difficult is quantifying the uncertainty in hydrocarbon detection due to variations in seismic data quality. This involves transforming rock physics derived probability density functions into the real seismic data domain (which requires more than simple forward modeling) and promises to be a fertile area for research.
Pre-stack Imaging: AVO analysis can be no better than the prestack imaging of the target. Proper migration improves the signal-to-noise ratio and lateral resolution of extracted AVO attributes (Mosher et al., 1996). Ross (1992) and Xu et al. (1993) among others discuss problems in AVO analysis in structurally complex situations.
3D AVO Analysis: Unfortunately, the advent of 3D seismic data has not been the boon to improved AVO analysis that might have been anticipated and it is still common practice to do AVO analysis on “high quality” 2D lines that cross a prospect occurring on a 3D dataset. Part of the problem is logistical in that it is commonly the case that 3D gathers are not preserved and only near, mid, and far-trace partial stacks are available for analysis. Also, for reasons of economy, 3D data often has reduced fold and aperture. The largest problem, however, is related to acquisition footprint (e.g. Canning and Gardner, 1998) a problem that is particularly troublesome for button-and-patch type geometries. Ultimately, 3D imaging with proper amplitude handling and routine preservation of pre-stack gathers will result in far improved AVO analysis with 3D data.
Noise Suppression: In doing AVO analysis, CDP stacking, the most powerful noise suppression tool in the processing of seismic reflection data, is not available except in the form of limited range (partial) stacks. Therefore, pre-stack noise suppression techniques are particularly important. In the past decade, pre-stack Radon filtering (e.g. Foster and Mosher; 1992) has proven to be a particularly useful technique. Weglein (1999) reviews the latest developments in multiple suppression in which he describes inverse scattering techniques that appear to be particularly promising for AVO analysis.
Velocity Analysis: Velocity analysis is perhaps the most critical aspect of AVO attribute extraction. The semblance statistic used in conventional velocity analysis implicitly assumes no amplitude variation with offset. This is particularly troublesome when amplitudes change sign with increasing offset and often result in improperly “flattened” seismic gathers at the target horizon. Kirlin (1992) and Sarkar et al. (1999) among others describe velocity analysis methods that are not confounded by AVO effects. Swan (1993) and Ursin and Ekren (1995) describe automated methods for dealing with residual NMO errors.
AVO Inversion: In the presence of well control, conventional full-waveform AVO inversion can be a very useful technique (e.g. Buland et al., 1996; Mahob et al., 1999). In the absence of well control, the genetic algorithm approach is preferred (e.g. Mallick, 1999), however, no inversion method can overcome the fundamental nonuniqueness of the problem (e.g. Drufuca and Mazzotti; 1995) and a very good starting model is usually needed for inversion to be helpful. Thus, it is more appropriate to view traditional AVO inversion as an interpretation aid, in that it can provide an earth model that is “near” an initial interpretation while also being compatible with the seismic observations. Mahob et al. (1999) describe the use of AVO inversion for hypothesis testing. The one-step waveform-based linear inversion of Simmons and Backus (1996), by assuming a background that obeys petrophysical trends, uses AVO prediction error as a useful means of detecting AVO anomalies. Perhaps the most important, and least discussed or studied, aspect of AVO inversion is the pre-stack amplitude correction or calibration that is applied to the data prior to inversion. It remains to be proven that deterministic amplitude calibration applied pre-drill is generally adequate for quantitative inversion. In most cases, some form of statistical amplitude balancing is required (Rutherford, 1993; Ross and Beale, 1994).
AVO for Thin Beds: Tuning of base and top reservoir reflectors and interference with nearby strong reflectors or within stratigraphically complex reservoirs remains problematical. Bakke and Ursin (1998) and Dong (1999) among others discuss the importance of correcting or at least assessing the importance of tuning effects. Swan (1993) provides insight into how such effects may be compensated for under certain conditions.
N-dimensional AVO: With the cost of multicomponent recording continuing to fall, there is no question that AVO analysis will eventually routinely involve a minimum of 3-components (plus a hydrophone for ocean bottom cables) and utilize P-S in addition to P-P reflections. 9-component acquisition may be resurrected at some point if economics allow. With computer capacity continuing to evolve at an exponential rate, handling of massive volumes of data will become routine. Ultimately, multicomponent datasets will routinely be acquired in 3D, possibly with downhole instrumentation and/or vertical hydrophone cables, in a time-lapse mode. Many problems in integrating data and preserving amplitudes in such situations will have to be solved.
Density Estimation: The “curvature” (fourth-order term in Shuey’s equation) can potentially be used to measure density contrasts when subtracted from the AVO intercept. Unfortunately, as shown by Swan (1993) the signal to noise ratio of this term is many terms worse than that of the gradient, making it an exceedingly non-robust parameter.
AVO in High Impedance Sands: It is generally that illumination of otherwise non-anomalous high impedance sand reservoirs is one of the most profitable utilizations of AVO analysis. It can generate new opportunities in otherwise “picked over” areas. Proving up dim spots is a very important application as AVO can verify that the dimming is due to hydrocarbons rather than being caused by disappearance of the reservoir or poor imaging. AVO analysis in high impedance sands is particularly challenging as the petrophysical signal is generally small, the anomaly may be weak, and signal-to-noise-ratio may be very low.
Case Study
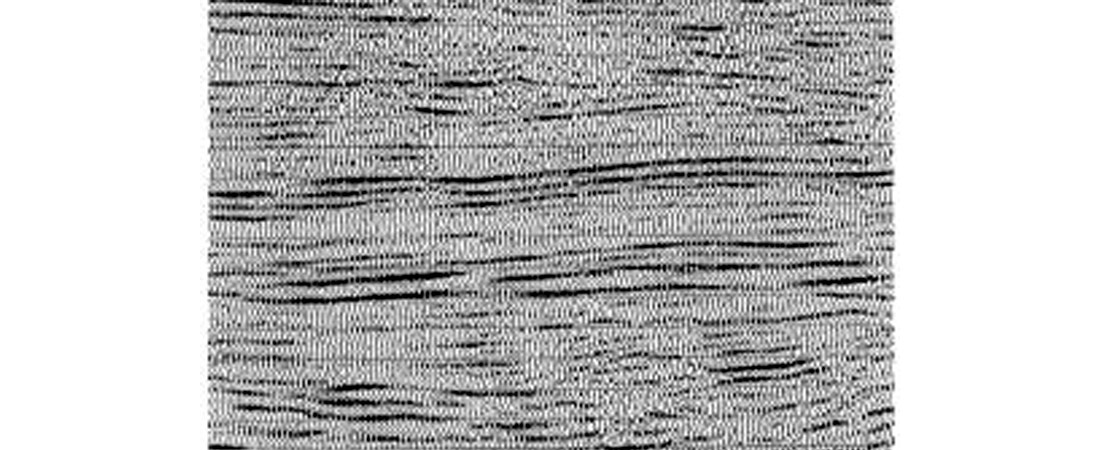
Figure 1 shows a conventional stacked seismic line across known high-impedance pay; no amplitude anomaly is evident.
AVO modeling at the well location indicated that the top of the pay sand (1) should be a positive reflection at near offset, and (2) should theoretically be associated with a Class 2 AVO anomaly exhibiting a phase change (going negative) and brightening at far offsets, whereas non-pay reflectors would have no phase change and no amplitude increase at far offsets. Conversely, the base of the reservoir should be a negative reflection at near offsets and should go positive at far offsets. We inspected raw CMP gathers to see if this behavior could be observed.

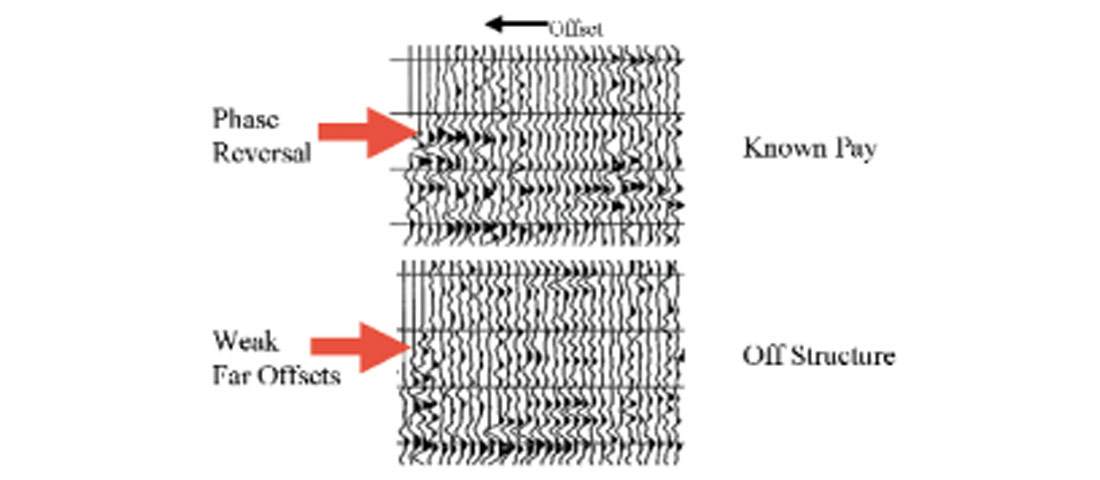
Figure 2 shows a normal moveout corrected CMP gather at a well location where there is known pay. Notice that the reservoir event (indicated by a red arrow) is weak at near offsets and strong on far offsets. Careful inspection of the gather shows that the reservoir reflection has opposite polarity on near and far offsets indicating a phase change. This is classical Class 2 behavior. Also shown on Figure 2 is a typical CMP gather taken somewhat down dip of the known pay. No phase change or brightening at far offsets is evident.


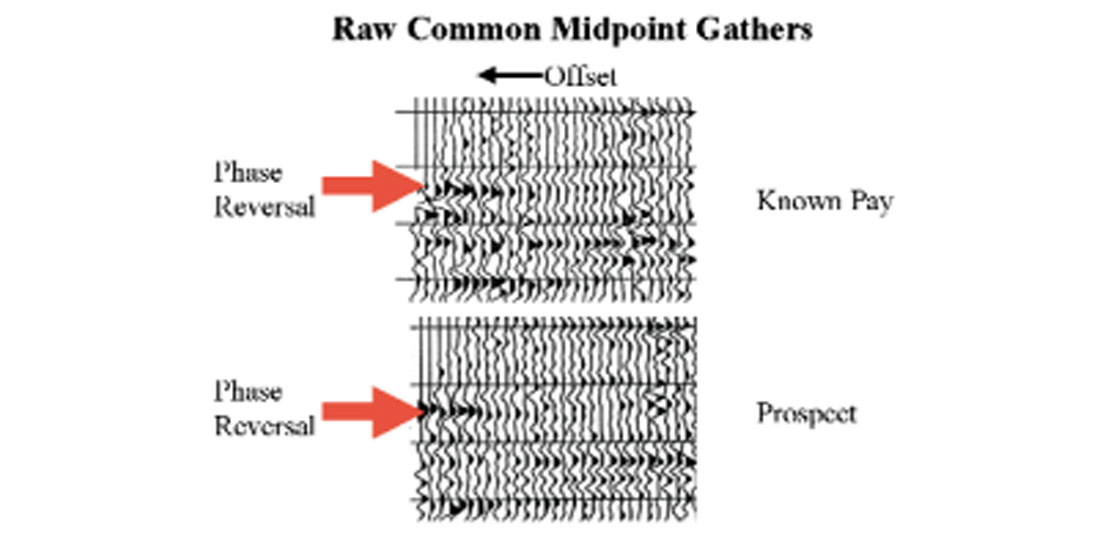
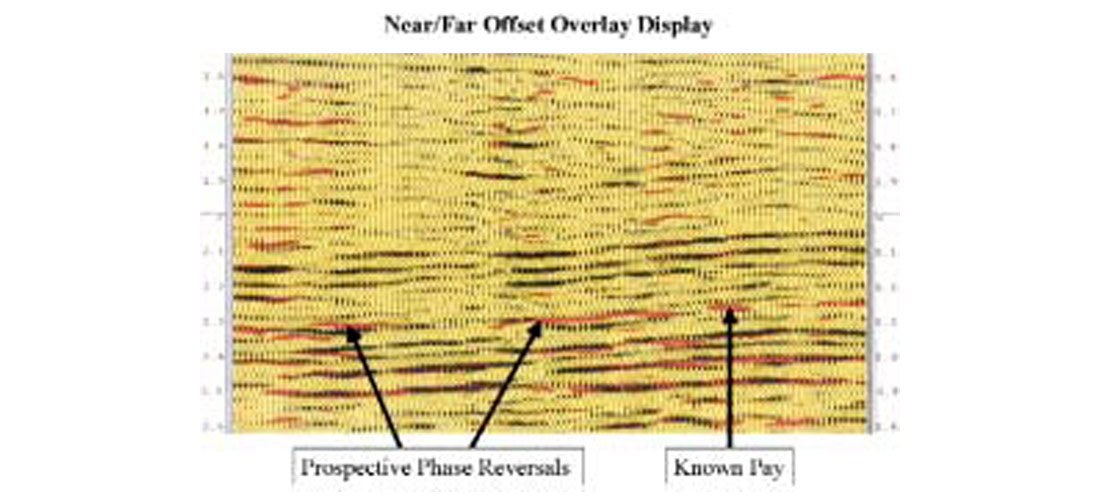
CMP gathers were inspected for the entire line and several more anomalies were discovered (a typical example is shown in Figure 3). The tedious task of inspecting CMP gathers was alleviated somewhat by developing a color overlay technique used for reconnaissance purposes (Figure 4). In this overlay, the near trace stack is represented by a variable area wiggle display, while the far offset stack is color coded with red representing large positive far offset amplitudes. Phase changes at the base of the reservoir are readily apparent when red occurs on a near offset trough.

Discussion and Conclusions
In order to achieve improved quantitative parameter estimation, geophysicists will need to (1) utilize and integrate all available data using the entire dataset before stack including information that is usually muted out in current practice, (2) continue to make progress in understanding of rock physics and its utilization in seismic analysis, (3) recognize that the earth is far more complex than a stack of isotropic layers, (4) properly deal with uncertainty and non-uniqueness, and (5) bring in additional independent information by exploiting as much of the full seismic wave field as possible and making time-lapse measurements.
Seismic lithologic analysis is highly complex and promises to become more complex in the future. There are so many pitfalls that many potential practitioners are led to doubt the utility of the methods. On the other hand, there are many success stories in exploration and reservoir characterization, and some highly competent organizations use seismic lithology methods very effectively. This means there is tremendous opportunity for those that are willing to invest the time, effort, and capital needed to properly exploit the technology.
In conclusion, AVO analysis is a complex, inaccurate, and imprecise technology, which is frequently misapplied. Unfortunately, this has caused many practicing explorationists to conclude that the method is of little practical importance, and that it can safely be ignored with divining rods. To the contrary, AVO is based on very solid physical principles, but for reasons discussed here, is not appropriate for use by those who are unwilling to invest the time and effort needed to understand the technology. Thus, AVO analysis provides a superb opportunity for those who can see through the complexity to beat the competition. Ultimately, geophysics is a science of anomalies, and anomalies are defined by our expectations. There is no rigorous unique solution and our expectations are inexact. Nevertheless, AVO does have the ability to reduce risk if used properly and to “illuminate” new prospects that may have been previously overlooked.

Acknowledgements
Special thanks to Glen Denyer – AVO processor supreme.


Join the Conversation
Interested in starting, or contributing to a conversation about an article or issue of the RECORDER? Join our CSEG LinkedIn Group.
Share This Article