Oh thou who honorest both science and art ....
Spoken by Dante to Virgil as they entered the gates of hell
A few years ago I was fortunate enough to visit the city of Tunis in North Africa. I was there to teach a training course and when the course was over, as has become my habit, I stayed on for a few days to tour the local sites.
One of the sites that I visited was the ruin of the ancient city of Dougga located in the mountains several hours drive south of the city. The area around the city was settled and farmed long before the Romans but because of its strategic location it eventually became the Roman capital of the region. I arrived quite late in the day, long after most tourists had left and was able to tour the site on my own, free from tour guides and hawkers.
There, sitting alone in the ruined amphitheater, I watched as the sun set behind the hills across the valley and cast its shadows on a plain below, farmed since the beginning of civilization. For a brief moment I felt touched by the ancient souls that had sat where I sat and marveled at the wonder of the same scene. For a brief moment, as the light dimmed and the shadows lengthened, the serenity of the scene brought my soul to rest. It was the moment of a lifetime.
It is O.K. to wonder at this point what this introduction is doing in a talk about Seismic Visualization. The correlation seems nebulous at best and a year ago I would have said it didn’t exist at all. But for the past twelve months I have been working on a new type of seismic display that I call SeisScape, one that has taken me into uncharted waters. It has transported me from my comfortable and controllable world of science and deposited me squarely into the chaotic world of art.
Even a simple 2D seismic line contains an incredible amount of information, which must be communicated to the viewer visually. The problem is compounded in 3D where the data volumes have become immense. Most of the advances that have been made in the field of Seismic Visualization over the past decade have concentrated on finding better ways to organize and present these massive data volumes. There are, for example, a number of excellent programs out there now that will let you animate, in real time, almost any data set that you have. As a developer I can only sit in awe of this software and its capabilities.
However, all of these programs are limited by the fact that even though they can present massive amounts of data very quickly, they present it in the same old ways. All of the visualization programs available today use either a wiggle trace (variable area) or a color mapped (variable density) presentation of the data itself.
It was this presentation that I went after a year ago because I believed that both the wiggle trace and the variable density displays have serious limitations that cause us to miss out on much pertinent information. The wiggle trace display, for example, communicates character and structural information very well. However, it lacks the compactness necessary for display on a computer monitor and the visual representation is only effective within a narrow range of amplitude. Once traces start to overlap the user’s ability to discern character is dramatically reduced.
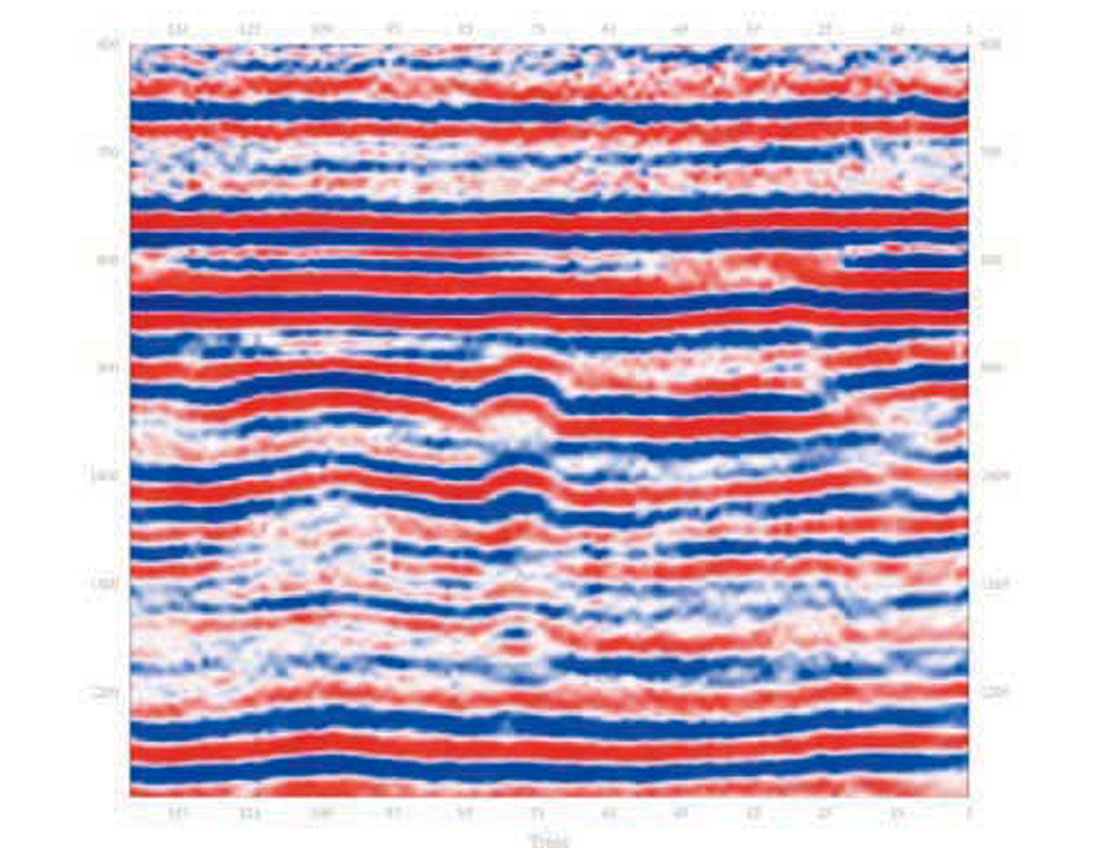
Variable density displays on the other hand are compact and ideally suited to the limited dimensions of a computer monitor. However, research has shown that the human eye is more attuned to variations in light and shade than it is to subtle color changes. For this reason, variable density displays, although better than wiggle trace displays, are not well suited for displaying character or amplitude anomalies.
What I set out to do a year ago was develop an entirely new seismic display. I believed that we had reached a watershed in the capabilities of PC based graphic cards. I believed that, thanks to the PC gaming industry, the graphic cards were now capable of displaying, illuminating and animating seismic data as a true three-dimensional terrain-like surface. It was my hope that by doing this we could take advantage of our natural ability at viewing landscapes. We have millions of years of experience in doing this and I thought that if the display were possible we might be able to pick out features that we would otherwise have missed.
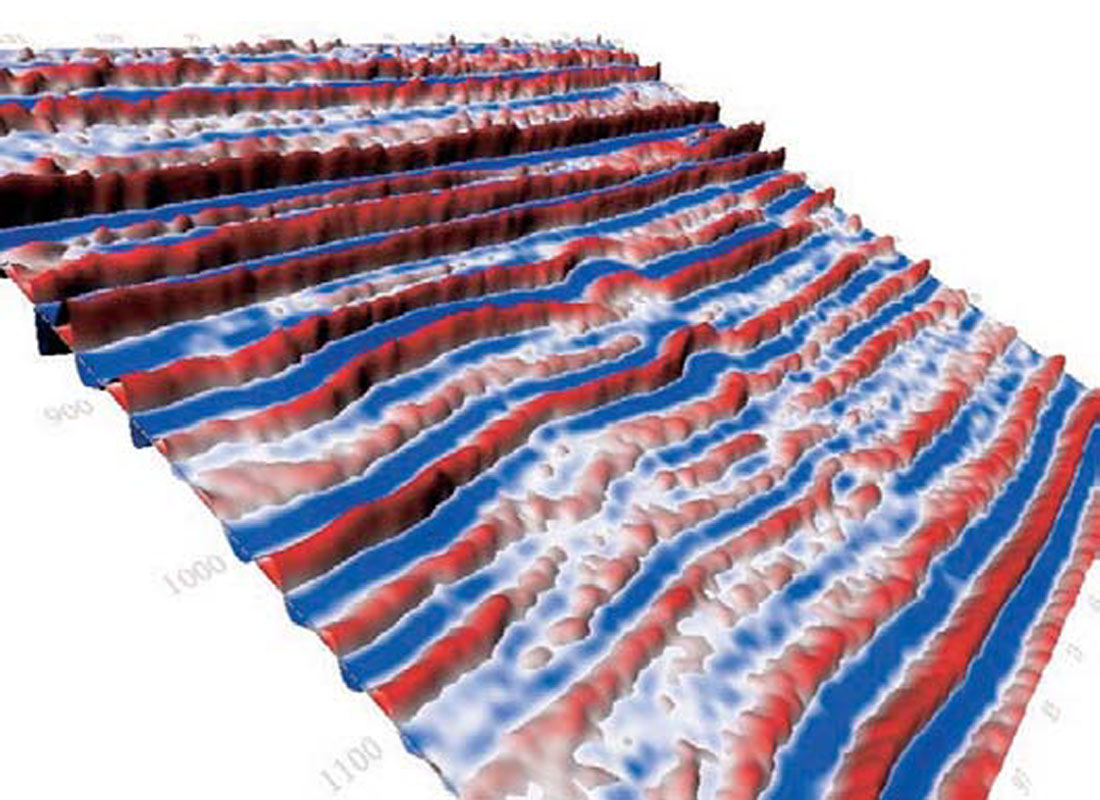
As with any new application, however, before I could commit to it I had to find out three things, namely – was it possible, was it practical and would it be useful? Most of my talk, to be sure, is going to focus on the answers to these three questions, but in truth that is only because I have to. The answers are very simple, yes it is possible, yes it is practical and yes, you can see all sorts of things that you couldn’t before. But, as they said in the first Superman movie, “these are matters of mere fact,” and they are only part of the story.
The real story of a SeisScape display is how visually stunning it can be. When I started the project I thought the displays would be possible but I had no idea what they would actually look like. I had no idea at all that they would look so real. I have, over the course of my career, viewed thousands of seismic displays and I have found them all to be intellectually fascinating. I can sit and look at a seismic section for hours and not be bored, but looking at the same section as a SeisScape display I have found that I am entertained.
What I was looking for was pure science, what I found and what I want to show you is pure art.


Join the Conversation
Interested in starting, or contributing to a conversation about an article or issue of the RECORDER? Join our CSEG LinkedIn Group.
Share This Article