Summary
A set of seismic test lines was acquired in the spring of 2001 by the CREWES Project and Devon Canada Ltd. (formerly Anderson Exploration Ltd.) in the Mackenzie Delta, N.W.T. The lines, shot with dynamite and vibrator sources, included a 750m spread of 3-C geophones across a transition zone from floating to ground-fast ice. Noise on the seismic spread decreases significantly from floating to ground-fast ice. The 3-C seismic data were processed to final stacked sections for both PP and converted (PS) waves. To our knowledge this is the first PS seismic section in the Canadian Arctic. These sections were interpreted using logs from a neighbouring well, Hansen G-07.
The P-sonic log from well G-07, conducted over a depth range from 1200m to 3200m, was used to create synthetic seismograms to interpret Kugmallit and Richards sequences on the P-wave section. The K1 and K2 horizons, corresponding to lithological changes inside the Kugmallit Sequence, were used to correlate the converted-wave synthetic seismograms to the PS section. In addition, a promising direct correlation is found between the PP and PS sections using a Vp/Vs value of 2.1. This Vp/Vs value is consistent with that determined in elastic-wave measurements in the distant Mallik 2L-38 well (with average values between 2.04 and 2.41 for various sequences). The converted-wave section displays promise for further lithological and imaging possibilities.
Introduction
The Mackenzie Delta, N.W.T. has recently seen a surge in hydrocarbon exploration (Polczer, 2001) with a wide variety of reservoir types identified (Ross, 2003). The presence of methane hydrates (Dallimore et al., 1999) makes the Mackenzie Delta an even more fascinating area for exploration.
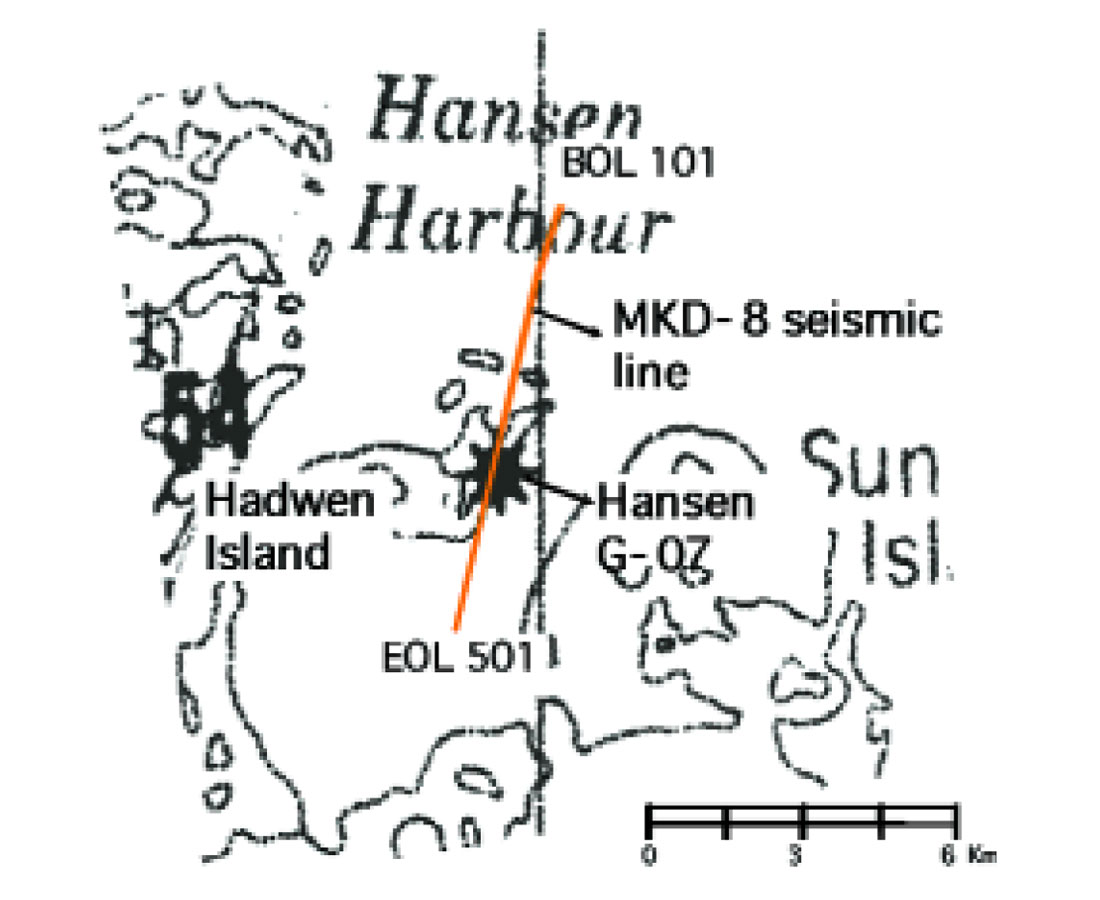
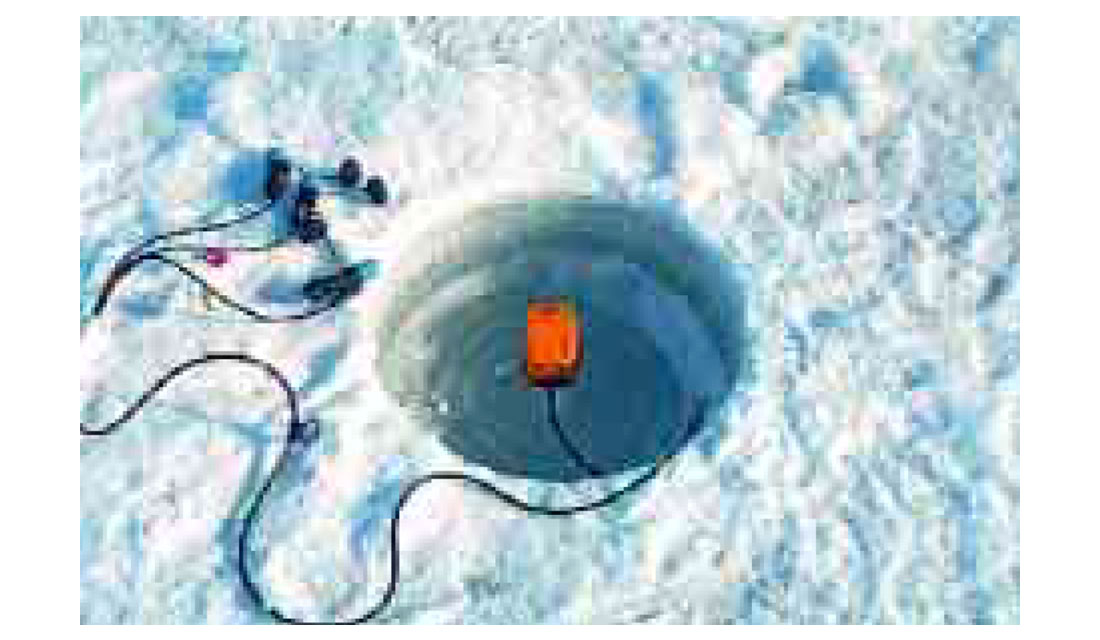
As part of a larger effort to study seismic acquisition methods in the Mackenzie Delta, the CREWES Project with Devon Canada Ltd. (acquired a 750m multicomponent seismic spread in the spring of 2001 (Hall et al., 2002). The full seismic study (6 km of shots — Figure 1) included the use of dynamite and vibrator sources both on floating and ground-fast ice. Marsh phones, hydrophones (under the floating ice areas), and 3-C geophones were all used in various locations on the line. Figure 2 shows a 3-C geophone frozen into the ice (quite good coupling) on the line.
The multicomponent seismic data were processed at the University of Calgary and by Dr. Peter Cary of Sensor Geophysical. A preliminary interpretation of this line is accomplished in this work using the Hansen G-07 and Mallik 2L-38 well log data.
Mackenzie Delta Geology
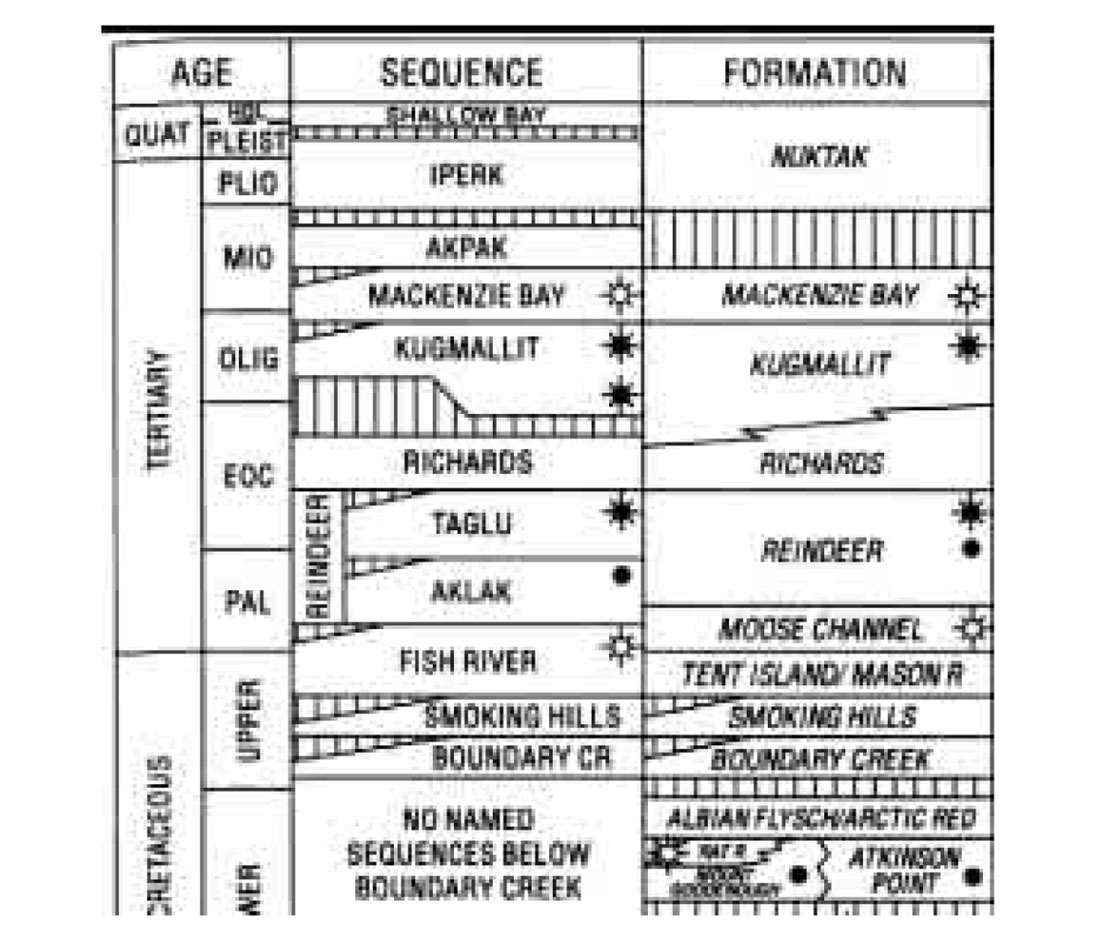
Upper Cretaceous to Holocene sediments in the Beaufort Mackenzie Delta are represented by over 10 km of strata, consisting mostly of clastic rocks deposited in deltaic, shelf, slope and deep-water environments, (Dixon et al., 1992). Eleven regional sequences have been identified, from the Upper Cretaceous to Holocene (Figure 3). The structural basement is composed of Albian and older strata.
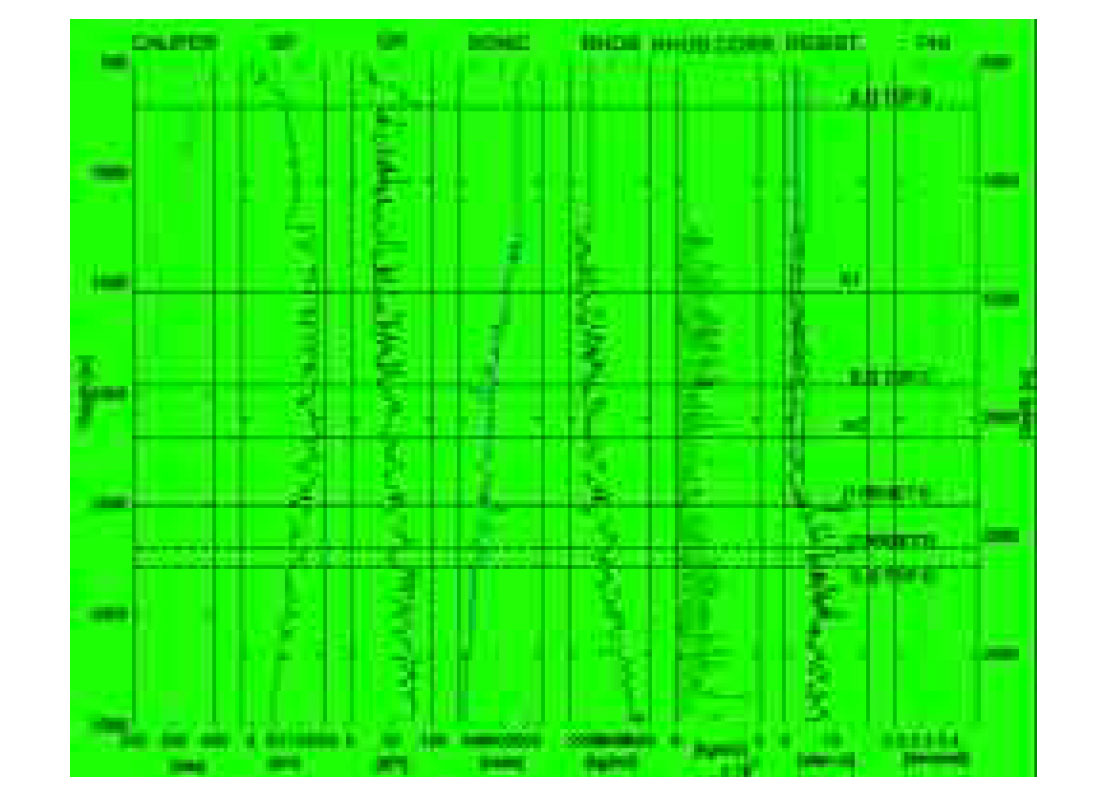
A suit of 10 logs was acquired at the Hansen G-07 well (Figure 4). This is an Imperial Esso well located on Hadwen Island that was logged to approximately a 3275m depth. Spontaneous potential, gamma-ray (GR), and caliper logs were acquired from 521.8m to 3275m depth. Sonic, density, resistivity (shallow, medium, deep) and porosity were acquired from 1196m to 3275m depth.
Using the GR and sonic logs, three lithological boundaries separating four units were interpreted (Figure 4).
A model for the surrounding area of the MKD-8 line was defined using regional isopach maps (Dixon et al., 1992) consisting of the following sequences:
- Iperk: which should be present in the shallow section, but due to the starting depth of logging at 500 m in G-07, this sequence is not expected to appear on the logs.
- Akpak: is not expected to be present at this location.
- Mackenzie: this sequence should be recorded in the first 200 m of the well logs.
- Kugmallit: a complete section of Kugmallit (about 1800 m) should have been logged at G-07.
- Richards: should appear at the bottom of G-07 with a total thickness of 1400 m.
Using our interpretation of the Hansen G-07 logs (constrained by the depth model inferred from the isopach maps) with the geological description, we interpret that:
- TOPB — is the contact between the Mackenzie Bay Sequence and Kugmallit Sequence
- TOP C — is where the Kugmallit Sequence becomes shale-dominant
- TOP D — is the contact between the Kugmallit Sequence and Richards Sequence
Synthetic Seismic Sections
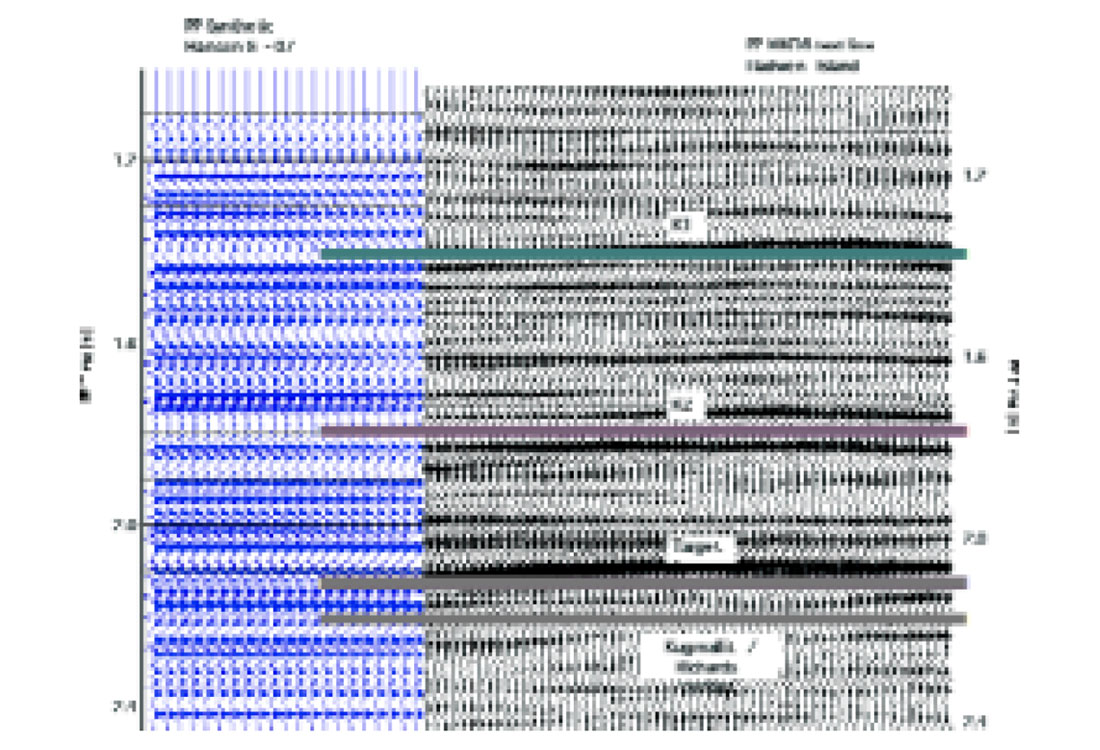
We used the SYNTH application from the CREWES MATLAB Seismic Toolbox to create synthetic seismograms (Figures 5 and 7) with NMO removed, a maximum offset of 1500 m, an offset increment of 100 m, offset/depth ratio of 1, and variable Vp/Vs from 1.6 to 2.8. A Ricker wavelet with 30 Hz dominant frequency was used and no attenuation or geometrical spreading effects have been included.
A reasonable correlation between the PP synthetic seismograms and the PP seismic section (Figure 5) can be inferred.
Once the PP section has been interpreted, we continue on to analyze the PS section:
Estimate the Vp/Vs values from the Mallik well:
The closest well that had both P-wave and S-wave sonic logs is the Mallik 2L-38 (Figure 6). A comprehensive geophysical study in this well was completed as part of the JAPEX/JNOC/GSC Mallik group (Dallimore et al., 1999; Mi et al., 1999). Several sequences are seen at this location: Iperk, Mackenzie Bay, and Kugmallit. The base of the permafrost occurs at 640m (Mi et al., 1999). The Vp/Vs curve was calculated from the sonic logs (Figure 6). An average ratio for each sequence was taken from this log (Table 1).
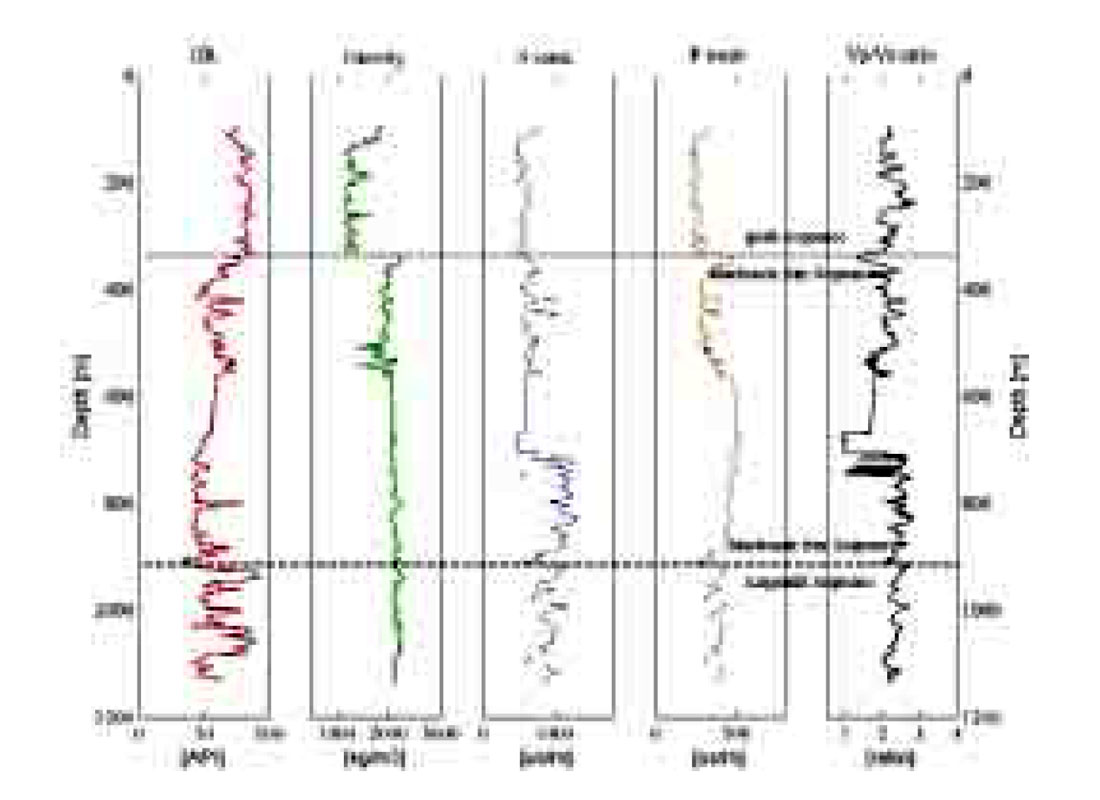
The mean Vp/Vs value for the Iperk Sequence is 2.19, which is larger than the underlying Upper Mackenzie Bay, suggesting a change in lithology. The Mackenzie Bay has two different zones, the Upper and Lower. These zones display different Vp/Vs values that may be associated with lithology as well as permafrost change (Figure 6). The upper zone has a value of 2.04 and the lower 2.41. These values are used to create an S-wave log from the P-wave log of G-07. These logs are employed in the calculation of the PS synthetic seismogram for the MKD-8 line.
Compare PP and PS seismic sections using several Vp/Vs values:
Two reflectors “K1” and “K2” were defined (Figure 4) to help interpret the PS section. Both are part of the Kugmallit Sequence. The higher quality PS data of the shallower section is used to assist the correlation of horizons in the deeper section.
Using a range of Vp/Vs values, the PS section was stretched by its respective factor and compared to the PP section. Based mainly on the seismic character (amplitude, continuity) of the reflectors K1 and K2 and omitting any structure around the edges, the PS section was correlated with the PP section using Vp/Vs of 2.1 as shown in Figure 7.
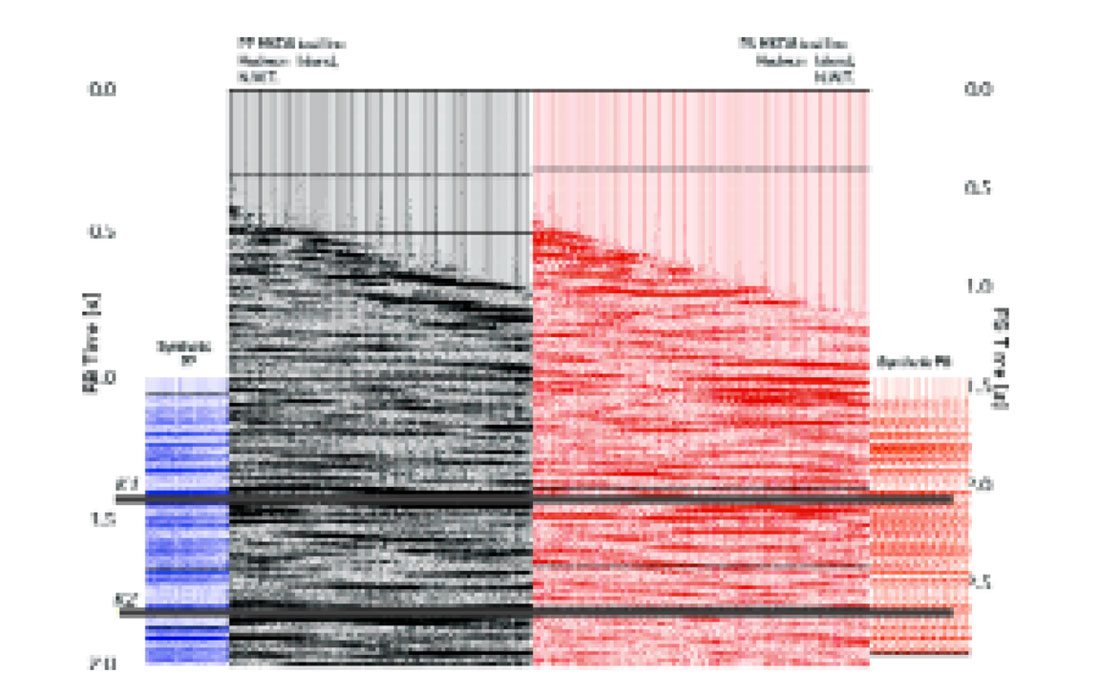
As mentioned before, the Vp/Vs values in Table 1 were used to create PS synthetic seismograms that were correlated with the PS section (Figure 7). We find a promising correlation among the data types. A more compelling correlation would likely result from the acquisition and processing of a full 3-C seismic line or area.
| Sequence | Vp/Vs statistics | |||
|---|---|---|---|---|
| Mean | Median | Minimum | Maximum | |
| Table 1. Vp/Vs values for Mallik 2L-38 well | ||||
| Iperk | 2.19 | 2.17 | 1.44 | 2.90 |
| Upper Mackenzie Bay | 2.04 | 2.08 | 1.31 | 2.62 |
| Lower Mackenzie Bay | 2.41 | 2.46 | 1.42 | 2.81 |
| Kugmallit | 2.30 | 2.30 | 1.98 | 2.69 |
Conclusions
We present a preliminary interpretation of the MKD-8 multicomponent seismic test spread using ground truth from the Hansen G-07 well. We infer that the Mackenzie Bay, Kugmallit, and Richards sequences are present in the G-07 well. The PP and PS MKD-8 seismic sections show a promising correlation with the synthetic sections. The Vp/Vs function estimated from the Mallik 2L-38 was a reasonable approximation of that interpreted from the MKD-8 seismic sections. The converted-wave seismic section is of similar quality to the P-wave suggesting further lithologic assessment and imaging opportunities will be possible using multicomponent seismic data.

Acknowledgements
We would like to thank the sponsors of the CREWES Project for their continuing support of seismic exploration research and application. Special thanks to Dr. Don Lawton for discussions about this project. Mssrs. Kevin Hall and Eric Gallant of the CREWES Project assisted in the field acquisition. Many thanks to Devon Canada Ltd. for supporting this effort.


Join the Conversation
Interested in starting, or contributing to a conversation about an article or issue of the RECORDER? Join our CSEG LinkedIn Group.
Share This Article