The term induced seismicity is generally defined as earthquake activity that is brought about by human activities, including fluid injection or withdrawal, reservoir impoundment and mining (Majer et al., 2012). A related concept is triggered seismicity, which represents activation of a pre-existing zone of weakness such as a fault that is already critically stressed (Majer et al., 2012). Although these phenomena have been investigated and characterized for many years in areas of mining, reservoir impoundment and geothermal development, recently there is growing interest in relation to energy technologies (Hitzman et al., 2012). To a large extent, this increasing interest can be attributed to reports of increased levels of seismic activity due to oil and gas activities in some regions (B.C. Oil and Gas Commission, 2012; Ellsworth, 2013; Keranan et al., 2013).
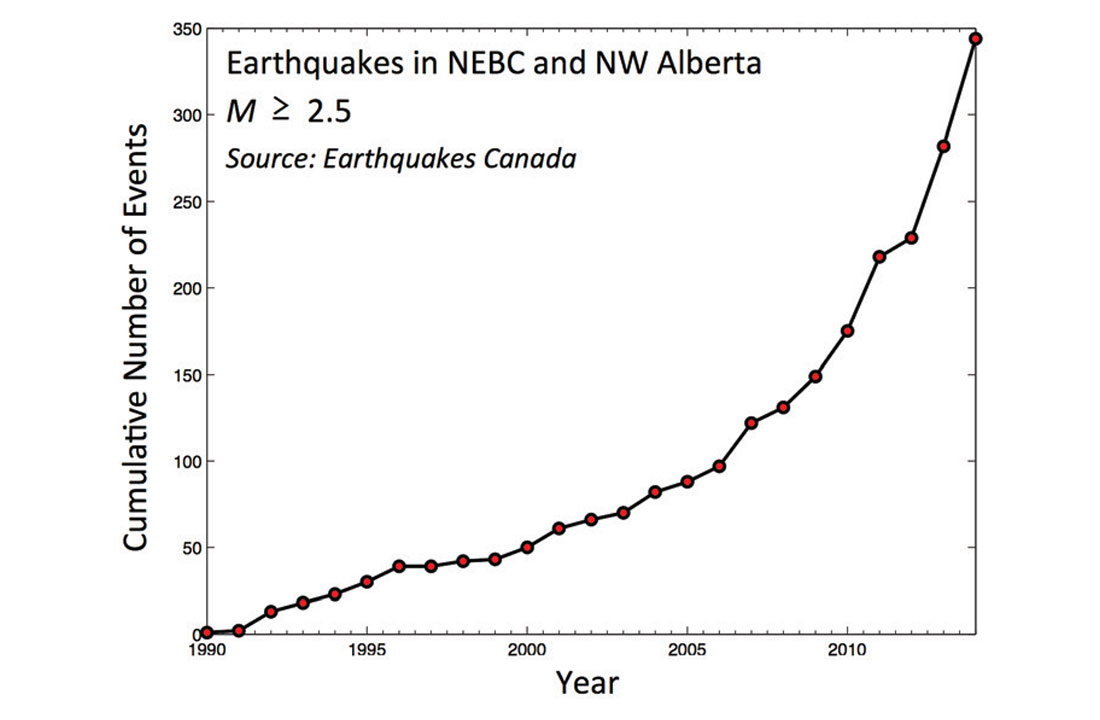
To put this trend into a Canadian context, Figure 1 illustrates the apparent increase in seismic activity in northeast British Columbia and northern Alberta since 1990. The graph shows the cumulative number of events of magnitude ≥ 2.5 by year, including both natural and induced earthquakes listed in the national earthquake catalog maintained by Earthquakes Canada (www.earthquakescanada.nrcan.gc.ca) up to September 22, 2014. The trend defined by the cumulative events curve indicates that about 6 events occurred annually prior to 2005. Earthquake productivity in this region increased to about 20 events per year from 2006-2010 and more than 40 events per year from 2011-2014. Although some of this apparent increase may reflect densification of seismograph station coverage in this region (see below), the overall increase in seismic activity probably correlates primarily with a corresponding increase in various oil and gas development activities, including hydraulic fracturing (e.g., BCOGC, 2012).
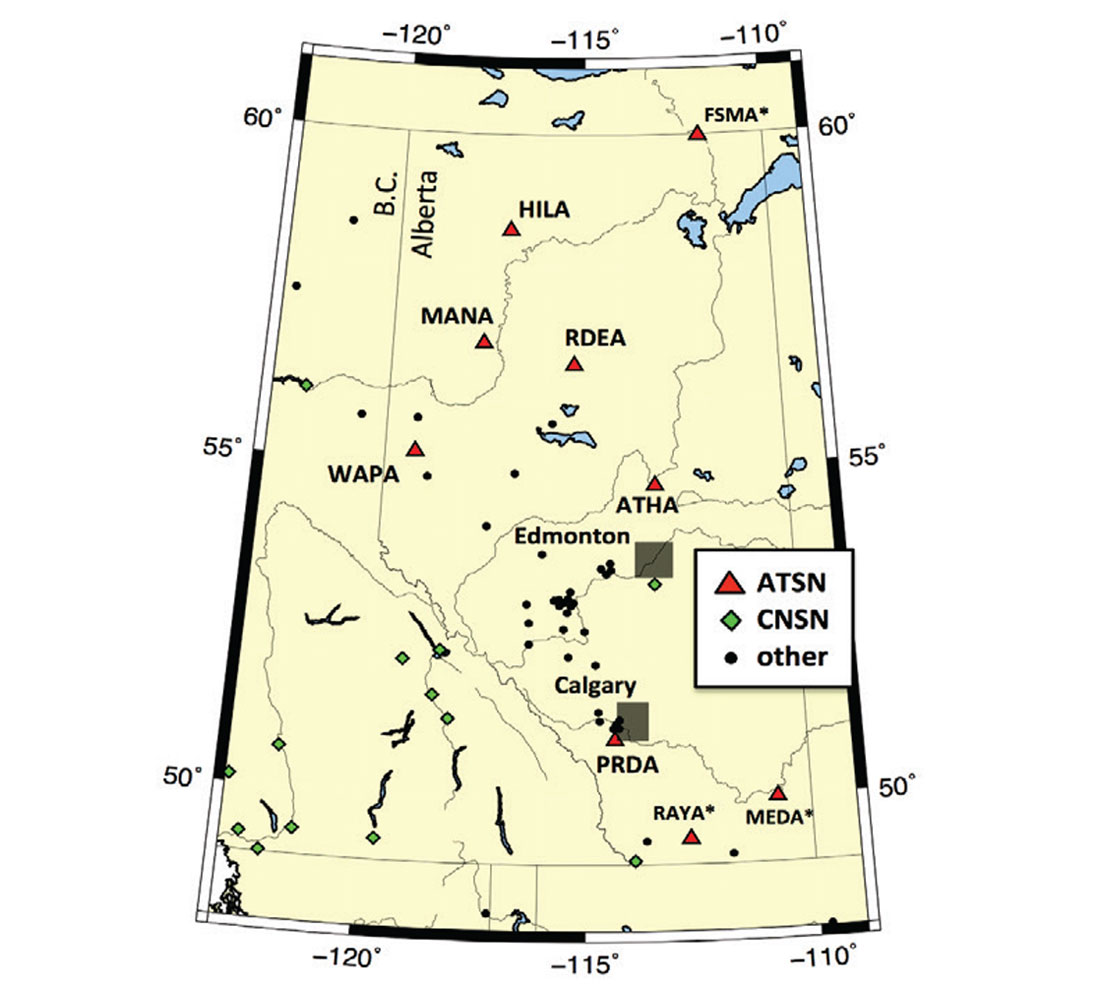
The Alberta telemetered seismograph network (ATSN) consists of 9 broadband seismograph stations installed by the University of Calgary from 2009-2012 (Figure 2). The scientific objectives of this network are: 1) to image the lithosphere beneath Alberta and environs based on analysis of waveforms from distant earthquakes, and 2) to monitor regional seismicity patterns for earthquake hazard studies. The ATSN is one of several new and/or upgraded seismograph networks operating in this area; significantly increased station coverage in the past few years is providing improved resolution of earthquake activity, with both a lower magnitude detection threshold and reduced uncertainty in event locations. The purpose of this paper is to describe the installation and operation of the ATSN, along with the outlook for future studies that will leverage this research infrastructure.
ATSN Seismograph Network
ATSN seismograph stations are concentrated primarily in northern Alberta, with three locations in the south of the province (Figure 2). The stations are/were generally located on private lands. An Internet connection, via wireless or direct connection, is used to facilitate streaming of the data in near real-time to a remote data-acquisition and archival centre. The sensors consist of Trillium 240 seismometers, manufactured by Nanometrics. These are low-noise instruments characterized by a flat velocity response from 240 seconds to 35 Hz. This unusually broadband response range exceeds the basic requirements for regional seismicity monitoring, but provides low-frequency spectral response that is required for some teleseismic waveform studies such as surface-wave analysis to image the deep lithosphere. Taurus portable seismograph units are used to digitize the data, and provide buffered data storage, communications and remote configuration capabilities.
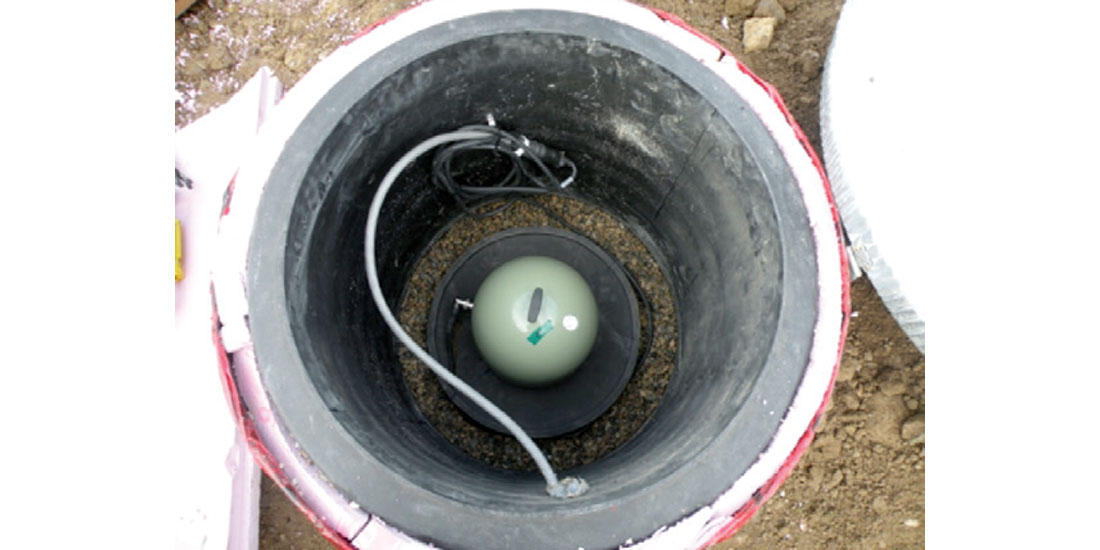
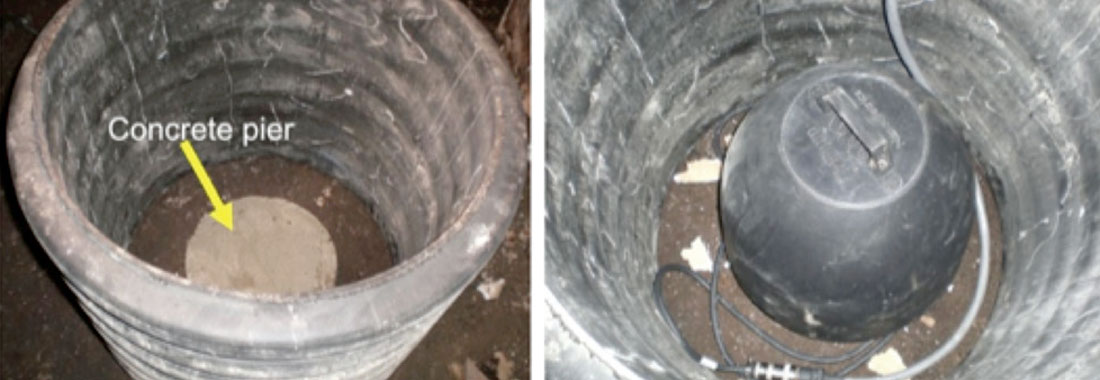
The seismometers are installed in near-surface vaults, as illustrated in Figures 3 and 4. In Figure 3 the Trillium T240 seismometer is viewed from directly above, resting on a concrete pier within a vault constructed using exterior corrugated metal culvert material and interior high-density polyethylene (HDPE) material, with intervening insulation. Improved coupling of the concrete pier (Figure 4) with the ground surface is achieved by driving rebar metal spikes about 2 m in length into the ground. A thermal insulation cover is placed over the seismometer to reduce low-frequency noise that may be caused by sudden changes in temperature at the site.
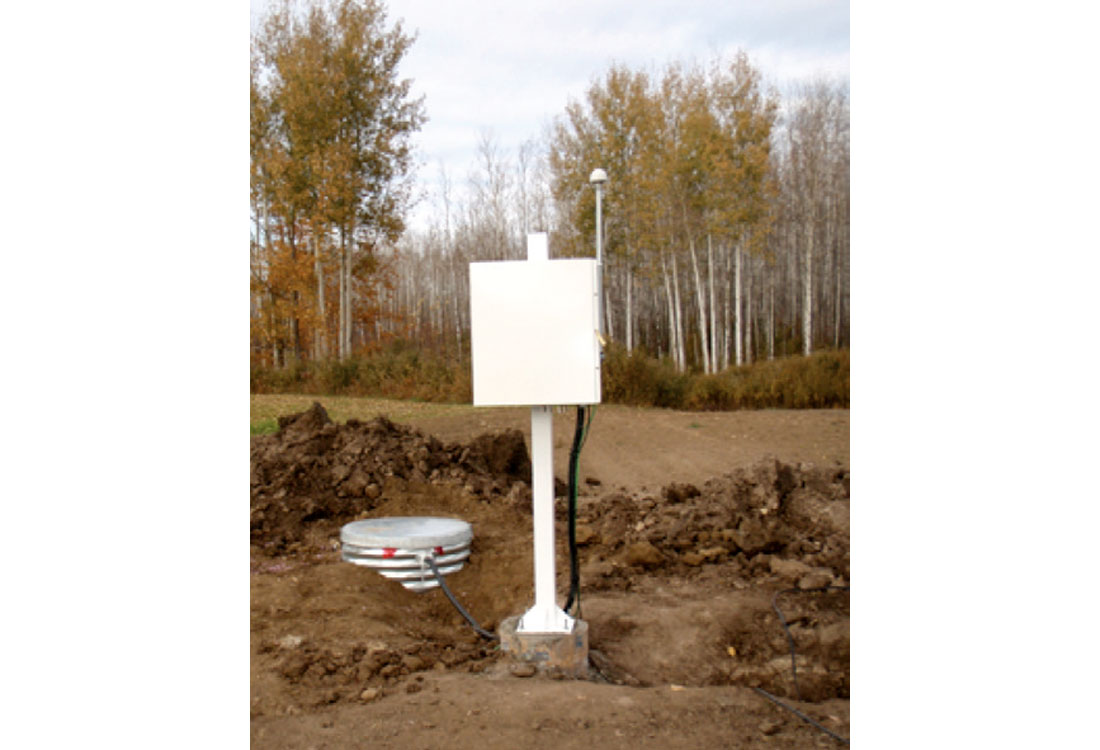
A nearly completed seismograph station installation is shown in Figure 5. Electronic components, consisting of the Taurus seismometer, battery backup system, firewall and wifi modem are housed inside a steel box that is mounted onto a metal post located a few metres from the vault. AC power is supplied to the station via buried cable. Accurate synchronization of the timing system is achieved using GPS, with a bullet-style antenna mounted above the electronics box. When complete, cables such as the sensor cable from the digitizer to the seismometer are shielded inside protective conduit and buried beneath the ground surface.
To date, real-time data from the ATSN stations have been streamed via the Internet to a data hub in Ottawa, where the data are backed up and archived by Earthquakes Canada. As such, the data are publicly available using the email-based automatic data request management (autodrm) system maintained by Earthquakes Canada (see http://www.earthquakescanada.nrcan.gc.ca/stndon/AutoDRM/autodrm_req-eng.php). Establishment of a secure connection to the data hub in Ottawa necessitates the creation of a virtual private network (VPN). Unfortunately, this VPN system has proved to be difficult to troubleshoot and maintain from Calgary, which has caused some issues in the past with data gaps. As outlined below other options are currently being explored for access to the data going forward.
Outlook
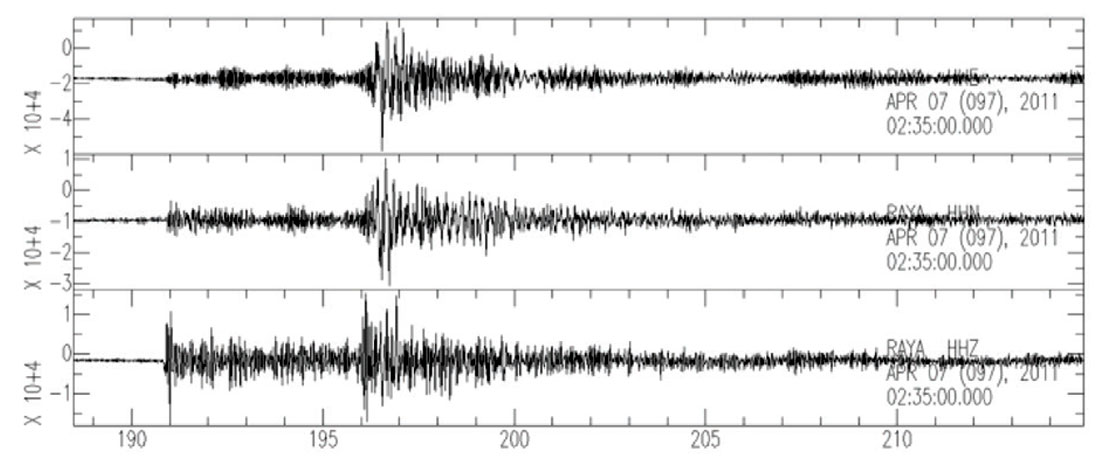
Data acquired by ATSN stations are now being incorporated into an earthquake catalog developed by the Alberta Geological Survey. Figure 6 shows a sample earthquake waveform recorded at ATSN station RAYA. Stern et al. (2013) used earthquake waveforms such as these, acquired at CNSN stations, 5 ATSN stations available by December 2010, non-telemetered stations from the Canadian Rockies and Alberta Network (CRANE; Gu et al., 2009), together with stations in the northern U.S., to construct a new catalog of seismicity for the period 2006-2010. They reported that most of Alberta’s seismicity occurs close to the Rocky Mountains, particularly in discrete earthquake clusters near Rocky Mountain House, Brazeau River, and Turner Valley.
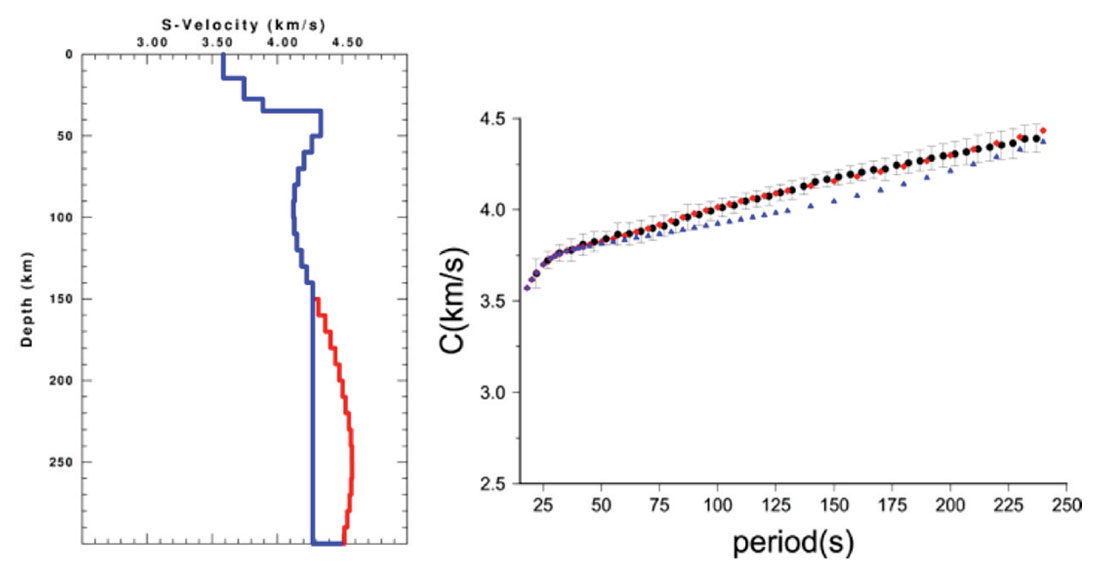
Broadband waveform data from teleseismic earthquakes (i.e. earthquakes recorded at distances greater than ~ 1000 km) are being used to investigate the deep lithosphere beneath Alberta and British Columbia. In particular, shallow earthquakes produce strong Rayleigh and Love waves that can be recorded to great distances. The dispersion characteristics of these surface waves are sensitive to the velocity structure in the lithosphere, making it possible to invert frequency-dependent fundamental-mode Rayleigh-wave phase velocity measurements in order to infer lithospheric structure. Figure 7 shows an example in which the predicted phase velocity for two different models is compared with the observed phase velocity in the period band from 15s to 250 s. The total thickness of the lithosphere is of particular interest, as this has a strong influence on the distribution of diamond-bearing kimberlites (e.g., Jones et al., 1996).
In the near future, plans call for changes to the ATSN to improve the data throughput. Rather than streaming to a data hub operated by Earthquakes Canada, the data will be streamed to a data acquisition hub operated by Nanometrics, and archived by a data centre managed by the Incorporated Research Institutions for Seismology (IRIS). This change in data streaming will facilitate remote troubleshooting and diagnosis of instrumentation issues at ATSN stations from the University of Calgary. It will also enable ATSN data to be compiled and analyzed more easily in conjunction with other seismograph networks operating in Alberta and environs (Figure 2). Archival of data at IRIS will ensure that the data will continue to be freely available for researchers.
Conclusions
The Alberta Telemetered Seismograph Network (ATSN) has been in operation since 2009 and has provided data in support of regional seismicity studies and investigation of the deep lithosphere. ATSN waveform data acquired to date are available by email/ftp through the autodrm system operated by Earthquakes Canada. In the near future, changes to data streaming will make the data available to researchers through the IRIS data management centre.

Acknowledgements
Funding for the ATSN was provided as part of a grant to D. Eaton entitled “Laboratory for Passive Seismic Imaging of Earth Processes” from the Canada Foundation for Innovation. Numerous individuals have contributed to installation and operation of the network, including K. Vasudevan, M. Gallant, V. Stern, A. Pawlak and C. Alexandrakis.


Join the Conversation
Interested in starting, or contributing to a conversation about an article or issue of the RECORDER? Join our CSEG LinkedIn Group.
Share This Article