Abstract
We investigated the aftershock decay rate of the two largest injection-induced earthquakes (IIEs) ever recorded in northeast British Columbia that occurred on August 17, 2015 (MW (moment magnitude) 4.6, ML (local magnitude) 4.9) and November 30, 2018 (MW 4.5, ML 4.7). These earthquakes are temporally and spatially correlated with hydraulic fracturing (HF) operations in the region. To conduct this study, we prepared a dataset of 134 aftershocks for the first sequence (Mahani et al., 2017) and 112 aftershocks for the second sequence (Visser et al., 2019). Their magnitude range is mainly between 1.0 and 3.0 and most of the events occurred at very shallow depths. We analyze the first two weeks of the two aftershock sequences to better characterize the significant decay of seismicity with time. Our analysis indicates that the aftershock decay rate of the 2015 (MW 4.6) earthquake sequence is characterized by a p value of 1.24. The seismicity decay rate is much faster for the 2018 (MW 4.5) sequence with a p value of 2.68. Overall, we find that the decay rate of aftershock activity of large IIEs and tectonic earthquakes similarly obey the modified Omori law with different p values. After termination of injection, our observed aftershock decay rate is approximated by the modified Omori law with an increased p value (p > 2), similar to the case of seismicity decay rate for stable pre-existing fractures in reservoirs (Langenbruch & Shapiro, 2010). In the presence of limited injection operations in a different geological setting, we observed a lower p value. Therefore, we speculate that geomechanical characteristics of pre-existing fractures and the operational parameters of nearby injection operations may be the main factors controlling the range of p value and consequently the seismicity rate of aftershocks.
Introduction
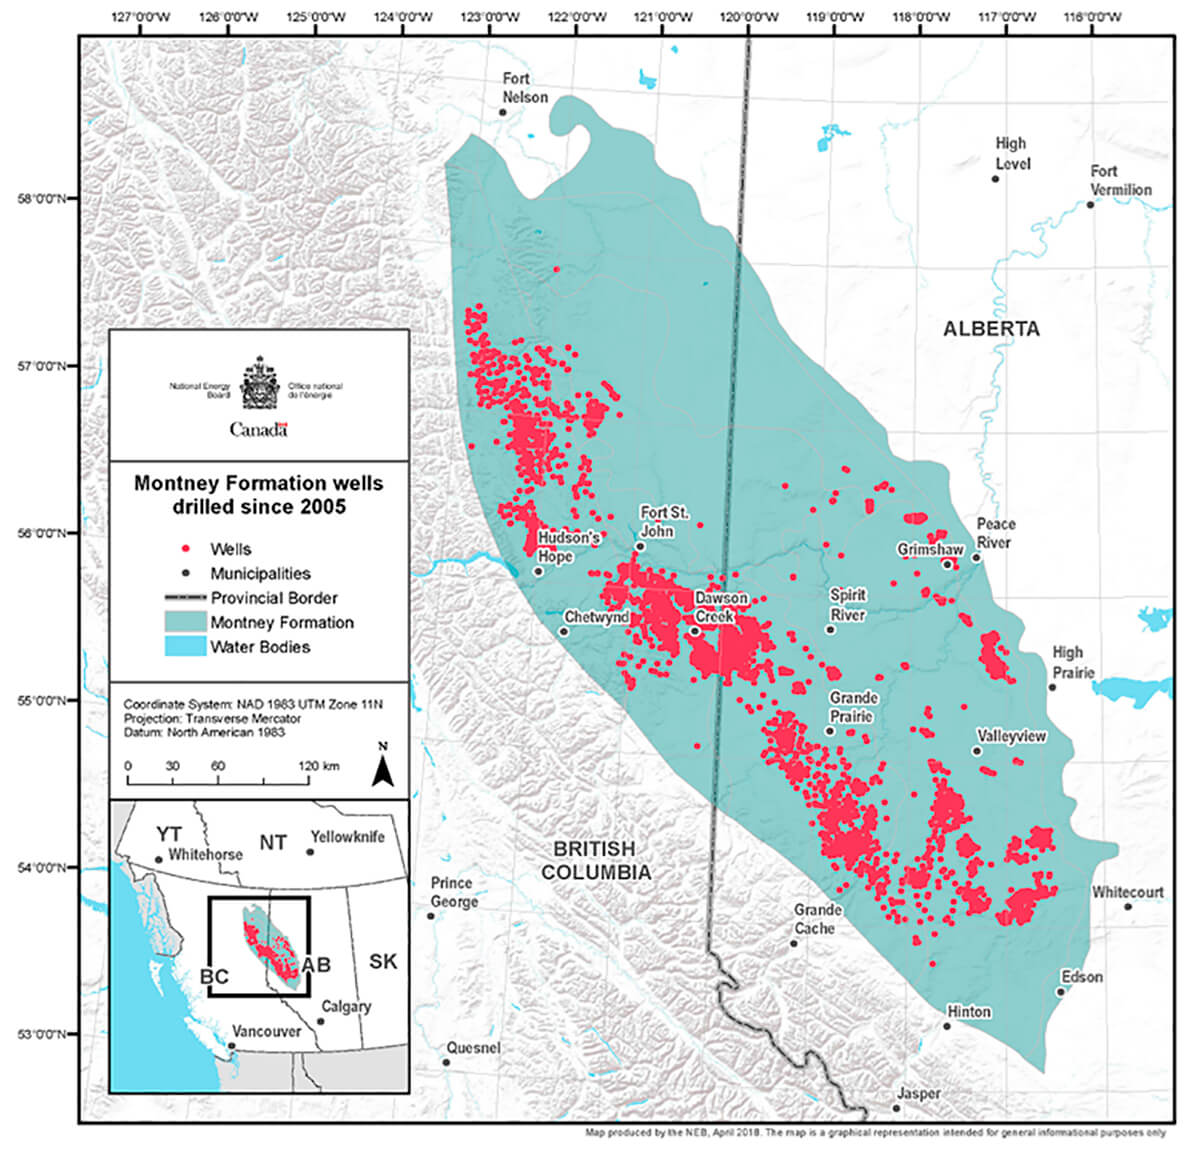
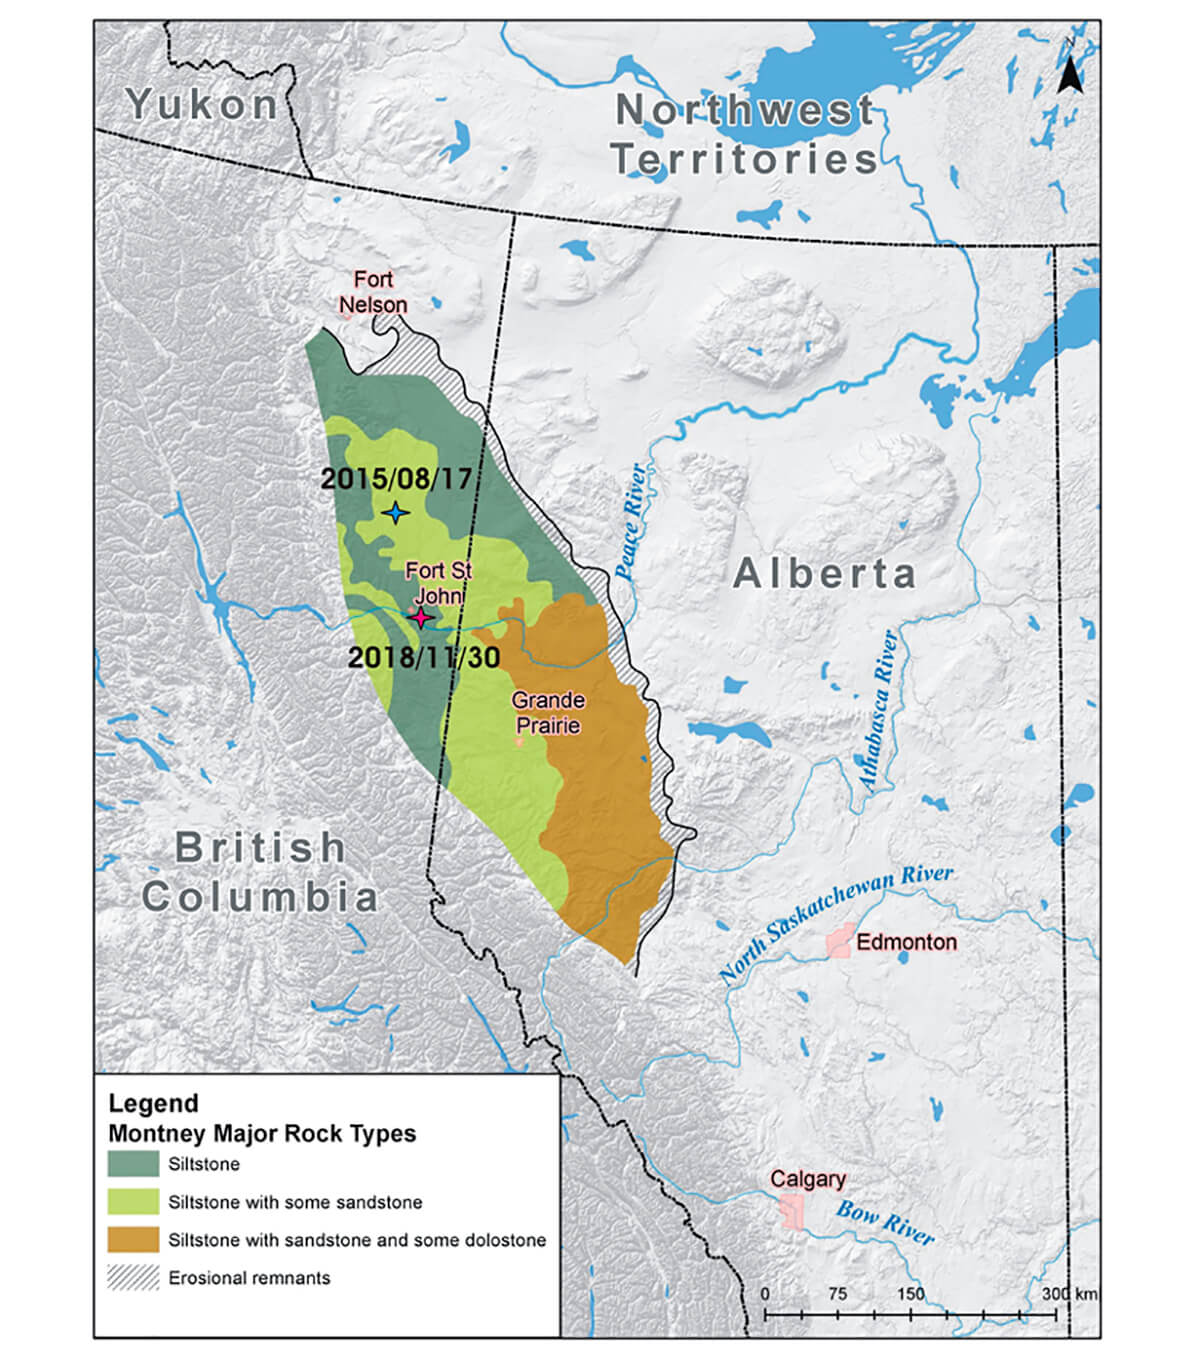
British Columbia (BC) has produced both natural gas and crude oil since 1952. However, innovations have led the industry to focus on the development of unconventional hydrocarbon resources in northeast BC that consequently contributes to increased seismicity in areas of intense injection operation (Atkinson et al., 2016; Farahbod et al., 2015a&b). Among those areas, the Montney play (Figure 1) is recognized as one of the largest shale gas fields in North America and contains about 449 trillion cubic feet of marketable natural gas (National Energy Board Report, 2013). Multi-stage HF for developing unconventional shale gas began in July 2005 in the Montney play (BC Oil and Gas Commission, 2012). Since then, there have been several significant M4+ earthquakes in the region that are considered HF-related (Kao et al., 2018). The two largest events occurred on August 17, 2015 (MW 4.6) and November 30, 2018 (MW 4.5). More frequent large IIEs in northeast BC underline the greater role of aftershock monitoring for seismic risk assessment and upgrading the regional seismic hazard model.
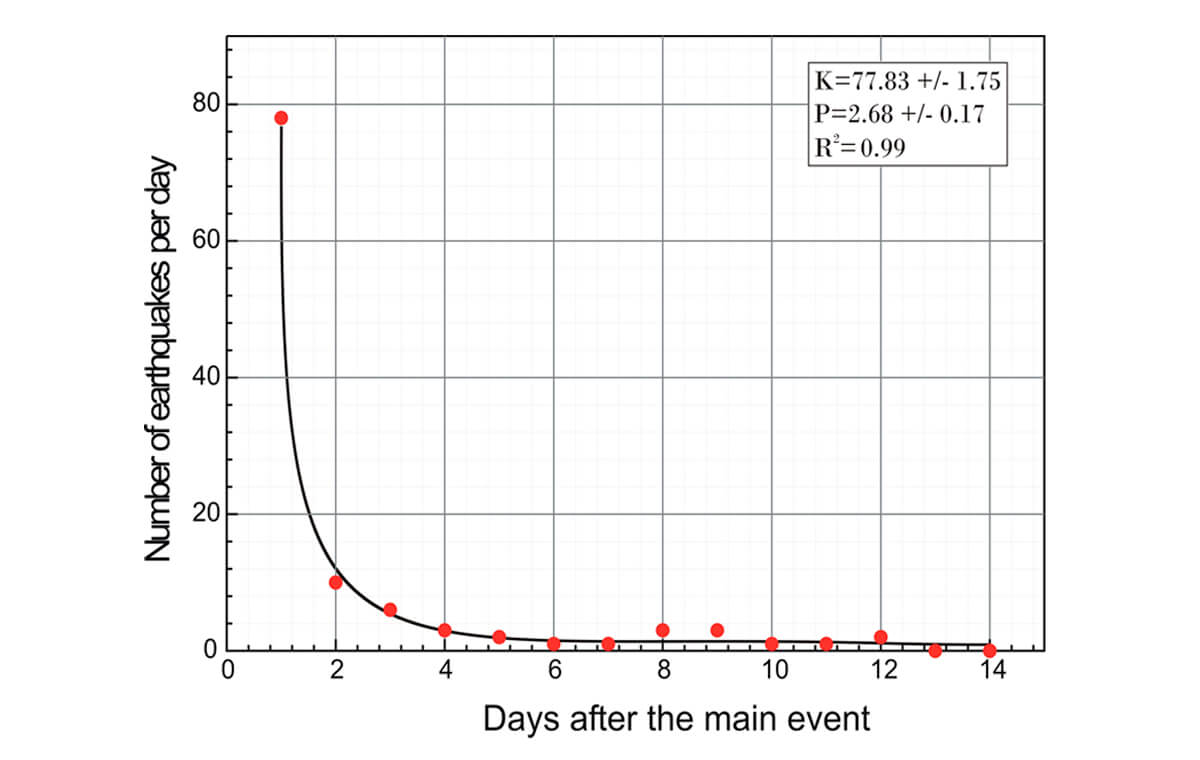
In general, aftershock activity of tectonically driven earthquakes is described by the Omori law (Omori, 1894; Utsu et al., 1995). The Omori formula [n (t) = K (t)-1] or its modified form [n (t) = K (t+c)-P], where n(t) is the frequency of aftershocks and K, c, and p are constants, can also be applied to fluid-induced seismicity, but in this case the p value (usually between 0.9 and 1.5) will increase significantly (p > 2) to approximate post-injection seismicity (Langenbruch and Shapiro, 2010). The c value is generally a very small number (close to zero) and highly sensitive to the incompleteness of catalog and cutoff magnitude (Utsu et al., 1995). Overall, the modified Omori law depends on the strength of the pre-existing fracture system, the hydraulic diffusivity of the reservoir rock, and the strength and duration of the fluid injection (Langenbruch and Shapiro, 2010).
In this article, we try to apply the modified Omori law to describe the aftershock sequences of the two largest IIEs in the Montney play and examine how well they are approximated and how post-injection conditions affect the fit.
Data and Analysis
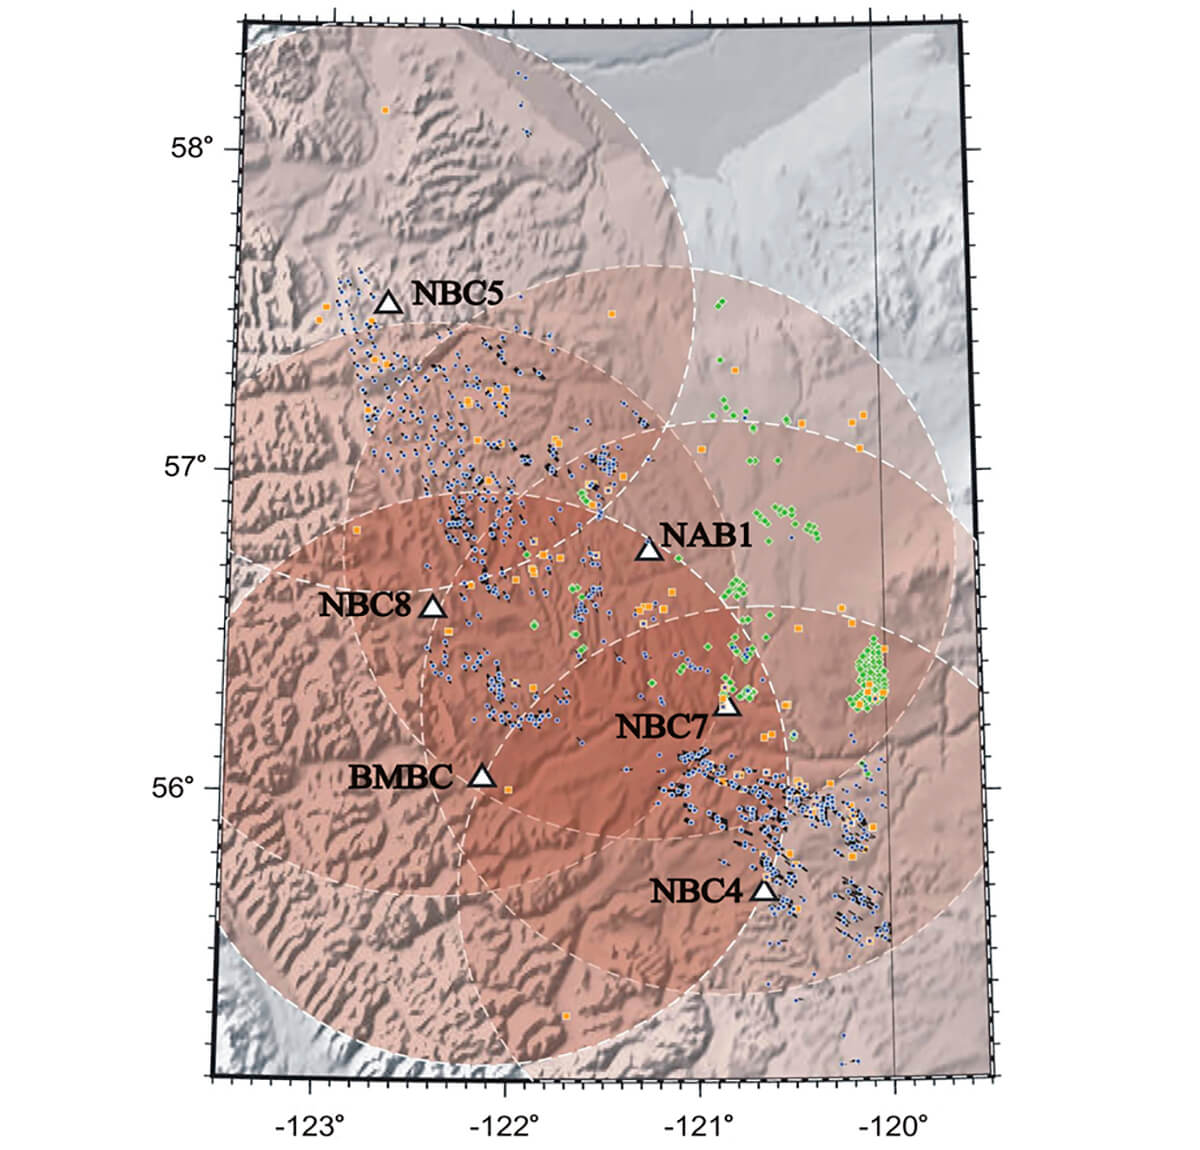
To conduct this research, a comparison was made between two separate databases, i.e., earthquake information reports and injection-operation databases. Due to different cutoff magnitudes of the two sequences and for simplicity, we consider c = 0 in the modified Omori formula. Information about injection parameters such as well locations (Figure 2), rate, volume and duration of operations have been provided to us by the BC oil and gas commission (BCOGC) based on reports that were submitted by operators. Comprehensive earthquake catalogs that were specifically prepared for the region of northeast BC and western Alberta (Visser et al., 2017; Visser et al., 2019) are the main source of earthquake information for this study. Also, we benefited from an earthquake catalog that was provided by Progress Energy based on local seismic data for the 2015 (MW 4.6) earthquake sequence (Mahani et al., 2017).
In practice, we searched all events with magnitudes greater than or equal to 3.5 in the Montney play from the beginning of May 2013 (the first day in our injection-operation database) until the end of December 2018. For each event, we searched for nearby injection wells within 25 km of the epicenter. This search was done to see if there were active injection wells either on the same day as the earthquake or the day before. For the wells that qualified, we selected those that were not active during the day after the earthquake and did not have any stages for at least 7 days afterwards. We found 4 out of 17 possible events from HF operations that successfully met these criteria and 4 others that were associated with waste-water disposal (WD) operations. The other 9 events had HF operations within the area but were removed because either the injections were suspended after the main events but became active again within 7 days (usually after only a few days), or they were never stopped because the main event was not big enough to trigger a red light.
Finally, from the eight qualified events we only picked the two largest ones that occurred on August 17, 2015 (MW 4.6, ML 4.9) and November 30, 2018 (MW 4.5, ML 4.7) due to very limited reports of aftershock activity for the remaining six events.
The largest aftershock of the first event occurred on September 02, 2015 and had a moment magnitude (MW) of 3.6. On the other hand, the main event in the second sequence (November 30, 2018) was followed by two relatively large events (ML 3.3 and ML 3.9) within an hour. In this case, the largest aftershock was only 0.8 units smaller than the main event.
The difference in magnitude between a mainshock and its largest aftershock has been the topic of several studies in the past (Bath, 1965; Vere-Jones, 1969; Console et al., 2003; Helmstetter & Sornette, 2003; Shcherbakov & Turcotte, 2004). This difference constitutes the so-called Bath’s law and is considered to be a constant, between 1 and 1.2, independent of the mainshock magnitude (Bath, 1965). It should be noted, however, that Bath’s law is a statistical statement and does not strictly apply to individual aftershock sequences. By using the so-called modified Bath’s law which is a combination of the Gutenberg-Richter distribution and Bath’s law (Shcherbakov & Turcotte, 2004), it is possible to explain a Δm = 0.8 difference in magnitude between a mainshock and its largest aftershock (Shcherbakov et al., 2012).
Results
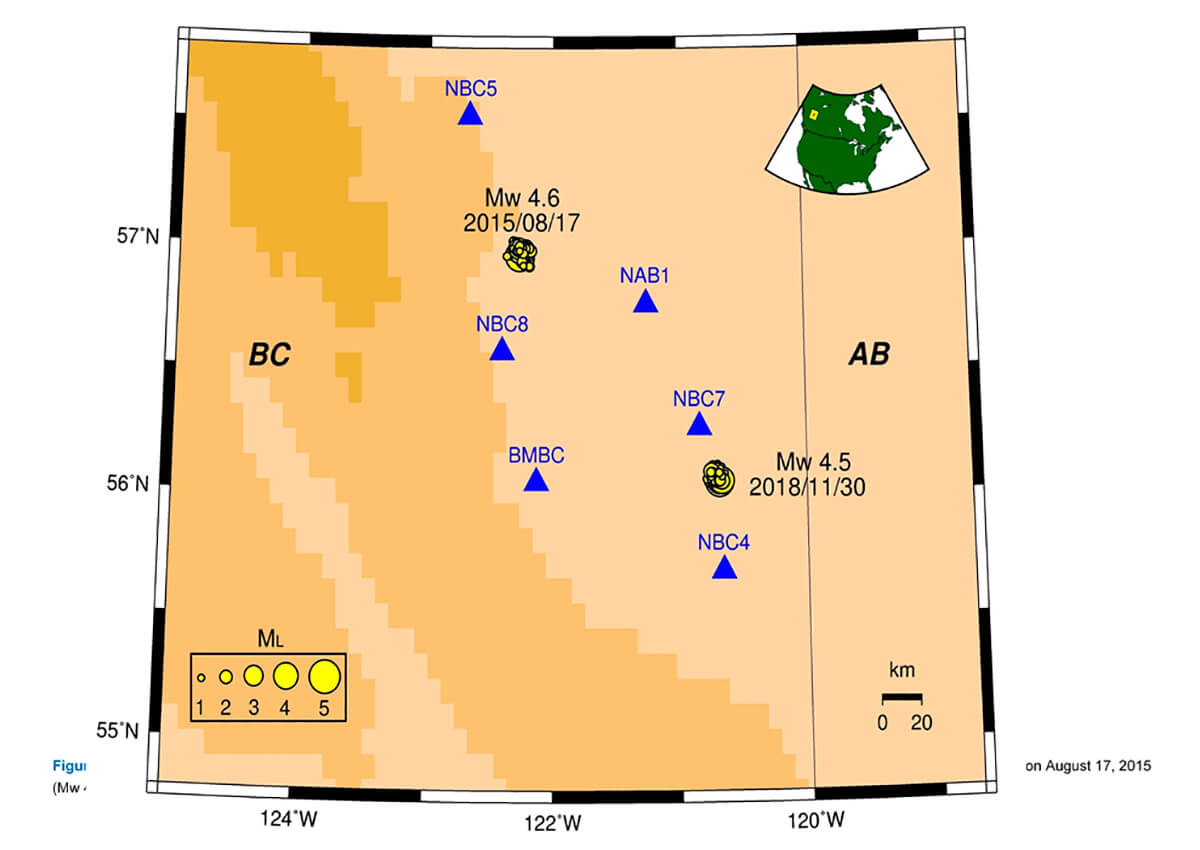
The first earthquake sequence that we considered in this study started with the largest ever recorded IIE (in NE BC) as a result of HF operations on August 17, 2015 (Mw 4.6, ML 4.9) (Figure 3). For this case, seismograms recorded by the Canadian National Seismograph Network (CNSN) were revisited (Visser et al., 2017) to improve the completeness of the catalog and ensure the accuracy of derived source parameters.
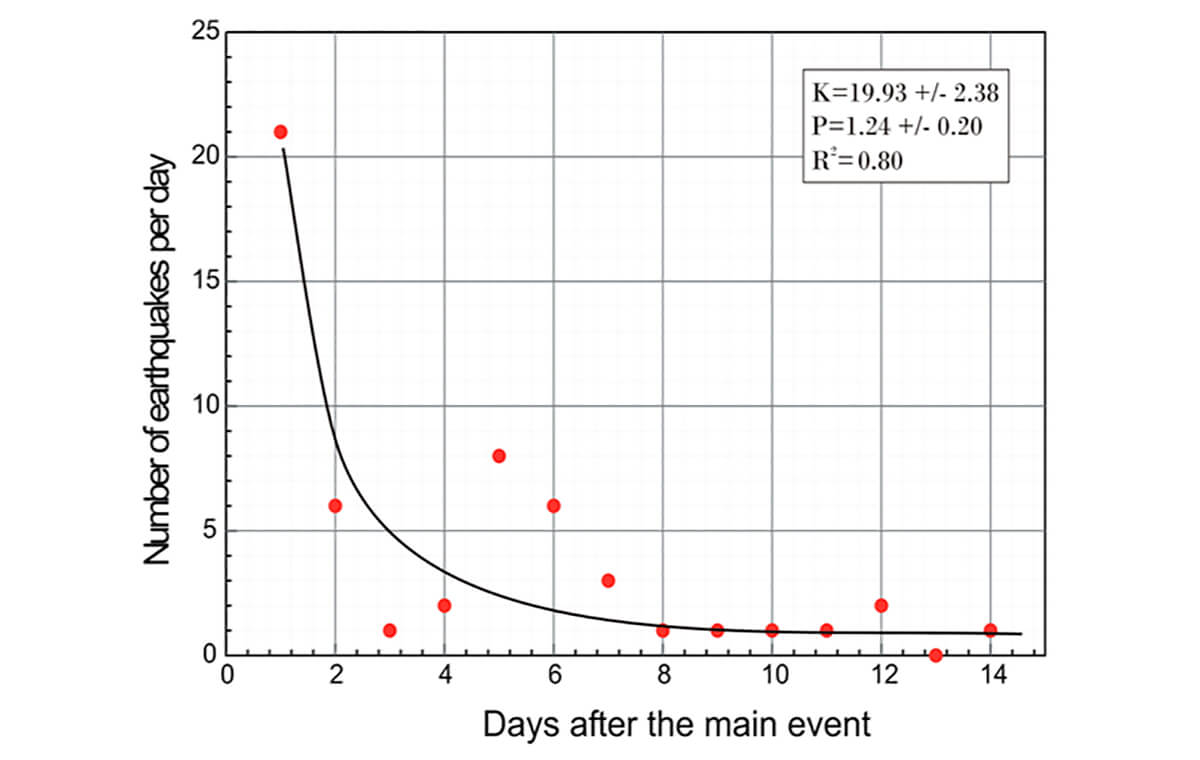
We analyzed only the first two weeks of the sequence to better characterize the significant decay rate in seismicity with time. The mainshock and its 134 aftershocks are considered to be very shallow (majority of focal depths fixed at 1 km) with magnitude ranging between 1.0 and 3.6. The aftershock decay rate of this earthquake sequence is characterized by a p value of 1.24 ± 0.20 (Figure 4).
The second earthquake sequence that we investigated is located southeast of the 2015 cluster (Figure 3) with 112 aftershocks in our database (Visser et al., 2019). Similar to the first earthquake sequence, the second one is also related to nearby HF operations and seismicity is concentrated at very shallow depths. The magnitude of aftershocks ranges from 0.5 to 3.9 with 80% of the samples falling between 1.0 and 3.0. For this sequence, the aftershock decay rate in the first two weeks after the main event is characterized by a p value of 2.68 ± 0.17 (Figure 5), which is more than double of that in the 2015 (MW 4.6) sequence. The larger p value represents a much faster decay rate.
Discussion and Summary
It has been demonstrated that the decay rate of seismicity after termination of reservoir stimulations is strongly dependent on the strength of pre-existing fractures in the reservoir rock and on injection parameters (Langenbruch and Shapiro, 2010). If the strength of a fracture system is weak, then the fracture system is close to failure and the p value is low (~1). In this case, seismicity decays slowly after the termination of injection. In the case of a highly stable fracture system, the seismicity rate increases during the injection and early post-injection phase. The decay rate of seismicity after injection can be approximated by a modified Omori law with increased p value larger than 2 (Langenbruch and Shapiro, 2010).
In the Montney Basin, with a relatively long history of oil and gas extraction and a record number of relatively large induced events (M ≥ 3.5), it would be of great importance to investigate the decay rate of seismicity in order to develop a more realistic seismic hazard model. In this regard, we carefully searched available catalogs and investigated seismic activity after larger IIEs (M ≥ 3.5).
Despite the major upgrade of the CNSN in northeast BC in recent years and deployment of many new stations (Farahbod et al., 2014), the available earthquake catalogs, including both the Canadian National Earthquake Database (available from the EarthquakesCanada.ca website) and those published by NRCan’s Induced Seismicity Research Project (Visser et al., 2017 & 2019), are still incomplete for events with M < 1.5. Therefore, there are only a few relatively large IIEs with enough reported aftershocks for a sound statistical analysis. This problem can be potentially solved by establishing closer collaborations among government, academia, and industry such that local and/or private datasets are made available for induced seismicity research. With a combined dataset consisting of both public stations and private arrays, a significantly greater degree of completeness in the earthquake catalogs and improved accuracy of source parameters can be achieved.
Another potential issue for the study of IIE aftershock sequences is that in many cases after the occurrence of the mainshock, injection operations are not stopped long enough (or not stopped at all if the magnitude is below the red-light threshold) for monitoring aftershock activities. The additional injections can cause more IIEs to mix with the aftershock sequence, making the separation of aftershocks and independent IIEs virtually impossible. This can seriously affect the estimation of the p value that, in turn, influences the performance of regional seismic hazard models.
In this study, we obtained a p value of 1.24 for the August 17, 2015 (MW 4.6) earthquake sequence that is similar to the case of a reservoir when the strength of the fracture system is weak (Langenbruch and Shapiro, 2010). The November 30, 2018 (MW 4.5) earthquake sequence is characterized by a higher p value of 2.68, presumably corresponding to stable pre-existing fractures. Overall, our results suggest that different characteristics of the aftershock sequences are observed for the two largest HF-related IIEs in northeast BC. We hypothesize that such different aftershock patterns, despite the similar size of the mainshock, may be due to their different geological settings (Figure 6). This highlights the importance of systematic, long-term microseismic monitoring around active injection sites. Further research on the variation of aftershock decay rate of relatively large IIE sequences is needed to fully understand the physical relationship between the seismogenesis of IIE and possible controlling factors used in geo-mechanical models.

Acknowledgements
We thank Ryan Visser, Alireza Babaie Mahani, and Stuart Venables for their technical assistance. Seismic and injection data used in this study are provided by the Canadian Hazards Information Service of Natural Resources Canada (NRCan), the Induced Seismicity Research Project of NRCan, and the British Columbia Oil and Gas Commission. Seismic Analysis Code (SAC) and the Generic Mapping Tools (GMT) were used in data processing and figure plotting. This study is partially supported by NRCan’s Energy Innovation Program, NRCan’s Induced Seismicity Research Project under the Environmental Geoscience Program, and a NSERC Discovery Grant (to HK). This paper is NRCan contribution 20190324.


Join the Conversation
Interested in starting, or contributing to a conversation about an article or issue of the RECORDER? Join our CSEG LinkedIn Group.
Share This Article