Summary
High-resolution aeromagnetic (HRAM) data from the south-central Alberta Foothills were processed to enhance near-surface sources of magnetic anomalies and suppress regional gradients. The processed HRAM anomalies are not related to the topography and are induced by the magnetic properties of the rock units underlying the survey area. Siliciclastic strata dominate the surface geology; they have low magnetic susceptibility (10-5 – 10-2 SI) and therefore induce small magnetic anomalies, ranging between 9.8 and –10.8 nT. A remarkable correlation can be observed between lithostratigraphic units and HRAM anomalies. Short ground magnetic profiles show good correlations between the magnetic anomalies, lithology, structure and the measured magnetic susceptibilities of the outcropping sedimentary rocks.
The magnetization model constructed to reproduce the HRAM data generates anomalies that closely match the observed values and reflects the structural and lithological complexity of the study area. HRAM data show the different magnetic signatures of the Middle Blairmore, Brazeau and Lower Coalspur strata and can be used to effectively map near-surface lithology and structure.
Methods
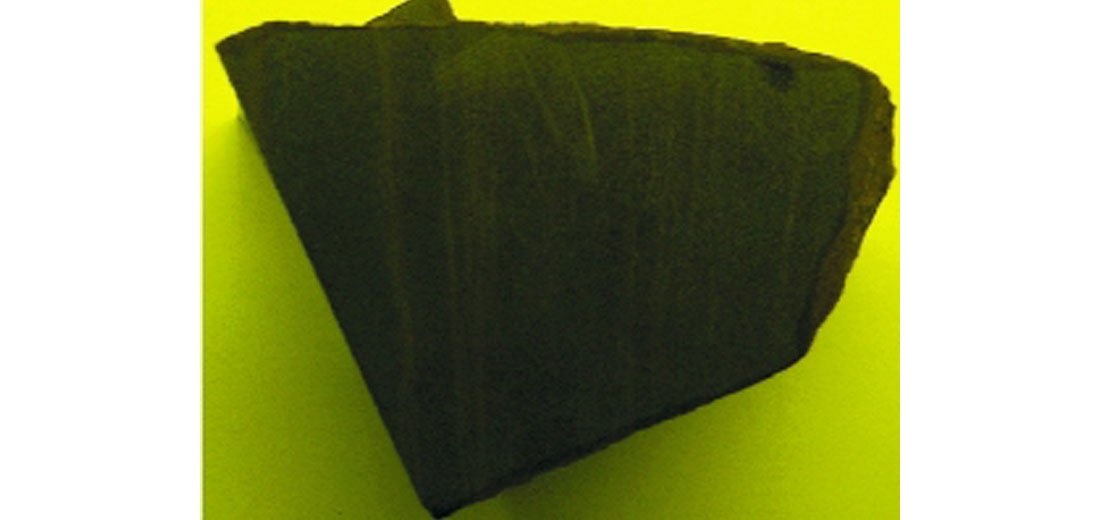
The surface geology, topographic and well data from the study area were compiled using MapInfo GIS software. Field and laboratory magnetic susceptibility measurements were carried out to determine the magnetic properties of the sedimentary strata from the area. A limited petrographic study was undertaken to identify the mineralogical components of the Cretaceous non-marine sandstones from the area. To establish the exact composition of the detrital opaque minerals, three polished sections were used for electron microprobe analysis.
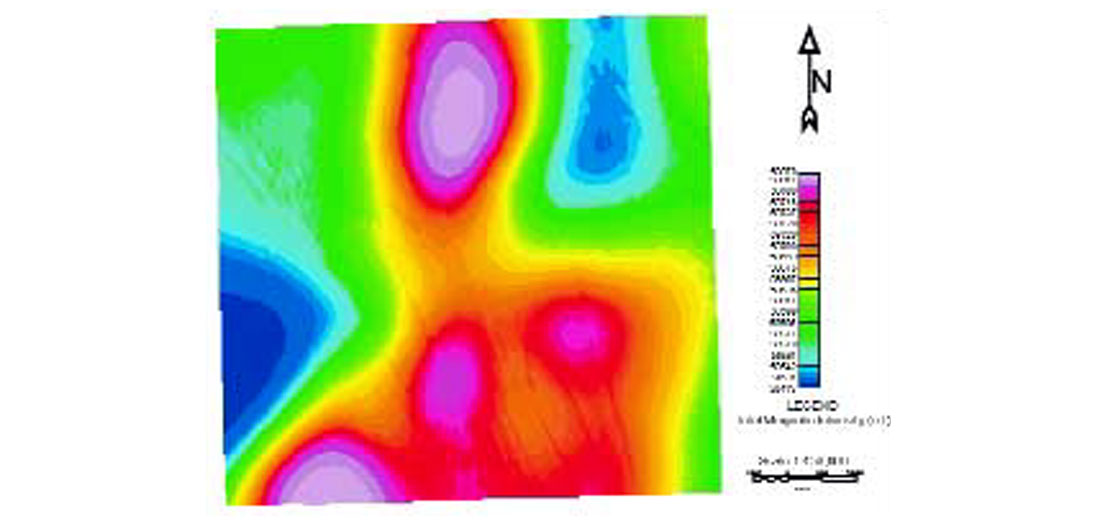
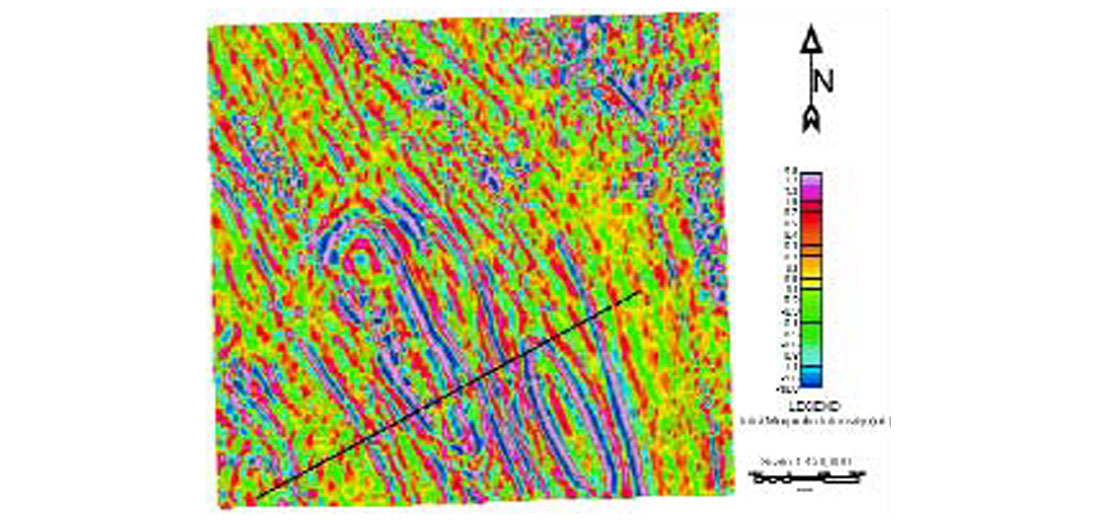
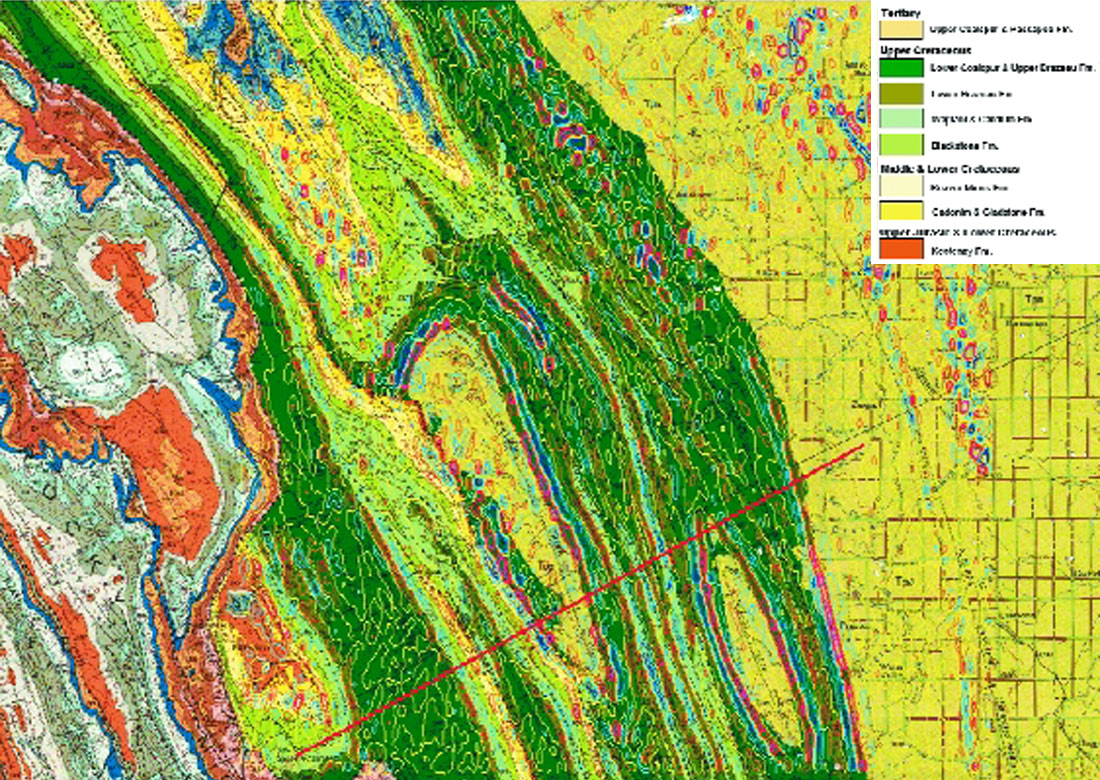
The HRAM data (Figure 1) were processed using different filtering techniques to enhance the shallow, high frequency features, and to suppress the regional gradients. The best results were obtained using a spatial band-pass filter 0.3125 – 1.25 km-1 (800 - 3200 m wavelength), with the output shown in Figure 2. The filtered magnetic anomalies were contoured and displayed over the surface geology data. The information obtained was utilized to constrain a 55.35 km long cross-section that was used to model the magnetic anomalies.
Field magnetic susceptibility measurements
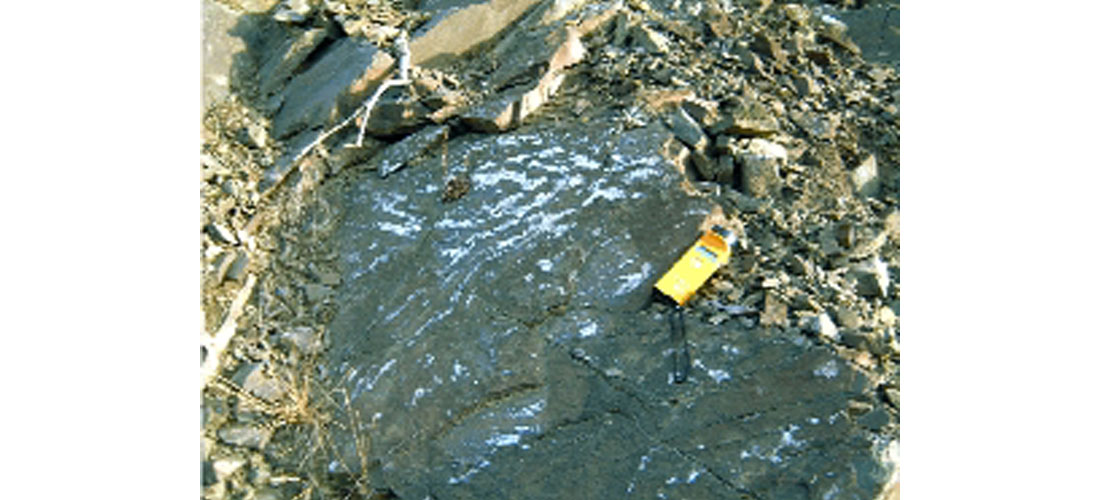
We know of no magnetic susceptibility measurements previously made on Alberta Foothills sedimentary strata and the only data available were the published range values for different sedimentary rock types (Schön, 1989). The field magnetic susceptibility measurements were carried out using a portable hand-held KT-6 magnetic susceptibility meter, which has a maximum sensitivity of 1 x 10⁻⁵ (SI units) and allows measurements of very low susceptibility levels in sedimentary rocks. The magnetic susceptibility measurements were completed on all the major lithostratigraphic units at 122 stations across the research area. In every station, 20 to 110 measurements were carried out to determine the magnetic susceptibility values of the rocks (mostly sandstones) exposed in the outcrop. Due to the random distribution of the magnetic minerals in sandstones and the roughness of the rock surfaces, sometimes the magnetic susceptibility values within the outcrop vary significantly (up to 200 times). A summary of the magnetic susceptibility values for each formation is presented in Table 1.
The field measurements show the highest magnetic susceptibility values within the Brazeau and lower Coalspur sandstones. These rocks commonly exhibit higher magnetic susceptibility values (0.20 to 28.0 x 10⁻³) than the underlying Alberta Group and the overlying upper Coalspur and Paskapoo strata (0.08 to 0.25 x 10⁻³). Thin, 0.2-0.3 m thick iron nodule layers within Alberta Group strata display magnetic susceptibility values of 1.2 to 1.8 x 10⁻³, contrasting with the surrounding low magnetic susceptibility shales (0.05 to 0.18 x 10⁻³). Higher magnetic susceptibility values (0.25 to 5.6 x 10⁻³) were measured on sandstone on outcrops of the Beaver Mines Formation (middle Blairmore Group). In the Limestone and Marble mountains areas, the magnetic susceptibility of the diamagnetic carbonaceous rocks ranges from – 0.12 to – 0.15 x 10⁻⁴.
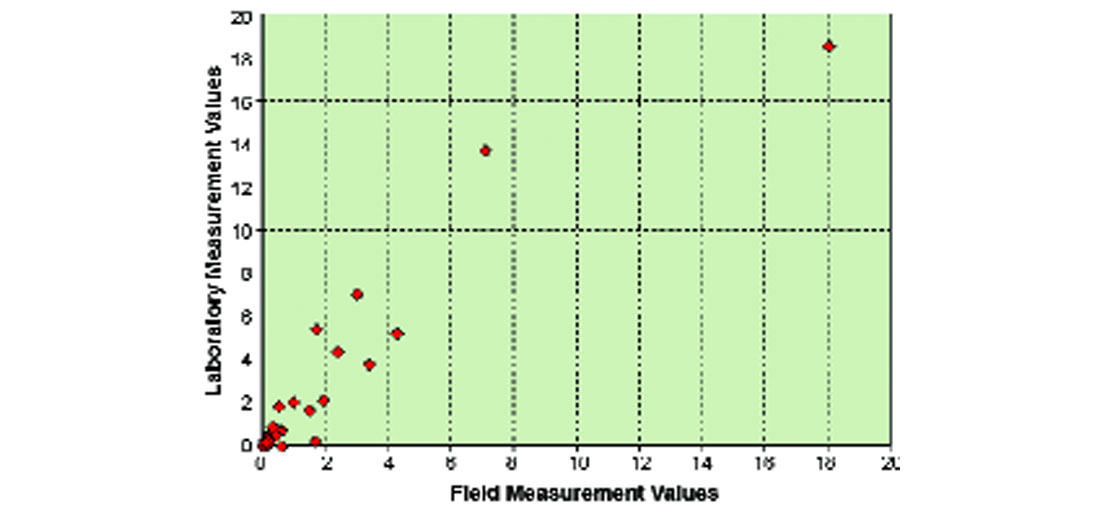
The field magnetic susceptibility measurements were compared with laboratory determinations carried out on field samples from the measured outcrops. The measurements were completed in the University of Calgary Rock Properties Laboratory using an MS2 magnetic susceptibility system. These laboratory magnetic susceptibility values show good correlation with the field results, especially for the higher values encountered in the Brazeau sandstones (e.g., 18.52 x 10⁻³ vs. 18.01 x 10⁻³), and for the lower susceptibility values measured in the shale and carbonate strata (Figure 7).
Interpretation
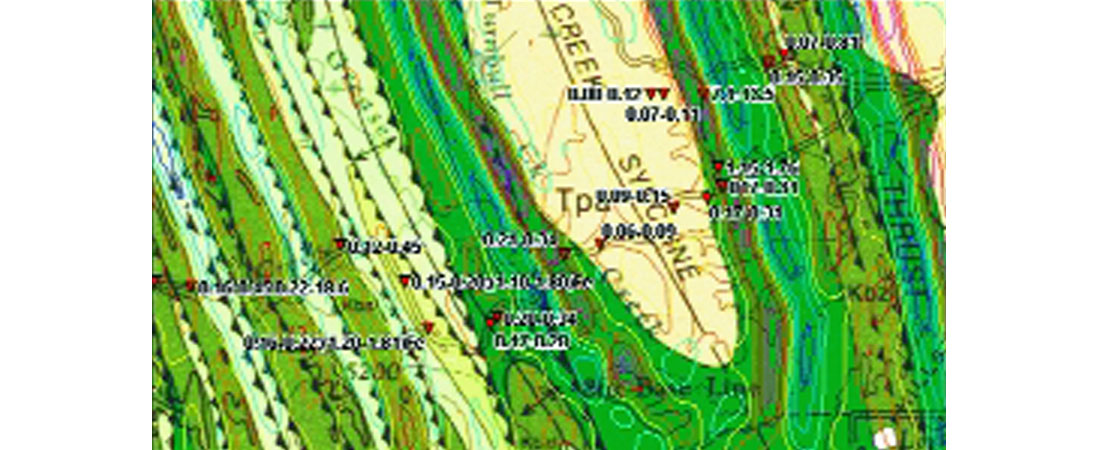
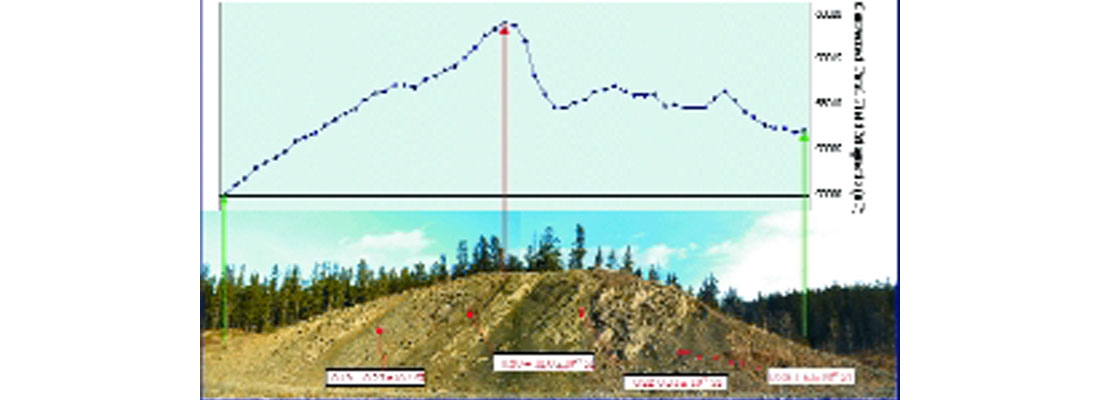
Cretaceous siliciclastic strata dominate the surface geology of the study area; their magnetic susceptibility range from 10-5 to 10-2 SI and therefore low magnetic anomaly values (ranging between 9.8 and –10.8 nT) were recorded over the area. The processed HRAM data highlight the structural complexity of the area as variations in magnetic intensity, irregular patterns, and offsets or changes in strike direction (Figures 2 and 6). The magnetic anomalies originate in Cretaceous Middle Blairmore (Beaver Mines Formation) and post-Wapiabi strata (Lower and Upper Brazeau and Lower Coalspur) and appear to increase in intensity at the contact with the Tertiary Upper Coalspur Formation and with the underlying Alberta Group rocks. The Tertiary, Middle Cretaceous and Jurassic strata and the Palaeozoic carbonates exhibit low magnetic anomalies (-1.0 nT) with rare higher values probably due to cultural responses (Figure 6). The field and laboratory magnetic susceptibility measurements show good correlation with the observed HRAM anomalies (Figure 8, Table 1). Short ground magnetic profiles show good correlations between the magnetic anomalies, lithology, structure and the measured magnetic susceptibilities of the underlying sedimentary rocks (Figure 9).
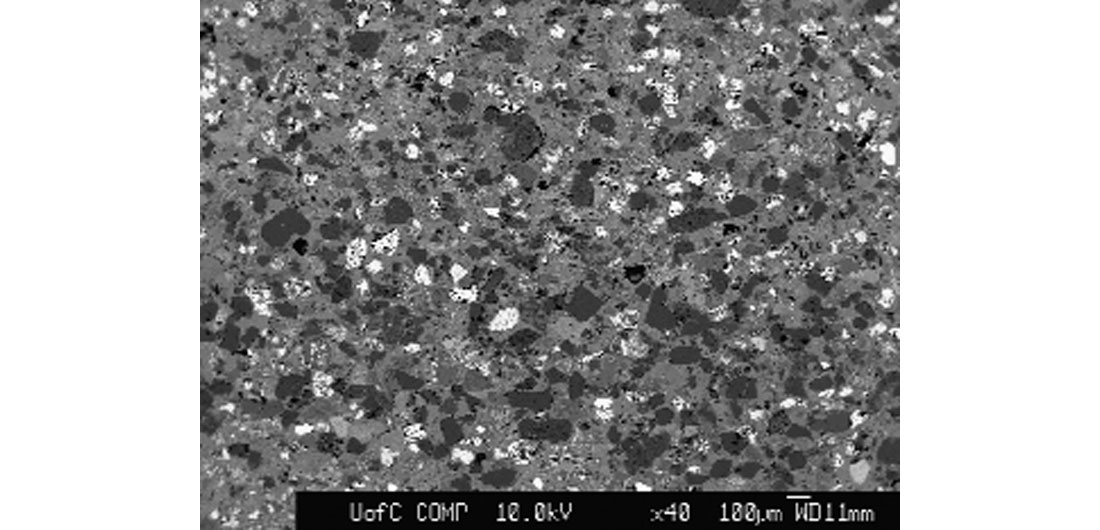
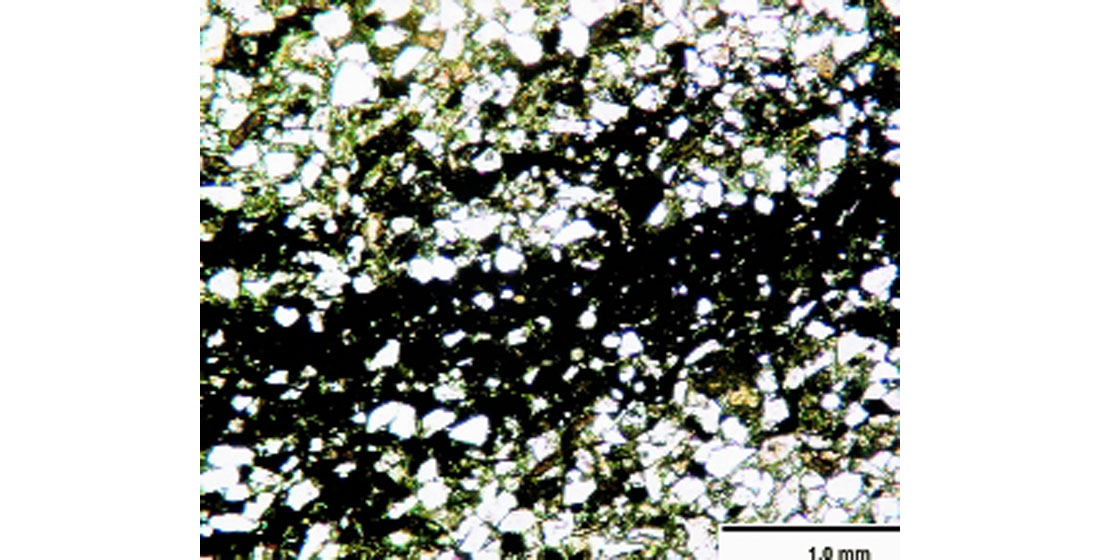
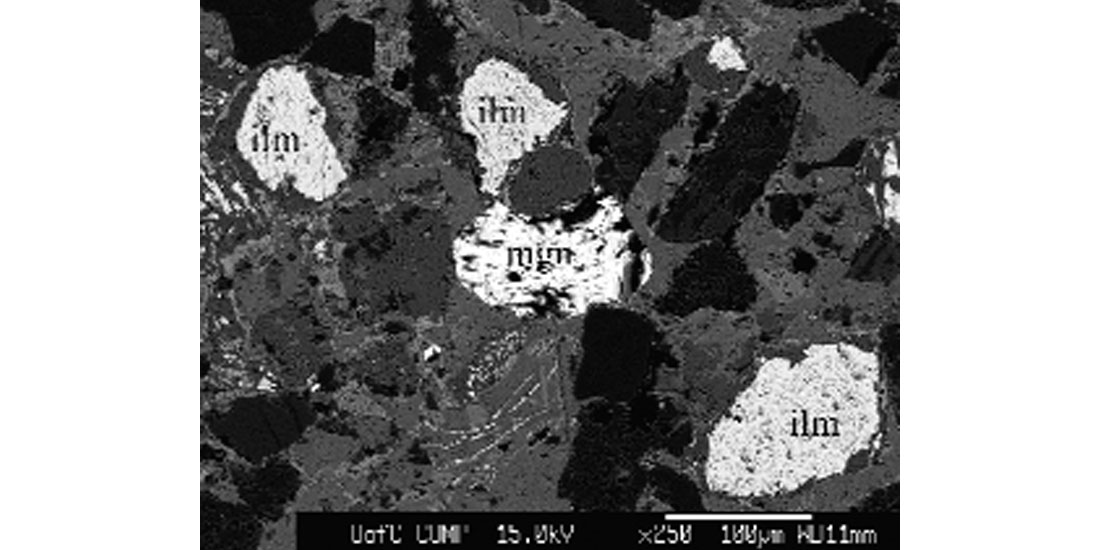
The occurrence of HRAM anomalies associated with Middle Blairmore, Brazeau and Lower Coalspur strata is interpreted to be related to their depositional history and petrographic compositional stages in the Beaver Mines and post- Wapiabi sandstones of the southern and central Alberta Foothills (Mellon, 1967; Mack and Jerzykiewicz, 1989). Petrographic and electron microprobe analysis show that Beaver Mines, Brazeau and Lower Coalspur sandstones contain significant amounts of magnetite and ilmenite and rare grains of chromite (Figures 10, 11 and 12).
Modelling of the HRAM Data
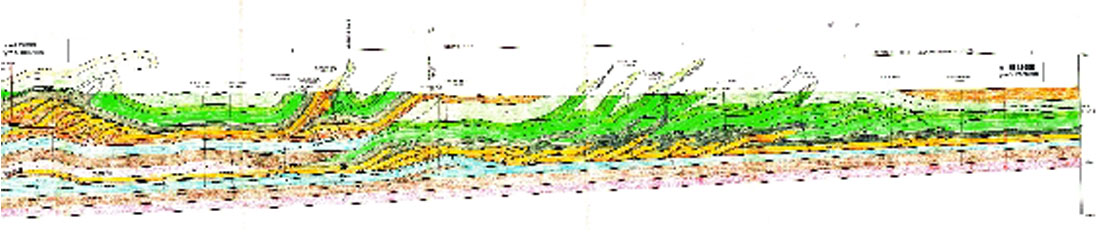
A 2-D geological model (Figure 13) representing a 55.35 km vertical section across the study area was constructed based on an existing model (Figure 13) that was constrained with well data, interpreted seismic data and mapped surface geology (Soule, 1993). The model comprises five lithostratigraphic successions: Cambrian-Early Albian, Middle Albian, Late Albian-Early Campanian, Late Campanian – Late Maastrichtian and Tertiary. Seventeen thrust faults and two backthrusts describe the structural complexity of the study area. Between one and three sandstone layers were assigned within the Brazeau and Coalspur strata. The Cambrian-Early Albian and Late Albian-Early Campanian successions were amalgamated in one lithostratigraphic unit due to the similarity of their magnetic properties (Figure 14). The magnetic susceptibilities were assigned based on published and measured values.
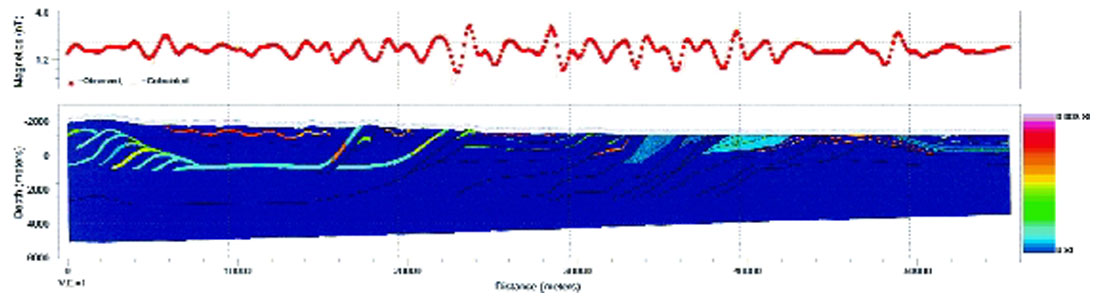
Forward magnetic modelling was undertaken using GM-SYS software, based on the algorithms described by Won and Bevis (1987) and Rasmussen and Pedersen (1979). The final model comprises 102 magnetization blocks and is presented in Figures 14 and 15. The magnetic susceptibility values assigned to each block range from 0 to 0.003 SI. Figure 14 displays the ‘best fit’ geological model and Figure 15 presents the magnetic susceptibility model for the ‘best fit’.
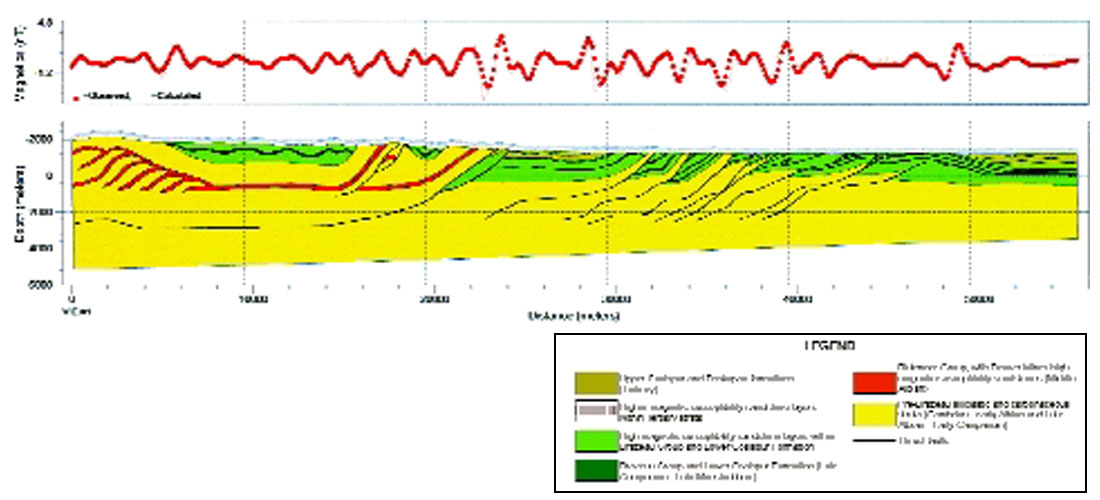
The modelled Beaver Mines, Brazeau and Lower Coalspur strata contain most of the blocks that have higher magnetic susceptibility values (Figures 14 and 15). The highest values were assigned to the sandstone layers (up to 3 x 10⁻³ SI) that contain detrital magnetic minerals. It should be noted that the calculated and observed magnetic values are matched well by magnetization models of the Blairmore, Brazeau and Coalspur strata (Figure 14). In modelling the observed HRAM anomalies the Palaeozoic, Triassic, Jurassic and part of the Cretaceous strata were assigned zero magnetic susceptibility due to their weak magnetic signature observed in the aeromagnetic data. However, low magnetic susceptibility values (in the same range as those measured and/or published) for the sedimentary strata situated at or below 1000 m depth will not induce any magnetic anomalies detectable at the surface. Examination of Figure 14 shows that the magnetization model constructed to reproduce the HRAM anomalies closely matches the observed values and reflects the structural and lithological complexity of the study area.
Conclusions
The modelling and interpretation of high-resolution aeromagnetic data can assist in mapping lithostratigraphy and structure in structurally complex areas if the magnetic properties of sedimentary strata are known. In fold and thrust belts HRAM data may be used in early stages of exploration to map the near-surface lithology and geological structure between 2D seismic lines, and to assess the provenance of magnetized rocks.

Acknowledgements
We wish to thank GEDCO, Fugro Airborne Surveys, EnCana and AltaLIS for donating the data to this study. Thank you to Deborah Spratt, Art Sweet, Rudy Meyer, Robert Marr, Jean-Michel Maillol, Larry Lines, John Peirce, Hassan Hassan and John Rhodes for their assistance and input into this project.


Join the Conversation
Interested in starting, or contributing to a conversation about an article or issue of the RECORDER? Join our CSEG LinkedIn Group.
Share This Article