Water is integral to our economy, the health of our environment, and a necessity for all life forms and human development. Most water is accessed from surface sources, primarily rivers, which are now under increased threat due to over use and growing hydro-political forces. Still, groundwater exists as a viable option in many countries facing these mounting challenges. Knowledge of our deeper groundwater systems, although increasing, is still quite limited due to our propensity to focus efforts in the lower cost, lower risk, near-surface environment. Accessibility to shallow groundwater is tightening due to increasing use, changing regulatory requirements, and climate change.
The use of classical geophysics to explore for groundwater resources, such as seismic, gravity, magnetics, and resistivity, has been the industry standard for many decades. Classical technologies have proven quite effective in both the shallow and medium depth environments. However, newer space-based, and earth-based sensing technologies are now emerging that are more efficient, effective, and economical relative to classical technologies for groundwater exploration and development programs, while causing little to no environmental impact.
Quantum Direct Matter Indicator (QDMI) technologies, or applied methods of Quantum Geoelectrophysics (QGEP), are poised to enhance the hydrogeophysical industry, much like electromagnetic (EM) and electrical resistivity tomography (ERT) did decades ago. QDMI utilizes resonant frequency remote (via satellite) and earth-based direct sensing technologies that detect perturbations in the earth’s natural electric, magnetic, and electromagnetic fields. Controlled source electromagnetic pulse methods with electromagnetic spectrum spectroscopy analysis are used to identify aquifers, including their thickness, quality of water (fresh or saline) and temperature characteristics accurately to depths of 1000 m or more.
With multiple successes around the world, the deployment of this inventive, innovative, and effective approach to groundwater exploration is poised to advance exploration geophysics globally. This article provides a background on this emerging technology and presents a recent case study in Mexico where the technique was successful in deciphering a complex aquifer system being accessed for industrial water supply.
History of Quantum Geoelectrophysics
The concept of utilizing electric and magnetic fields for evaluation, exploration and development of natural resources was first discussed in the 1920’s by the Schlumberger brothers. In North America, Harvey C. Hayes, in 1940, developed one of the earliest electrical field prospecting methods. His patent (Hayes, 1940) “Electrical Prospecting”, set forth a method to determine the probable boundaries of oil-bearing formations, along with their depths, inclinations, and distributions. Hayes theorized that lighter hydrocarbon components tend to slowly migrate upward towards the surface and this may be the cause of the electromotive forces. Hayes also relates the magnitude of the electric field survey to the temperature and pressure conditions within the hydrocarbon bearing structure. Geochemical soil analysis work of V. A. Sokolov and G. Mogilevskii in Russia during 1934-1935 showed halo-like concentrations at the surface of the earth that outlined the limits of underlying oil-bearing structures. Within these halo-like structures, both methane and ethane gases were identified among other heavier hydrocarbons detections.
Dr. Sylvain Pirson, from the University of Texas, conducted laboratory and field experiments from 1963 to 1983 on electro-telluric, magnetic, and electric fields as a method for exploring and developing hydrocarbon, geothermal, sulfide ore, and other mineral reserves. Through his initial work, Pirson successfully developed analyses of spontaneous potential (SP) well logs. In the 1970s, Pirson developed a geophysical method he called “Line Integral Method of Magneto-Electric Exploration” (Pirson, 1976). Subsequent predictive assessments encompassing 19 oil and gas fields in 1984 showed a success rate greater than 85% in the prediction of producing wells compared to “dry holes” in a variety of fields in the USA (Herzfeld, 1984).
Dr. Pirson suggested, and confirmed in his University of Texas laboratories, that geochemical modifications caused by the proximity to these reservoirs, deposits, and aquifers would spontaneously generate these electro-telluric and corresponding near-earth electric fields. The exploration method consisted of measuring magnetic and electric perturbations caused by these electro-telluric currents in the existing magnetic and electric fields of the earth. When these electro-telluric currents exist, the contention made was that closed line-integrals of the earth’s magnetic field are a direct function of the magnitude and polarity of electro-telluric current flux densities generated by the underground mineral deposits. This is different than magneto-telluric measurements which facilitate deep crustal studies of the earth to depths of 50 to 100 km for determining rock resistivities (Cagniard, 1970).
Fundamentally, the first applications of electric fields for exploration of hydrocarbons occurred in the 1940s in the United States and in the 1950s in the USSR. However, it has only been within the last 30 years, following significant advancements in physics, mathematics, computing capability, and instrumentation, that the field of Quantum Geoelectrophysics (QGEP) has emerged and, only in the last 20 years that Quantum Direct Matter Indicator (QDMI) technologies have been applied.
Fundamentals
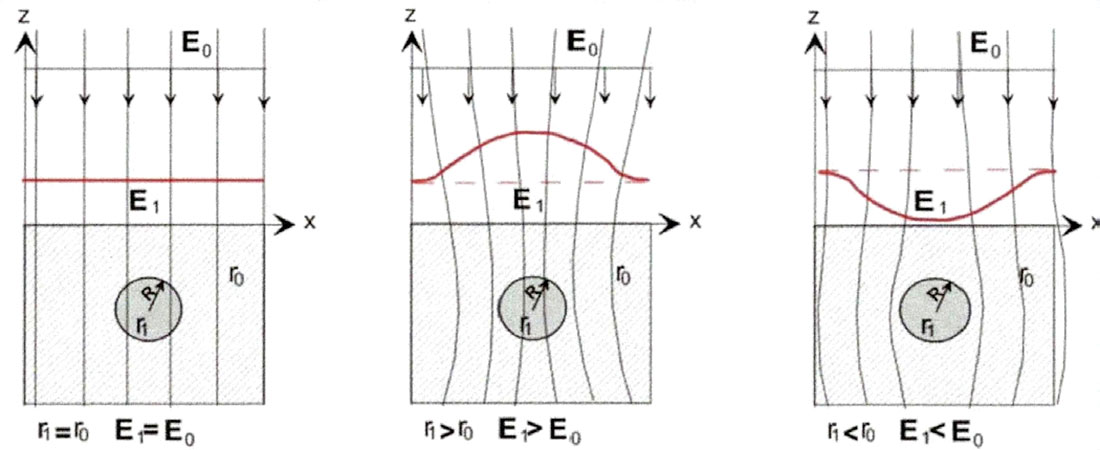
The method of QGEP resonant frequency analysis (ITI GEO, 2016) is based on the principle of polarization of “anomalous” geologic objects in the natural quasi-stationary electric field of the earth (Zaborovskiy, 1963). Abnormalities, or geophysical anomalies, are identified spatially or in cross-section to determine area, depth, and thickness based on resistivity differences between the target substance and the host medium. Generally, the resistance of specific mineral (ores) deposits and water-bearing formations are less than the matrix rock, and therefore yield a negative relative response in natural electric field of the earth (Eo). For hydrocarbon reservoirs, underground cavities (such as karst formations or caves), quartz and other mineral deposits, the resistivity tends to be more than the matrix rock, and therefore yields a positive relative response. The presence of these anomalies distorts the primary natural electric field of the earth, which can be detected with the proper equipment. Depending on the resistivity of the anomaly within the natural electric field of the earth, the overall value of the field strength due to polarization of the anomaly is subject to change, either negatively or positively. For example, the electric field intensity, E1, for a spherical object in a vacuum can be calculated by the following mathematical relationship:
E1 (x, z) = E0 (1 – (r0 - r1/r0 + 2r1) x (R3/ (X2 + Z2) 3/2)
where:
E0 = electric field of the earth
X = measurement along the surface of the earth
Z = depth below (negative) or height above (positive) the surface of the earth
r0 = specific environmental resistance of the medium
r1 = resistivity of the anomalous object
R = radius of the spherical object
If r1 = r0, then there is no detectable resistivity anomaly in the electric field of the earth (E0). If r1 > r0, the field strength should increase to E1 > E0. This is true for hydrocarbon reservoirs, fresh groundwater-bearing intervals and other objects with high resistivity, which appear as anomalies with a positive value relative to the earth’s natural electric field. If r1 < r0, then E1 < E0 and the anomalies would appear as negative relative to the earth’s natural electric field. Figure 1 illustrates the described relationships.
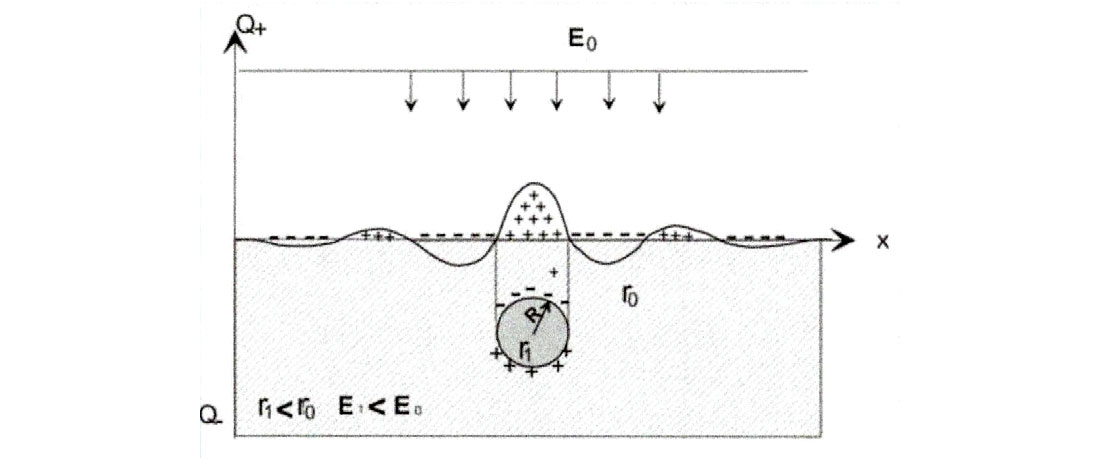
In the case where the resistance of a spherical object is much less than the matrix of the rock, a positive electric charge response will occur in the near-earth electric field (E0). Figure 2 illustrates this principle.
To determine the depth and thickness of geological objects or anomalies, a method for measuring vertical electric resonance is used to create Vertical Virtual Well (VVW) surveys. The technique and methodology are again based on the principle of polarization of geological objects in the natural electric field of the earth. These polarized geological objects are considered anomalous polarized layers. The polarized object in the natural electric field of the earth (E0) forms a dipole. The upper edge of the dipole is the surface of the polarized object. The length of the dipole is the depth to the polarized object as shown in Figure 3. When the value of E0 increases or decreases, the dipole generates an electromagnetic pulse with a wavelength L = 2H, where H = c/2f, f = frequency of the EM radiation from the geological object, and c = the speed of light.
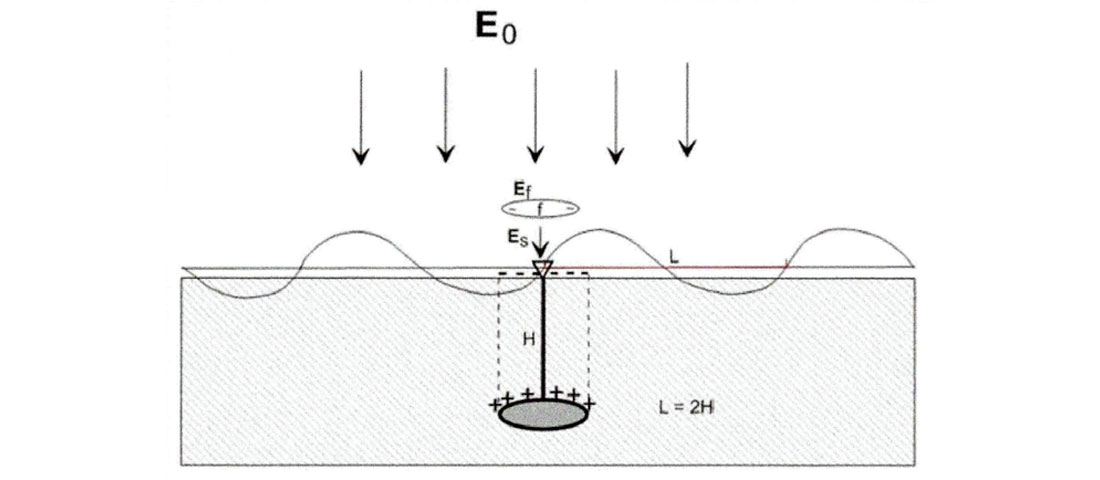
Field data acquisition equipment for an earth-based VVW survey includes an electromagnetic (EM) generator, antennae, earth electric field monitor, among other equipment. Earth's naturally pulsed electric field is monitored on the surface of the earth. A vertical EM pulse microburst (microseconds) is transmitted into the earth's electric field in a coherent wave that creates an additional field (Ef). On relaxation of the excited electric field back to equilibrium, an EM pulse results. By analysing the frequency of the resulting EM pulse on relaxation, the depth (H) of the geologic anomaly (i.e. target substance) and its thickness and concentration can be determined: the amplitude of the resulting EM pulse is the concentration of that substance, and the depth is calculated by examining the total excitation (Es) field dipole, represented as Es = E0 + Ef.
Applications of Quantum Geoelectrophysics
The three applications of QDMI technologies that naturally evolved from the experimental research and development of QGEP were: i) satellite-based surveys; ii) earth-based area intensity surveys (AIS); and, iii) earth-based VVW surveys that can determine the area of target substance anomalies, intensity of the target substance, its depth, thickness, and pressure (if applicable and required), lithology, as well as temperature (if applicable and required).
QGEP, a non-classical approach to geophysical exploration, applies three different areas of physics:
i) Quantum,
ii) Traditional, and
iii) Atmospheric.
Through the integration of these three fields of physics, investigative efforts are focused specifically on the naturally occurring electric field of the earth. The aspect of quantum physics utilized is called Quantum Electrodynamics (QED) which involves the interaction of photons of light with atomic lattices. Atmospheric physics, on the other hand, with a specific focus on the natural electric field of the earth, exists as a bridge between traditional geophysics and the quantum physics. The principles and practices that govern the application of QGEP methods are as follows:
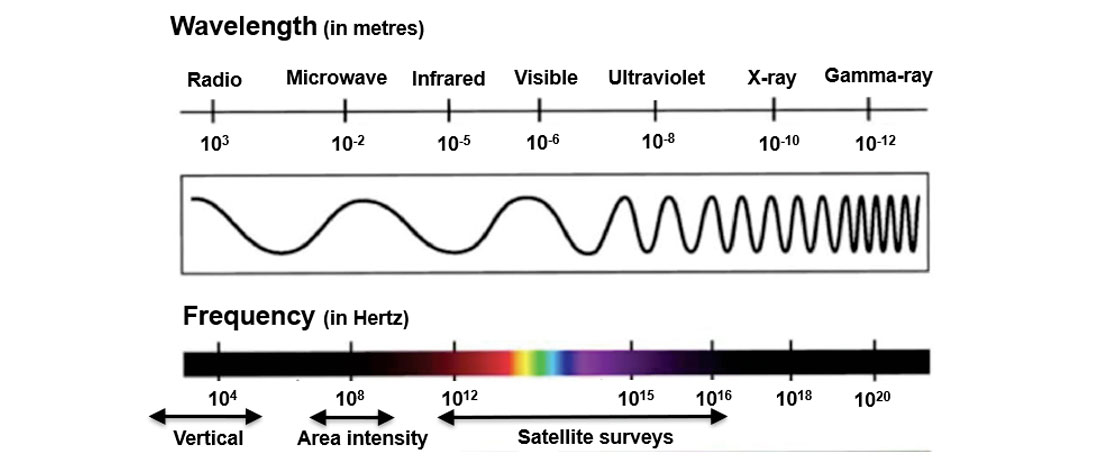
1. All elements, matter, and substances have a unique electromagnetic resonant frequency (EMRF) that has been determined for hundreds of different materials to date. Determinations can be achieved in laboratory or in situ via wellbore measurements. The nature of the target substance can be determined using Electromagnetic Spectrum Spectroscopy as shown in Figure 4.
2. Earth’s natural pulsed electromagnetic field (ENPEMF) (Vorob’ev, 1970) emissions, as well as the general electric field emissions, are contained in multi-spectral satellite data. The specific EMRF of a target substance can be isolated from the general ENPEMF emissions and then analyzed, processed, interpreted, and displayed. Initial analysis generates a relative AIS for a given area, and this is followed by the derivation of vertical scanning simple (VSS) and detailed (VSD) surveys at the locations of highest EMRF intensity points for the target natural resource substance. VSS resolves the depths and thickness associated with a specific station or area intensity value in bulk (i.e. 5-10 m, 20-30 m, etc). The VSD interprets the z or vertical scanning at discreet intervals (0.5 m, 1.0 m, 3.0 m, etc) if the resolution of the QDMI RFRS survey sufficient to determine these intervals accurately.
3. The ENPEMF is measured accurately, with all variations and perturbations, forming a baseline for earth-based QDMI AIS and VVW searches for geological anomalies related to a target substance.
4. Different multi-spectral channels, with resolution ranging from 30 m/pixel to 0.5 m/pixel, are used for satellite-based surveys. The choice of scale, and therefore specific satellite data employed, depends on the size (length and width) and nature of the target substance (i.e. reservoir-scale versus local accumulation).
5. In terms of earth-based QDMI AIS, the range of resolution varies between 0.5 m to 50 m on surface, as specified or required. For earth-based QDMI Vertical Surveys (VVW), vertical resolution varies between 0.5 m to 5.0 m (with a normal processing at 1.0 m depth intervals) to obtain the intensity, depth, and thickness of the target substance anomaly accurately.
Mexico Water Evaluation Project:
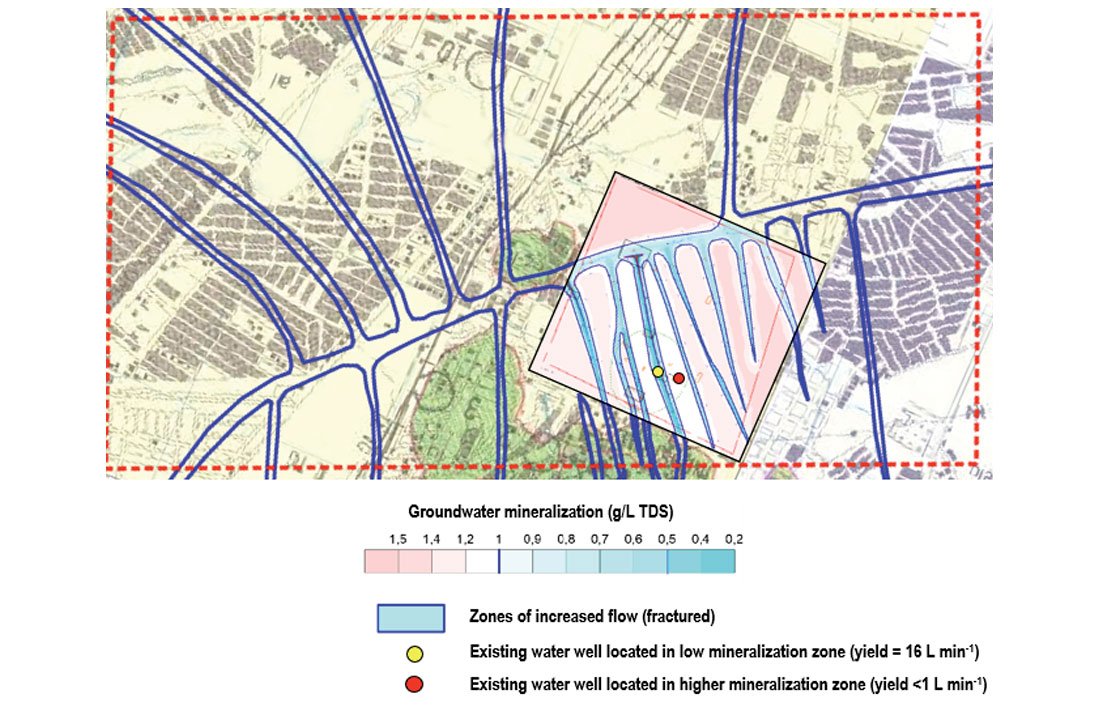
In the latter part of 2017, Integrative Technologies International Inc (ITI) was contacted by a company in Mexico to conduct an industrial groundwater supply investigation covering a 10 km2 area of interest (AOI), as illustrated in Figure 5 by the dotted red outline. An additional AOI of 1 km2 (inset in Figure 5) also formed part of the contract survey program. The regional and area surveys were conducted using resonant frequency remote sensing (RFRS) satellite-based technologies (Hatala and Gurba, 2017) over a busy metropolitan area. The use of remote sensing survey technologies significantly reduced the cost, time, and safety issues related to working in congested areas when compared with traditional ground-based surveys. The client faced a significant challenge since two wells drilled within 100 m of each other produced water at unexpectedly different flow rates, which if not resolved, could have compromised a capital expansion project for their facility. This case study showcases the efficacy of QGEP and QDMI technologies in prospecting for, identifying, and resolving (both spatially and vertically) aquifer intervals and associated water quality (i.e., degree of mineralization, or salinity) within a complex hydrogeological setting.
Figure 5 illustrates a portion of the QDMI satellite survey results. The colour graduated bar represents the varying degrees of groundwater mineralization within the upper 300 m of the geologic strata, and the blue 2D outlines the aquifer channels in the AOIs.
To frame the hydrogeologic setting, Integrated Sustainability was retained by ITI to conduct a baseline hydrogeological assessment of the regional and specific area of investigation using existing geological records from the client’s previous drilling programs and other open file regional- scale investigations and journal articles.
Results indicated the presence of a veneer of unconsolidated alluvium ranging from less than 10 m to more than 50 m thick across the study area, underlain by rocks consisting of alternating shaley limestones and cleaner carbonate intervals. Further review of structural data in the broader region (including the prevailing stress regime) identified the presence of a structural fabric comprised of a series of folded beds with major normal faults. The hypothesis formed was that these structural features had likely resulted in enhanced permeability trends in certain rock formations due to extensional and compressional fracturing and subsequent karsting by infiltrating waters.
Drilling records and open hole geophysical surveys for two existing water wells confirmed the presence of a variable thickness of unconsolidated alluvium followed by shaley Figure 5. Results of the QDMI satellite survey. Figure 4. EM frequency bands and ranges assessed using QDMI methods. OCTOBER 2018 CSEG RECORDER 35 limestone, and finally a relatively clean limestone. Also identified in one of the wells was a zone of karsted limestone at a depth of approximately 280-300 m. Previous testing of the two wells indicated a sustained yield rate of 16 litres per minute (L min-1) in the well accessing the karsted interval and a rate of less than 1 L min-1 in the other.
Following completion of the QDMI satellite surveys and data processing, the results indicated the presence of linear trends of less mineralized groundwater juxtaposed areas of more highly mineralized groundwater (Figure 5). When overlain on the QDMI result, the higher yield water well was found to be located within one of the linear features identifying the presence of lower mineralized water (yellow dot in Figure 5), while the other was located outside (red dot in Figure 5). Previous chemical results from each of the wells indicated total dissolved solids (TDS) values of 0.394 g/L and 1.000 g/L, respectively, which compares closely with the TDS values mapped by the QDMI satellite survey: less than 0.5 g/L for the high yield well and 1 g/L or for the lower yield well).
Despite a slight offset of depths, the Vertical Scanning Simple (VSS) profile associated with the higher yield water well (yellow dot image on Figure 5) also showed a good degree of correlation (within 10%) with the open hole logs, particularly with respect to the karsted interval located at a depth of 280-300 m. It should be noted that the VSS profile was based on multi-spectral data collected by a satellite orbiting more than 750 km from the earth’s surface, some degree of difference should be expected. Unfortunately, a ground-based program (QDMI VVW) to collect higher-resolution, depth-resolved profiles was not part of the initial investigation and evaluation program. However, given the success of the initial QDMI RFRS and VSS evaluation, plans are being formulated to conduct an earth-based field-evaluation survey (AIS and VVW) in the third quarter of 2018 to refine the results of this initial reconnaissance and detailed QDMI RFRS Surveys program to choose exact locations for future water well design, drilling, and aquifer evaluation.
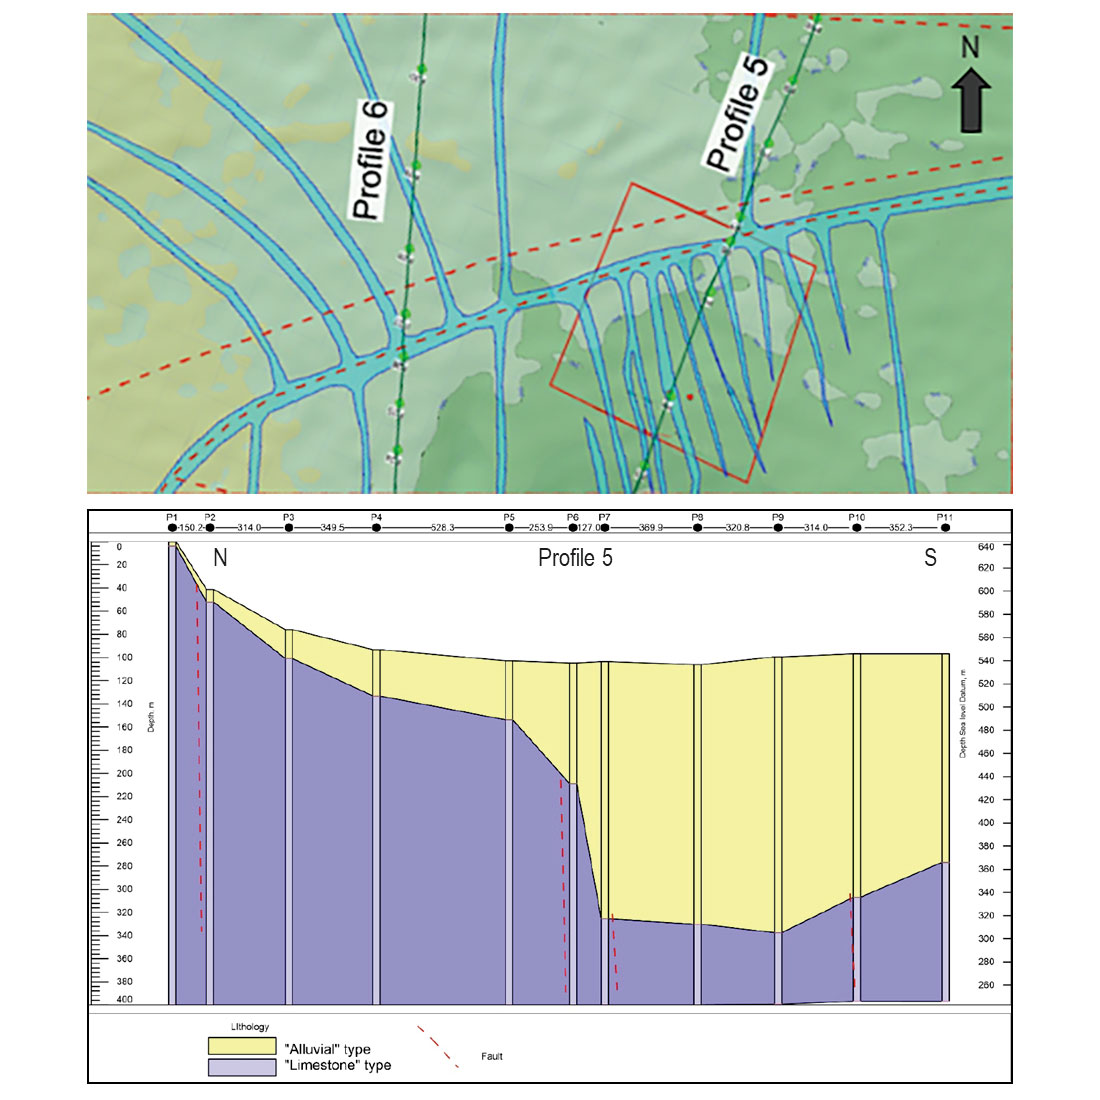
Despite the lack of ground-based VVW surveys, the QDMI RFRS and VSS surveys were used to assess the structural fabric of the area. The upper image of Figure 6 shows a transect developed from a number of VSS surveys for lithology made during this initial QDMI Satellite regional and detailed survey program. In this case, the presence of normal faulting in the area was confirmed, leading to an enhanced understanding of the conceptual site hydrogeological model and the determination of a sustainable groundwater supply for the client.
Comparisons of Traditional and QDMI Methods
In the world of groundwater exploration and assessment, the application of traditional geophysics has been the norm for many decades. Some of the more familiar techniques are outlined in Table 1, along with a brief description of each.
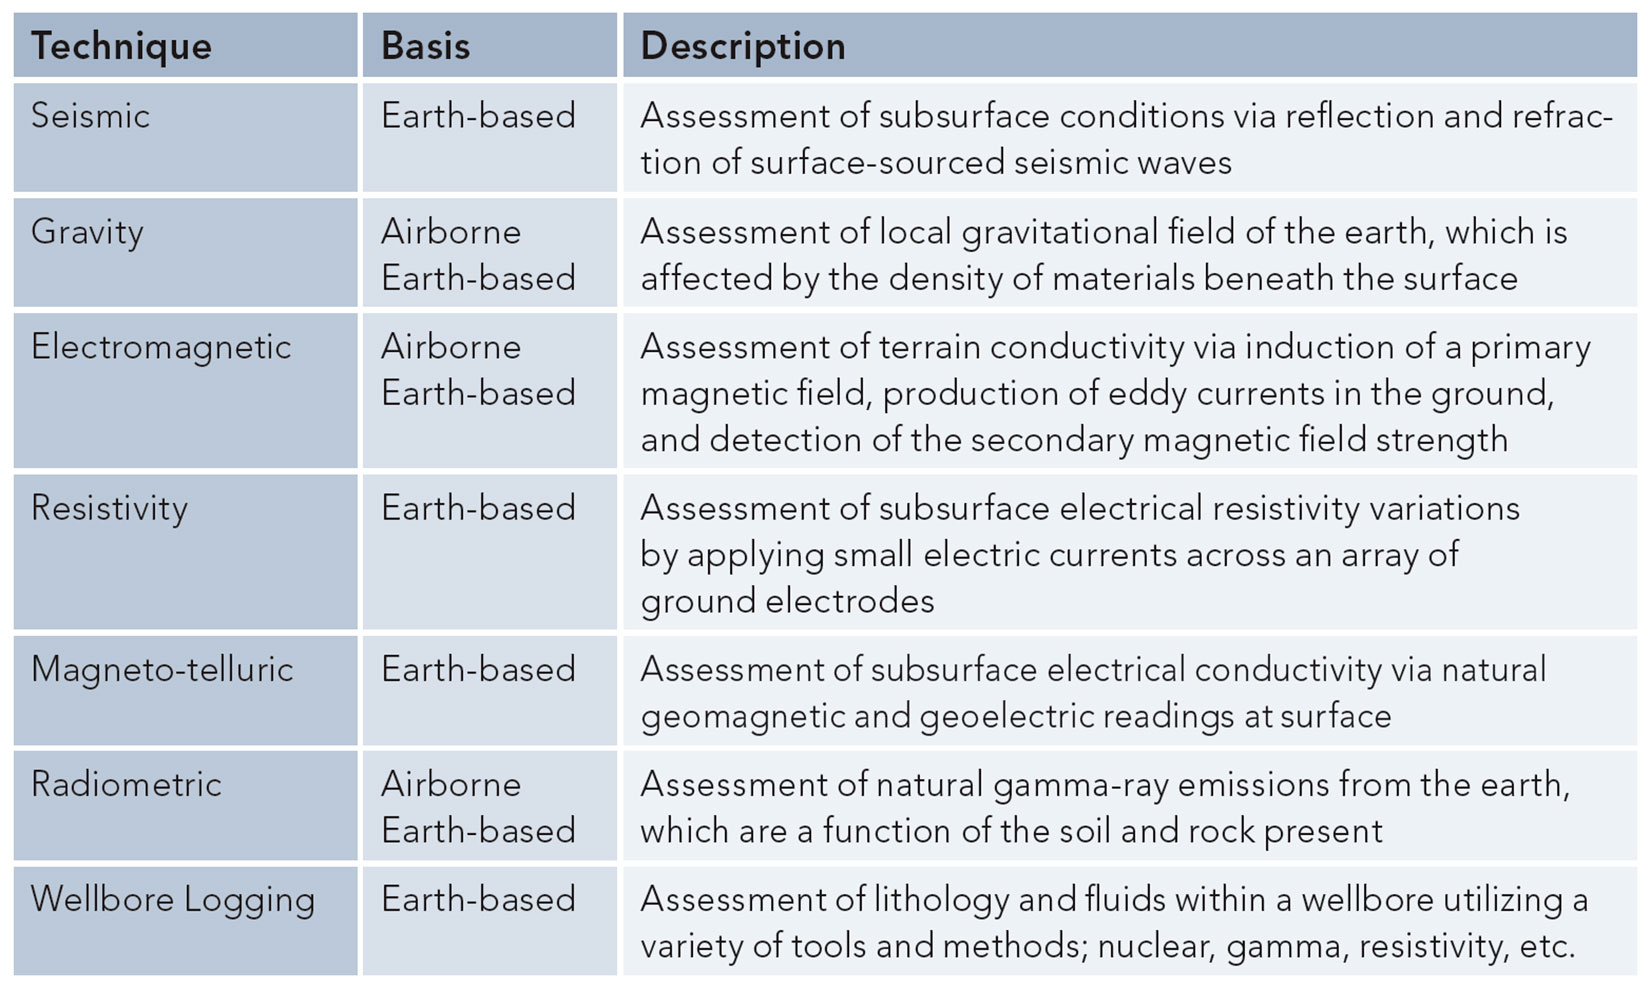
Depending on the intent of the traditional exploration program, several different techniques are normally applied; either from the air, using fixed-wing craft or helicopters, or on the ground. The applicability and limitations of each technique, based on level of resolution at various spatial scales, has been well established. In all cases, the geological material assessment ends up being inferred from prior knowledge of the geologic setting. This lack of definitive information about the geological material introduces a large degree of inference and interpretation, and therefore provides potential risk of failure. Nonetheless, these techniques have served the exploration geophysics community well.
In comparing traditional geophysical technologies with QDMI technologies, four main conclusions can be drawn. QDMI Technologies tend to be more: i) efficient (less time); ii) effective (accurate, reliable, repeatable, robust); iii) environmentally friendly (little to no environmental, ecological, or cultural impact); and iv) economic (lower cost and provides significantly more results than traditional techniques).
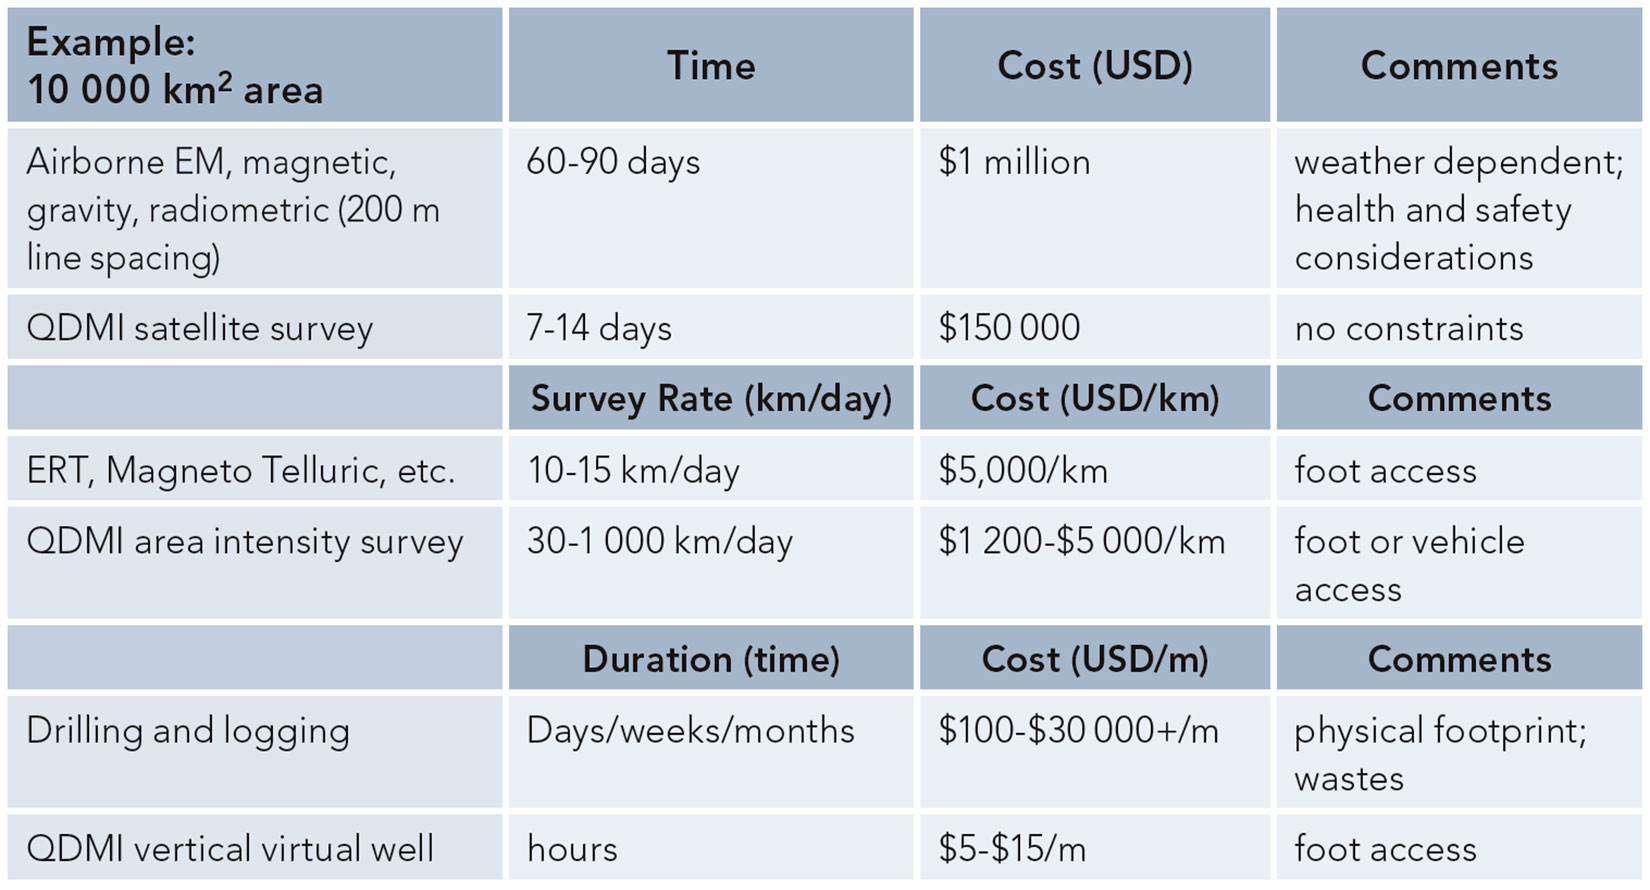
Table 2 provides a comparison of time and cost associated with traditional airborne and earth-based geophysical methods and QDMI technologies. By comparison, QDMI methods represent a lower cost, more time efficient approach to reconnaissance level and refined ground-based geophysical surveys, and therefore can provide a reasonable alternative to the more traditional approaches.
Summary
- From the first application of Earth’s natural electric field exploration in the 1940’s, QGEP and the resulting QDMI technologies have re-emerged since the mid- to late-1990s as a viable, cost-effective and proven technology, capable of delineating groundwater intervals at significant depths. Surveying for other natural resources such as hydrocarbons, minerals, and metals extends the utility of this technology further into the natural resource evaluation space.
- Existing satellite-based multi-spectral data is freely available in the public domain, or can be purchased at higher resolutions, for rapid Electromagnetic Resonant Frequency (EMRF) processing of target substances at the regional, intermediate, or local scales for detailed assessment.
- Identified resource anomalies can be easily targeted for more refined assessment using earth-based QDMI Area Intensity Surveys to identify the highest EMRF signal intensity for a given target substance, as well as other geological anomalies that can be geo-referenced.
- High altitude vertical scanning (satellite-based) and/or earth-based surveys are produced via processing of resonant frequency signals contained in multi-spectral satellite data or generated by controlled source electromagnetic pulses. The surveys indicate the target substance anomaly depth, thickness, concentration, pressure (if applicable and needed) and temperature (if applicable and needed). The result is an increase in the probability of success for subsequent drilling and testing programs.
- QDMI technologies provide another useful approach to groundwater exploration in remote and/or difficult to access regions such as high-density metropolitan areas, deserts, mountainous terrain, ice covered regions, and heavily vegetated areas. The results to date have been positive concerning multiple natural resource target substances, including groundwater.


Join the Conversation
Interested in starting, or contributing to a conversation about an article or issue of the RECORDER? Join our CSEG LinkedIn Group.
Share This Article